. 2020 Mar;69(3):473-486.
doi: 10.1136/gutjnl-2019-318263. Epub 2019 Jun 5.

Modulation of cytokine patterns and microbiome during pregnancy in IBD

Affiliations

Modulation of cytokine patterns and microbiome during pregnancy in IBD

Janine van der Giessen et al. Gut. 2020 Mar.

Abstract

Objective: Pregnancy may affect the disease course of IBD. Both pregnancy and IBD are associated with altered immunology and intestinal microbiology. However, to what extent immunological and microbial profiles are affected by pregnancy in patients with IBD remains unclear.

Design: Faecal and serum samples were collected from 46 IBD patients (31 Crohn's disease (CD) and 15 UC) and 179 healthy controls during first, second and third trimester of pregnancy, and prepregnancy and postpartum for patients with IBD. Peripheral blood cytokine profiles were determined by ELISA, and microbiome analysis was performed by sequencing the V4 region of the bacterial 16S rRNA gene.

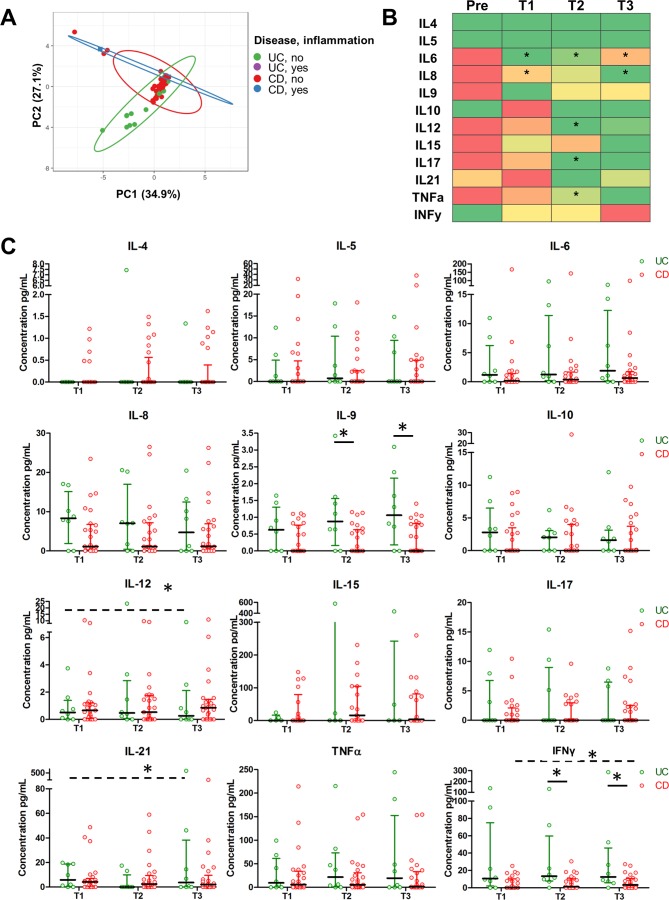
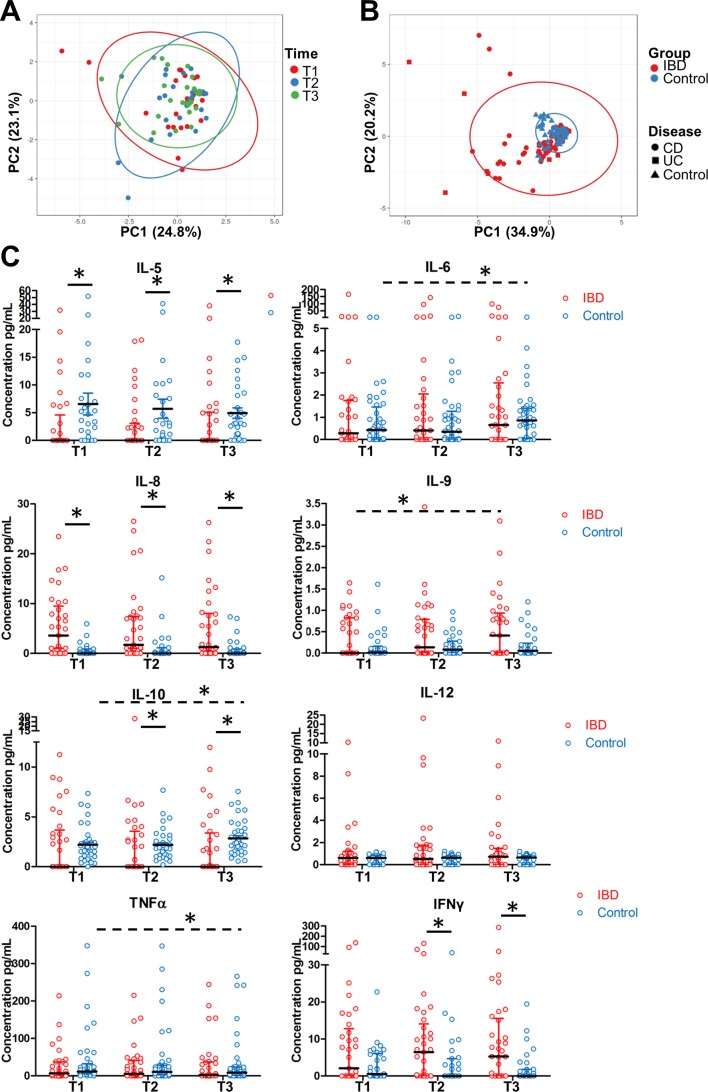
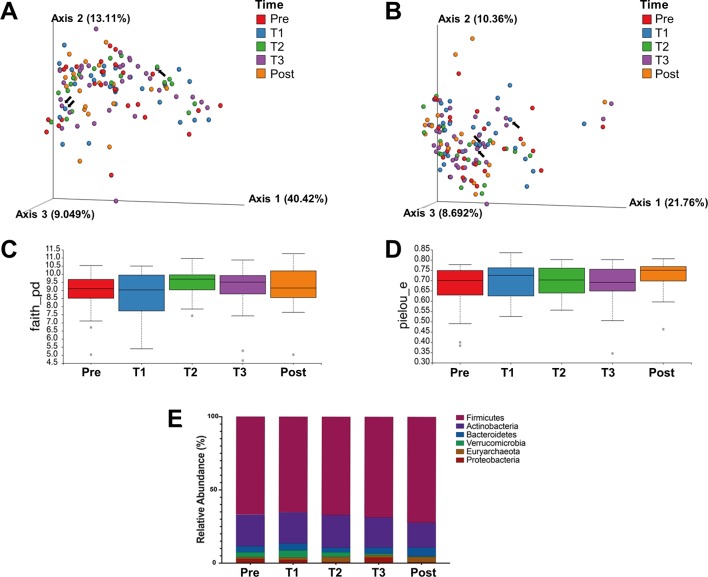
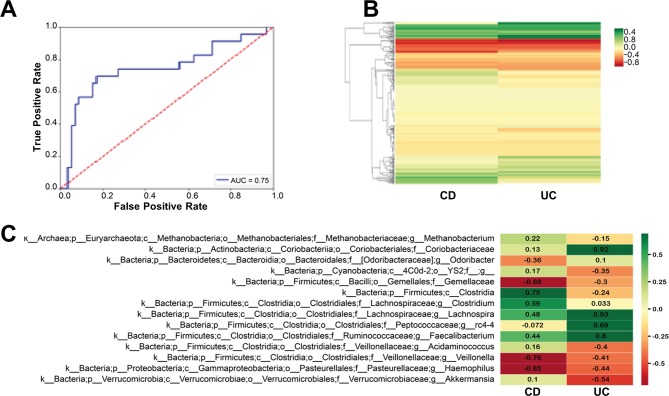
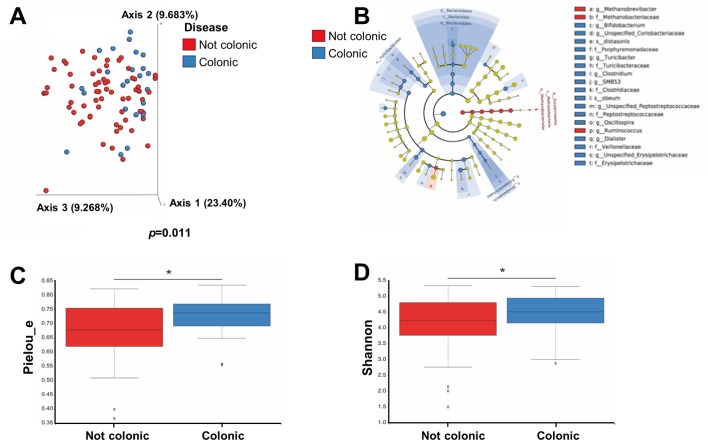
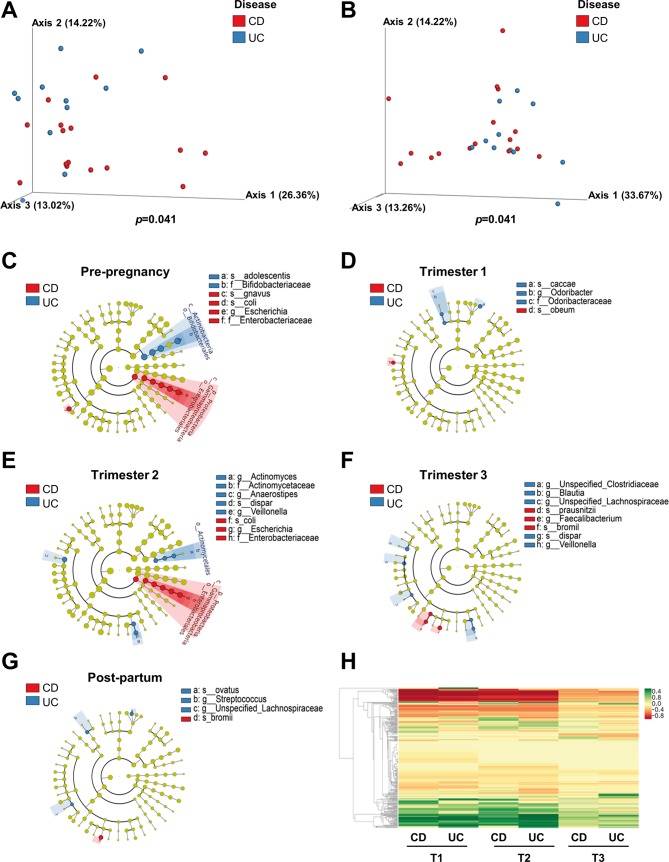
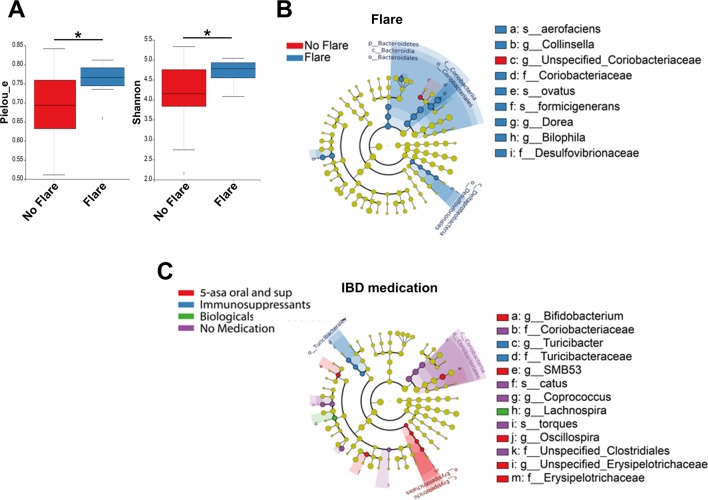
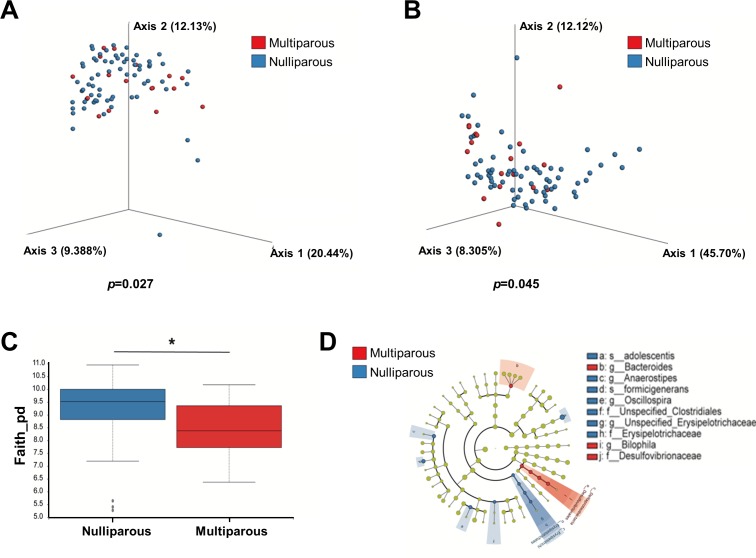
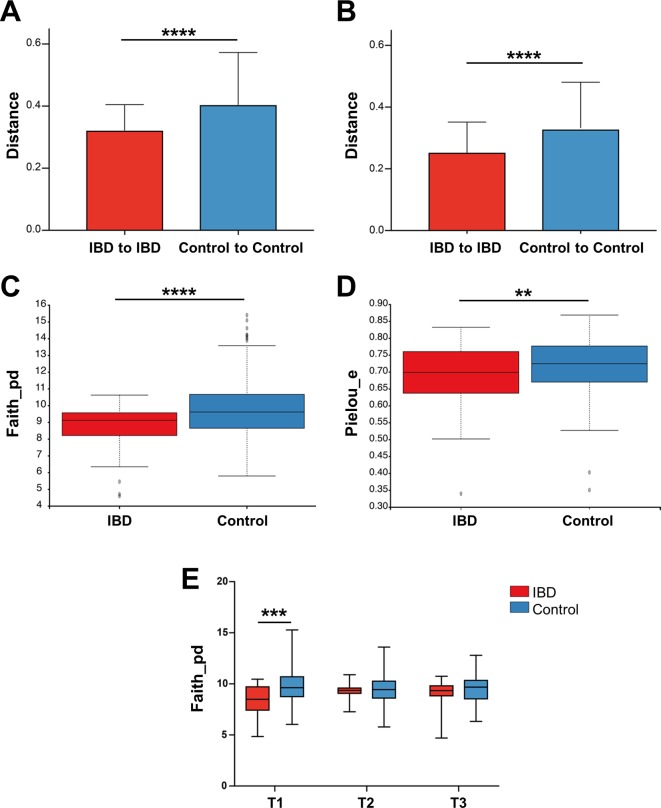
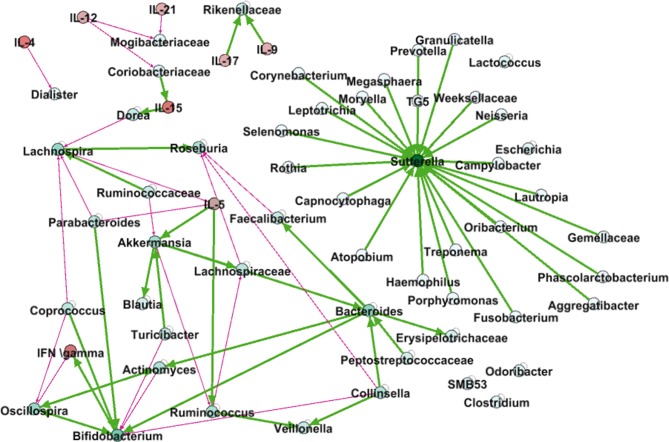
Results: Proinflammatory serum cytokine levels in patients with IBD decrease significantly on conception. Reduced interleukin (IL)-10 and IL-5 levels but increased IL-8 and interferon (IFN)γ levels compared with healthy controls were seen throughout pregnancy, but cytokine patterns remained stable during gestation. Microbial diversity in pregnant patients with IBD was reduced compared with that in healthy women, and significant differences existed between patients with UC and CD in early pregnancy. However, these microbial differences were no longer present during middle and late pregnancy. Dynamic modelling showed considerable interaction between cytokine and microbial composition.

Conclusion: Serum proinflammatory cytokine levels markedly improve on conception in pregnant patients with IBD, and intestinal microbiome diversity of patients with IBD normalises during middle and late pregnancy. We thus conclude that pregnancy is safe and even potentially beneficial for patients with IBD.

Keywords: crohn’s disease; cytokines; inflammatory bowel disease; intestinal microbiology; ulcerative colitis.


Conflict of interest statement

Competing interests: None declared.

Figures

Figure 1
Figure 1
Proinflammatory cytokine serum levels decrease on conception and are stable over time during pregnancy in patients with UC and CD. (A) Principal coordinate analysis shows no overall cytokine changes during pregnancy between patients with UC patients and CD. (B) Median levels of individual cytokines are represented by a colour gradient with green indicating the lowest value for during pregnancy and red indicating the highest value. Significant decreases in several proinflammatory cytokine levels are observed in pregnancy as compared with preconception (indicated by asterisk). With the exception of TNFα, similar significant decreases were seen when patients with CD were analysed separately (not shown). (C) Comparisons of individual cytokines between patients with CD and UC for the three trimesters. Median and IQR are shown. Significant differences (Friedman test, indicated by dashed lines) for different trimesters were observed for patients with UC for IL-12 and IL-21. Significant differences between patients with UC and CD in a given trimester were seen for IL-9 and IFNγ (Mann-Whitney test, indicated by solid lines). CD, Crohn’s disease; IL, interleukin.
Figure 2
Figure 2
IL-6 and IL-10 serum levels rise during pregnancy in healthy controls but not patients with IBD. (A) Principal coordinate analysis (PCA) showing lack of overall cytokine changes during healthy pregnancy. (B) PCA showing that overall cytokine patterns do not cluster separately between patients with IBD and controls. Samples from first, second and third trimester were included in the analysis. (C) Comparisons of individual cytokines between patients with IBD and healthy controls for all three trimesters. Median and IQR are shown. Significant differences (Friedman test, indicated by dashed lines) for different trimesters were observed in healthy controls for IL-6, IL-10 and TNF-α and for IL-9 in patients with IBD. Significant differences between patients with IBD and healthy controls in a given trimester were seen for IL-5, IL-8, IL-10 and IFNγ (Mann-Whitney test, indicated by solid lines). IL, interleukin.
Figure 3
Figure 3
Microbial diversity parameters of patients with IBD do not change throughout pregnancy. Faecal samples from patients with IBD were collected at five time points: prepregnancy, first, second, third trimester and postpartum (27, 27, 21, 36 and 19 samples, respectively). (A and B) β-diversity using principal coordinate analysis of unweighted (A) and weighted (B) UniFrac distances. The black arrows point to samples of patients who used antibiotics. (C and D) α-Diversity using Faith’s phylogenetic diversity (C) and Pielou’s evenness plot (D) measurements. (E) Taxonomy plot at the phylum level.
Figure 4
Figure 4
Overall microbiome composition of patients with CD differs from patients with UC. (A) ROC curve of classification of UC (n=41) versus CD (n=89). (B) Spectral clustering of bacteria based on the bacterial differences between the UC and CD. (C) Bacteria with differences between UC and CD with significance with p<0.05. The marked values are the average (10log) value for each bacterium in each group. CD, Crohn’s disease; ROC, receiver operating characteristic.
Figure 5
Figure 5
The microbiome of patients with CD suffering from colon disease is different than that of patients with non-colonic disease. Patients with CD were divided according to disease location: colonic (n=24) and not colonic (n=65). (A) β-diversity using principal coordinate analysis of unweighted UniFrac distances (p=0.011) (B) Significantly abundant taxa in each of the groups by LEfSe analysis. (C and D) α-diversity using (C) Pielou’s evenness plot (p=0.02) and (D) Shannon’s diversity index (p=0.043). LEfSe, linear discriminant analysis effect size.
Figure 6
Figure 6
The microbiomes of patients with CD and UC are dominated by different species at each time point. (A and B) β-diversity using principal coordinate analysis of unweighted (A) and weighted (B) UniFrac distances (p=0.041) of prepregnancy samples (CD n=16, UC n=11). (C–G) Cladogram of significant differentially abundant microbial taxa obtained using LEfSe of prepregnancy (C), first (CD n=19, UC n=8) (D), second (CD n=16, UC n=5) (E), third (CD n=25, UC n=11) (F) trimester and postpartum (CD n=13, UC n=6) (G) gut microbiomes. (H) Spectral clustering of bacteria based on the difference between the UC and CD and over all trimesters. CD, Crohn’s disease; LEfSe, linear discriminant analysis effect size.
Figure 7
Figure 7
Microbiota of patients with CD differs when suffering from a flare. Patients were divided according to those who suffered a flare (eight samples) during gestation compared with those with stable disease (51 samples) and by IBD medication: 5-ASA oral and sup, immunosuppressants, biologicals and no medication (3, 14, 12 and 23 samples, respectively). (A) α-Diversity using Pielou’s evenness plot (p=0.025) and Shannon’s diversity index measurements (p=0.03) comparing flare and no flare samples. (B and C) Cladogram of significantly differentially abundant microbial taxa obtained using LEfSe divided by flare occurrence (B) or IBD medication (C). CD, Crohn’s disease.
Figure 8
Figure 8
The microbiome of multiparous pregnancies is different from nulliparous pregnancies. Faecal samples collected during gestation were divided according to patients’ previous pregnancies into nulliparous (n=67) versus multiparous (n=17). (A and B) β-diversity using principal coordinate analysis of unweighted (A) and weighted (B) UniFrac distances (p=0.027 and p=0.045, respectively). (C) α-Diversity using Faith’s phylogenetic diversity (p=0.017). (D) Differently abundant taxa in each of the groups by LEfSe analysis.
Figure 9
Figure 9
Patients with IBD have more uniform microbiomes than healthy controls. A comparison of the gut microbiomes of IBD (130 samples) and control (236 samples) pregnant women. (A and B) Beta-diversity of unweighted (A) and weighted (B) (p=0.001) UniFrac distances. (C and D) α-Diversity using (C) Faith’s phylogenetic diversity (p<0.0001), and (D) Pielou’s evenness plot (p=0.008) measurements. (E) Faith’s phylogenetic diversity comparing IBD and control samples by pregnancy trimesters (p=0.0004).
Figure 10
Figure 10
Correlation between current value of the source node and the change in the value of a target node. Thick green arrowsrepresent positive correlations, while thin red arrowsrepresent negative correlations. A thin grey round arrow represents a correlation between the current value of a feature and future change. Cytokines are marked in red nodes.

Comment in

References

    1. Liu JZ, van Sommeren S, Huang H, et al. . Association analyses identify 38 susceptibility loci for inflammatory bowel disease and highlight shared genetic risk across populations. Nat Genet 2015;47:979–86.10.1038/ng.3359 - DOI - PMC - PubMed
    1. Khor B, Gardet A, Xavier RJ. Genetics and pathogenesis of inflammatory bowel disease. Nature 2011;474:307–17.10.1038/nature10209 - DOI - PMC - PubMed
    1. Reddy D, Murphy SJ, Kane SV, et al. . Relapses of inflammatory bowel disease during pregnancy: in-hospital management and birth outcomes. Am J Gastroenterol 2008;103:1203–9.10.1111/j.1572-0241.2007.01756.x - DOI - PubMed
    1. Bröms G, Granath F, Linder M, et al. . Birth Outcomes in Women with Inflammatory Bowel Disease. Inflamm Bowel Dis 2014;15:1.10.1097/MIB.0000000000000060 - DOI - PubMed
    1. Santos MPC, Gomes C, Torres J. Familial and ethnic risk in inflammatory bowel disease. Ann Gastroenterol 2018;31:14–23.10.20524/aog.2017.0208 - DOI - PMC - PubMed

MeSH terms