. 2019 Sep;68(9):1730-1746.
doi: 10.2337/db18-0927. Epub 2019 Jun 5.

Targeting BCAA Catabolism to Treat Obesity-Associated Insulin Resistance

Affiliations

Targeting BCAA Catabolism to Treat Obesity-Associated Insulin Resistance

Meiyi Zhou et al. Diabetes. 2019 Sep.

Abstract

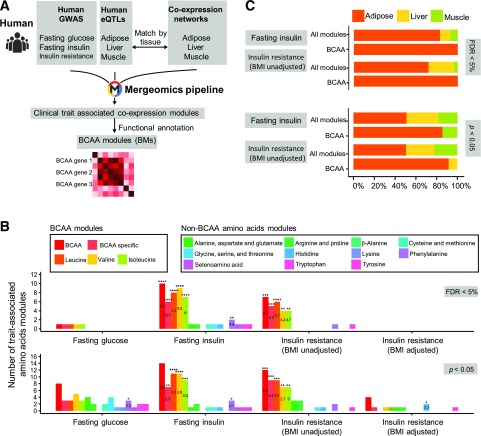
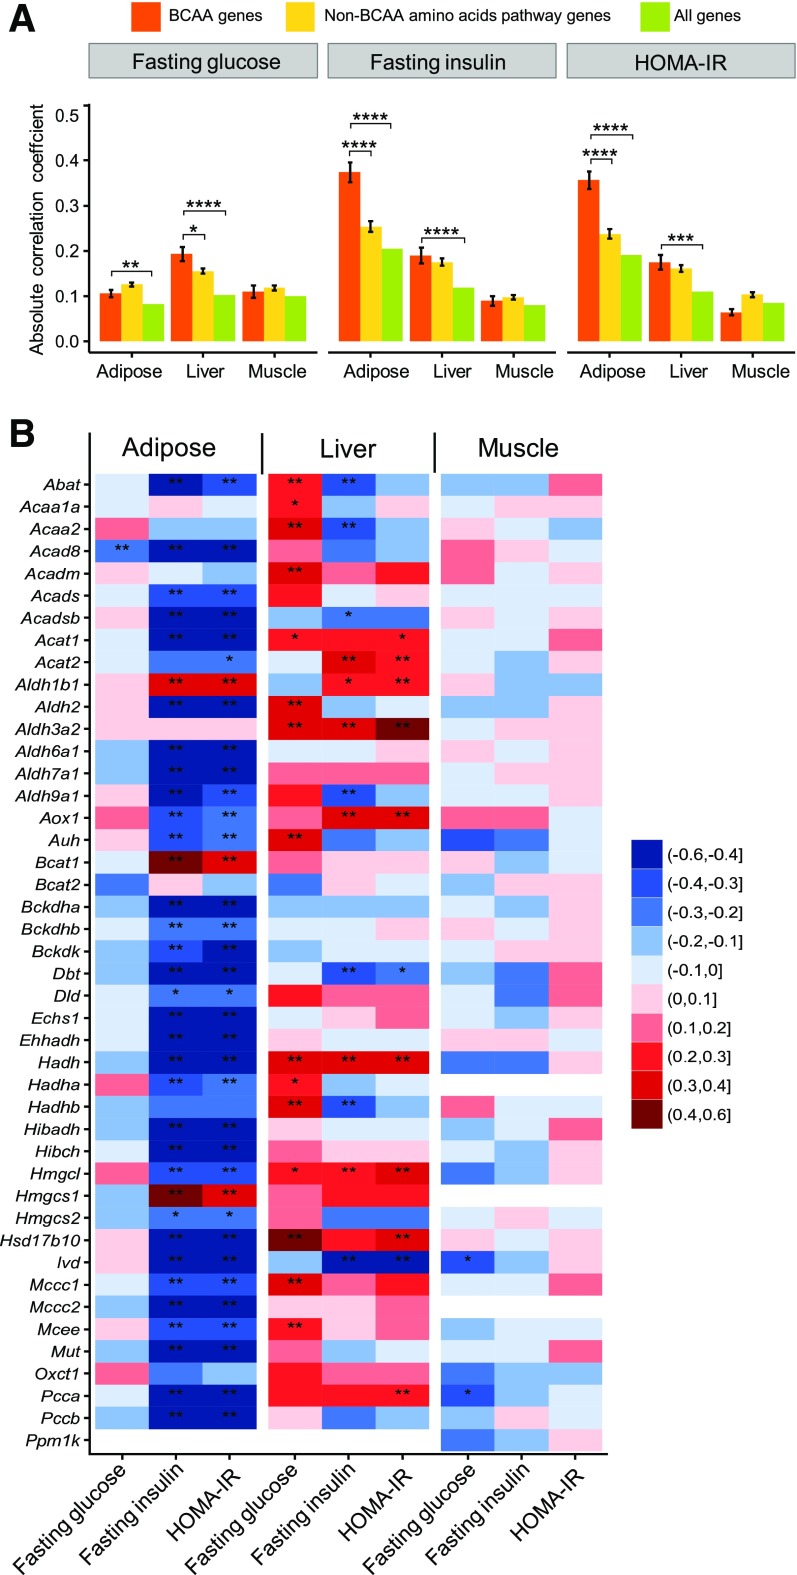
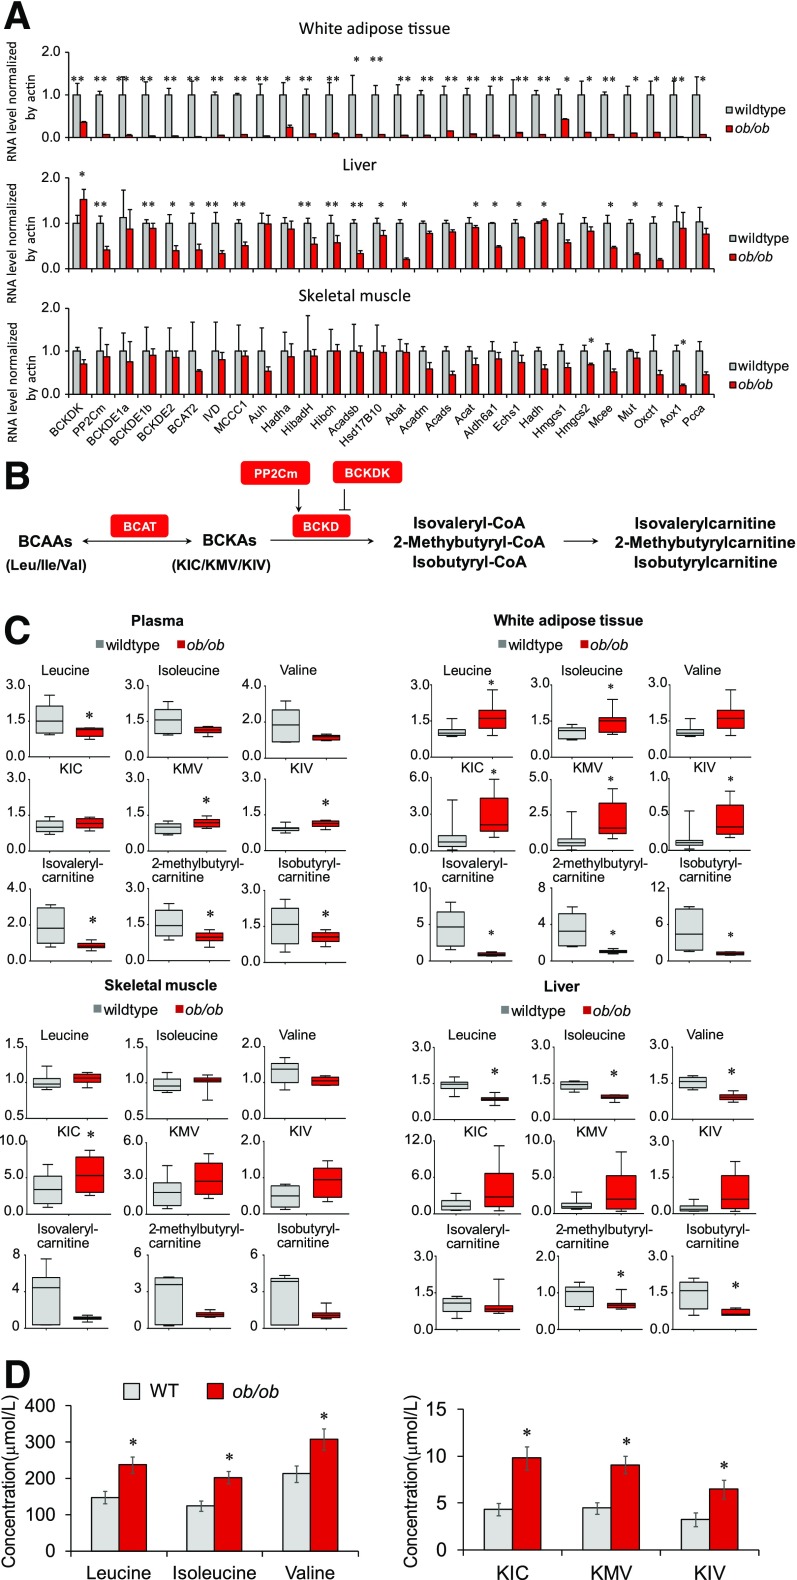
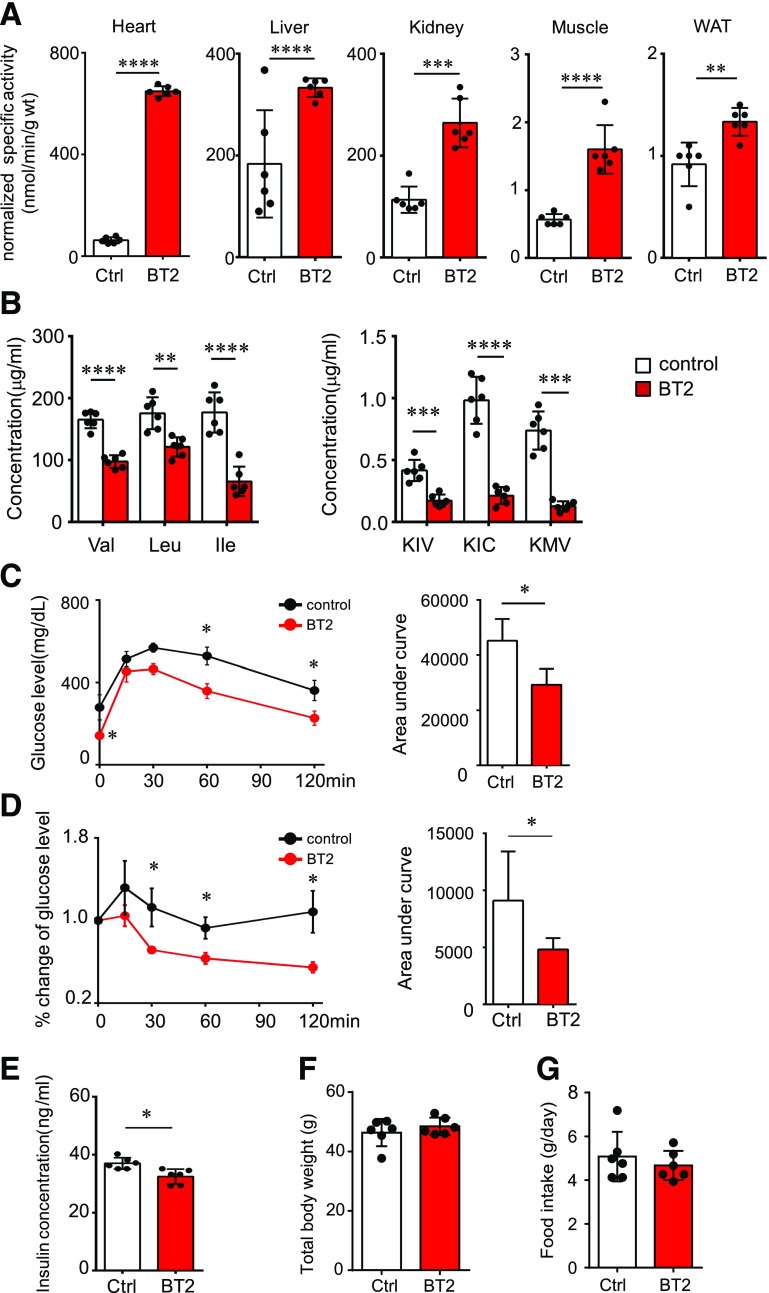
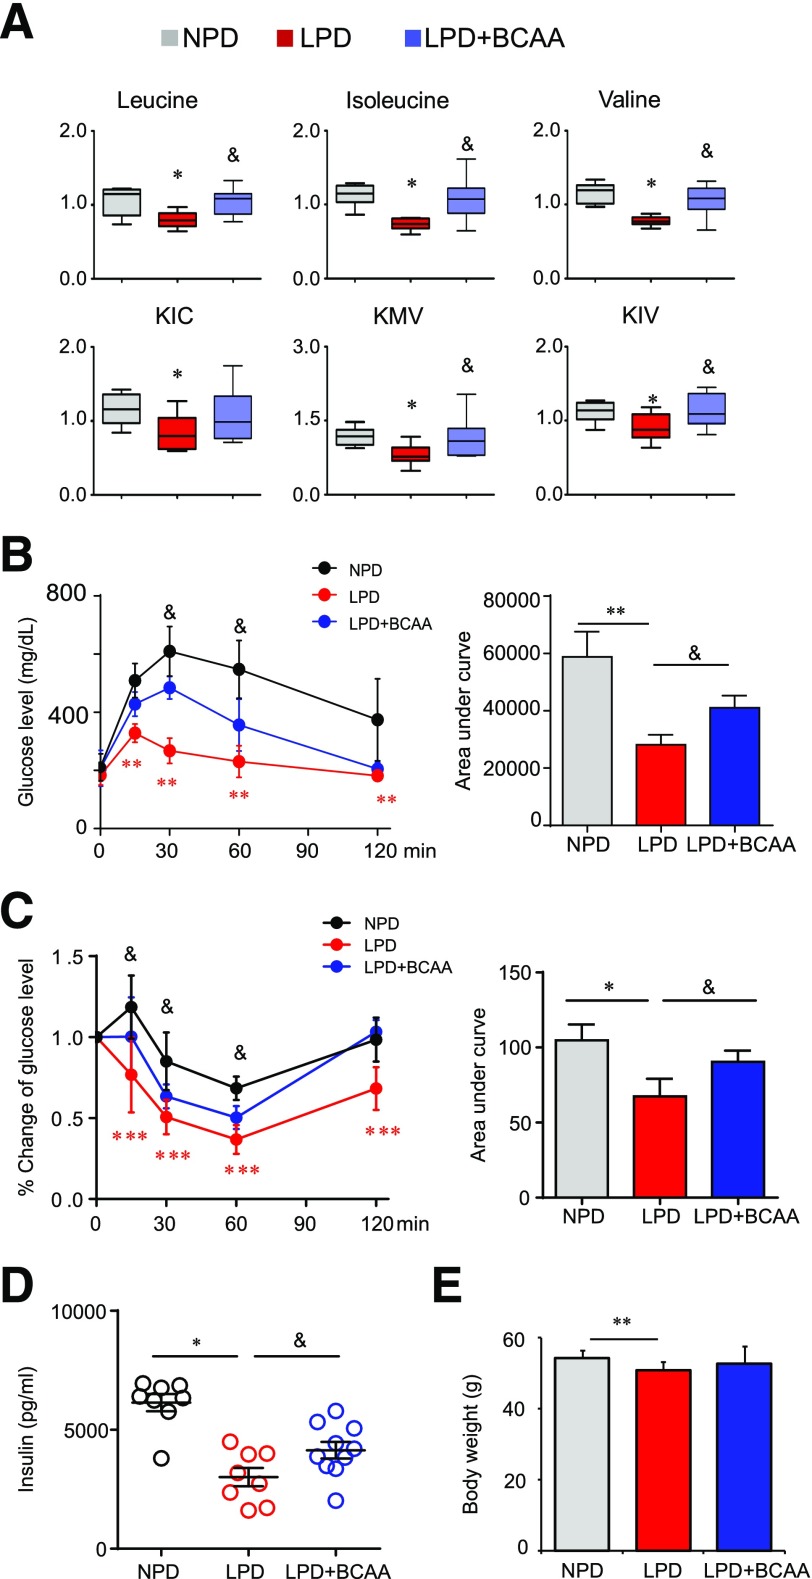
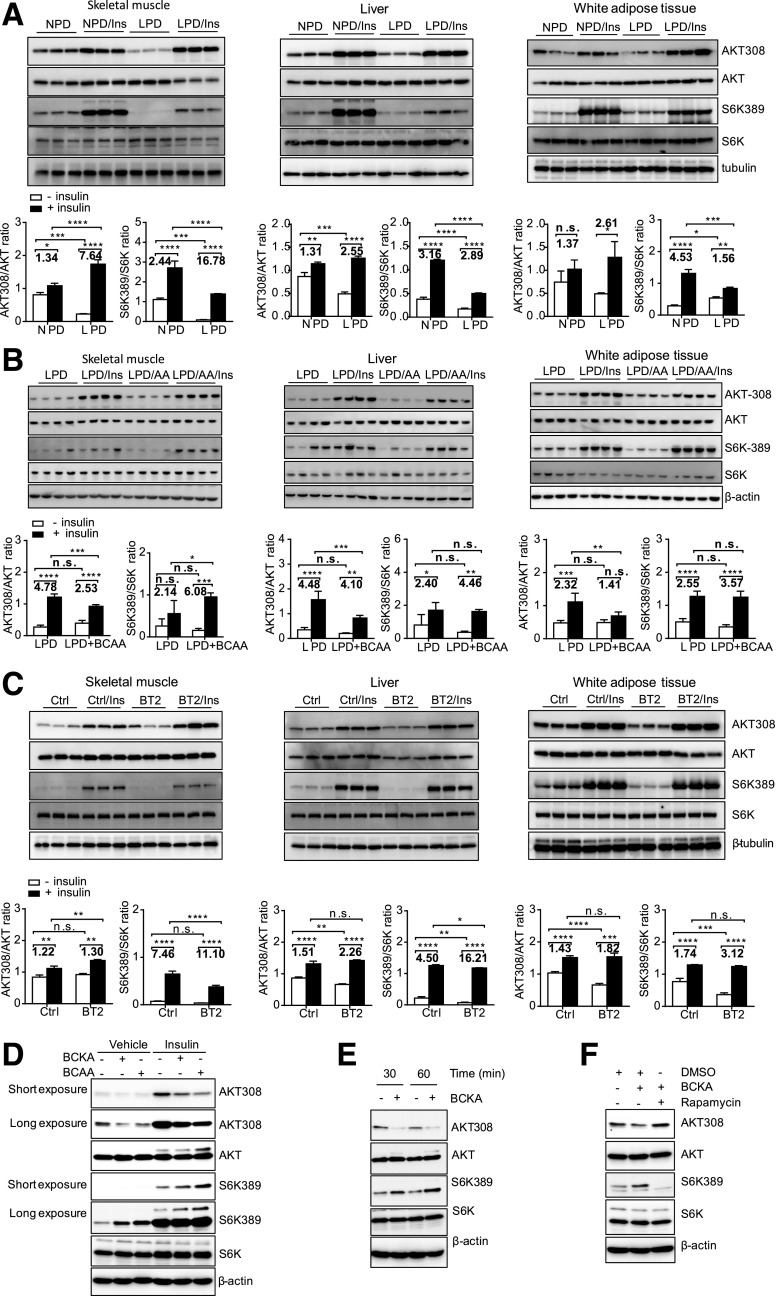
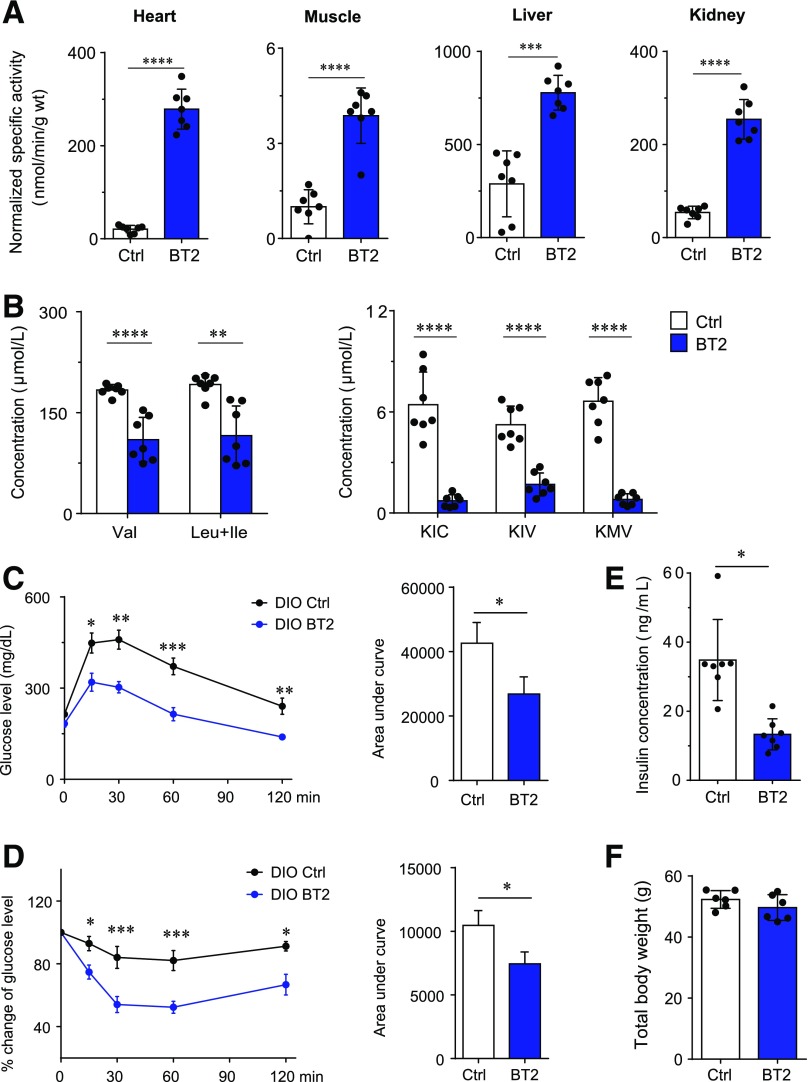
Recent studies implicate a strong association between elevated plasma branched-chain amino acids (BCAAs) and insulin resistance (IR). However, a causal relationship and whether interrupted BCAA homeostasis can serve as a therapeutic target for diabetes remain to be established experimentally. In this study, unbiased integrative pathway analyses identified a unique genetic link between obesity-associated IR and BCAA catabolic gene expression at the pathway level in human and mouse populations. In genetically obese (ob/ob) mice, rate-limiting branched-chain α-keto acid (BCKA) dehydrogenase deficiency (i.e., BCAA and BCKA accumulation), a metabolic feature, accompanied the systemic suppression of BCAA catabolic genes. Restoring BCAA catabolic flux with a pharmacological inhibitor of BCKA dehydrogenase kinase (BCKDK) ( a suppressor of BCKA dehydrogenase) reduced the abundance of BCAA and BCKA and markedly attenuated IR in ob/ob mice. Similar outcomes were achieved by reducing protein (and thus BCAA) intake, whereas increasing BCAA intake did the opposite; this corroborates the pathogenic roles of BCAAs and BCKAs in IR in ob/ob mice. Like BCAAs, BCKAs also suppressed insulin signaling via activation of mammalian target of rapamycin complex 1. Finally, the small-molecule BCKDK inhibitor significantly attenuated IR in high-fat diet-induced obese mice. Collectively, these data demonstrate a pivotal causal role of a BCAA catabolic defect and elevated abundance of BCAAs and BCKAs in obesity-associated IR and provide proof-of-concept evidence for the therapeutic validity of manipulating BCAA metabolism for treating diabetes.


Figures

Figure 1
Figure 1
Integrative genomic analyses associate the BCAA catabolic pathway with IR-related traits in human populations. A: The integrative genomics workflow we used to investigate the association of BCAAs with IR-related traits in humans. Specifically, human GWAS were integrated with eQTLs and coexpression networks matched by tissue, and then analyzed using the Mergeomics pipeline in order to identify coexpression modules that showed significant genetic association with IR-related clinical traits. Coexpression modules with significant over-representation of BCAA genes among the module genes were then annotated as BCAA modules. B: Number of BCAA modules with significant trait association (FDR <5% or P < 0.05, as assessed by using MSEA in the Mergeomics pipeline). Numbers in the bars indicate the fold enrichment of BCAA modules among all significant coexpression modules for the corresponding trait. Statistical significance of enrichment of BCAA modules among all significant modules was determined by using the Fisher exact test. Details of enrichment test are in Supplementary Table 2. C: Comparison of tissue origin distribution of BCAA modules and all coexpression modules significantly associated with fasting insulin and IR (BMI unadjusted) at FDR <5% and P < 0.05. Significance of differences in the mean correlation strength between gene categories was calculated by using the Student t test. *P < 0.05; **P < 0.01; ***P < 0.001; ****P < 0.0001.
Figure 2
Figure 2
The BCAA catabolic pathway shows a strong correlation with IR in a mouse population. A: Comparison of correlation strengths of the expression of BCAA pathway genes, non-BCAA amino acid pathway genes, and all genes with IR-related traits in mice. The correlation data between tissue-specific expression profiling and measurements of clinical traits were extracted from the HMDP, which contains ∼100 strains of genetically divergent mice fed an HFD. The mean and SE of the absolute values of Pearson correlations between each gene within a gene category (BCAA, non-BCAA, all genes) and a trait are shown. The significance of differences in the mean correlation strength between gene categories was calculated by using the Student t test. *P < 0.05; **P < 0.01; ***P < 0.001; ****P < 0.0001. B: Correlation of individual BCAA catabolic genes in different tissues for fasting glucose, fasting insulin, and HOMA-IR in HMDP mice fed an HFD. Red indicates a positive correlation, whereas blue indicates a negative correlation. *P < 0.05 and **P < 0.05 after Bonferroni correction for the number of genes and traits.
Figure 3
Figure 3
Systematic downregulation of the BCAA catabolic pathway leads to a BCAA catabolic defect in ob/ob mice. A: Quantitative PCR results of BCAA catabolic genes in white adipose tissue, skeletal muscle, and liver in lean wild-type (WT) mice (n = 4) and ob/ob mice (n = 4) deprived of food for 6 h. B: Illustration of the partial BCAA catabolic process with enzymes, intermediates, and derivatives. C: Relative levels of BCAAs and their metabolites in plasma and tissues of lean WT mice (n = 6–8) and ob/ob mice (n = 8). Male mice, age 14 weeks, were deprived of food for 6 h before being sacrificed. D: Serum concentrations of BCAAs and BCKAs in lean WT mice (n = 8) and ob/ob mice (n = 10). Male mice, age 8 weeks, were deprived of food from 8:00 a.m. to 5:00 p.m. and then supplied with chow diet for 1 hour. Blood (100 μL) was collected at 6:00 p.m. from the orbital sinus by using capillary tubes for serum collection. *P < 0.05 and **P < 0.01 vs. WT mice. ΚΙC, α-ketoisocaproic acid; KIV, α-ketoisovaleric acid; KMV, α-keto-β-methylvaleric acid.
Figure 4
Figure 4
The BCKDK inhibitor restores BCAA catabolism and attenuates IR in ob/ob mice. ob/ob mice were treated with the vehicle (Ctrl) or BT2 (at 10 weeks [A, B, and E] or 4–6 weeks [C and D]) by oral gavage (n = 6 mice in each group). We analyzed BCKD activity in various tissues (A), fasting plasma levels of BCAAs (B, left) and BCKAs (B, right), glucose tolerance test results (C), insulin tolerance test results (D), fasting plasma insulin level (E), body weight (F), and food intake (G). *P < 0.05; **P < 0.01; ***P < 0.005; ****P < 0.0001 vs. Ctrl. ΚΙC, α-ketoisocaproic acid; KIV, α-ketoisovaleric acid; KMV, α-keto-β-methylvaleric acid; WAT, white adipose tissue.
Figure 5
Figure 5
Altering BCAA intake affects IR in ob/ob mice. ob/ob mice were fed an NPD (20% protein by weight) or an LPD (6% protein by weight) for 4 weeks beginning at 10 weeks of age. For the BCAA group (LPD + BCAA), supplementation of BCAAs in drinking water (3 mg/mL) was started after mice had eaten the LPD for 2 weeks and lasted 2 weeks. We analyzed fasting plasma levels of BCAAs and metabolites (n = 8 mice; *P < 0.05 vs. NPD; &P < 0.05 vs. LPD) (A), glucose tolerance test results (n = 6–13 mice; **P < 0.01, LPD vs. NPD; &P < 0.05, LPD vs. LPD + BCAA) (B), insulin tolerance test results (n = 6 mice in each group; *P < 0.05, ***P < 0.001, LPD vs. NPD; &P < 0.05, LPD vs. LPD + BCAA) (C), fasting plasma insulin levels (n = 8–12 mice; *P < 0.05; &P < 0.05) (D), and body weight (n = 14 mice in each group; **P < 0.01).
Figure 6
Figure 6
BCAAs and BCKAs contribute to impaired insulin signaling in ob/ob mice. AC: Representative immunoblots for specific proteins, created by using tissue lysates from skeletal muscle, liver, and white adipose tissue of mice without or with insulin (Ins) injection for 10 min following 6 h of food deprivation. ob/ob mice were fed an NPD (20% protein by weight) or an LPD (6% protein by weight) for 4 weeks beginning at 10 weeks of age (A). BCAA supplementation (LPD + BCAA or LPD/amino acids) in drinking water (3 mg/mL) was started after mice had consumed the LPD for 2 weeks and lasted 2 weeks (B). ob/ob mice were treated with the vehicle (Ctrl) or BT2 by oral gavage for 5 weeks (C). The graphs below the immunoblots in A–C present densitometric values of the bands. DF: Representative immunoblots for specific proteins, created by using cell lysates. 3T3-L1 cells were treated with FBS- and BCAA-free DMEM for 1–2 h before BCAA (500 μmol/L), BCKA (500 μmol/L), or rapamycin (100 nmol/L) treatment for 1 h (D and F) or various times (E), followed by insulin treatment (10 nmol/L) for 1 h (D). *P < 0.05; **P < 0.01; ***P < 0.005; ****P < 0.0001.
Figure 7
Figure 7
The BCKDK inhibitor enhances BCAA catabolism and attenuates IR in DIO mice. DIO mice were treated with the vehicle (Ctrl) or BT2 by oral gavage for 8 weeks (n = 7 mice in each group). We analyzed BCKD activity in various tissues (A), fasting plasma levels of BCAAs (B, left) and BCKAs (B, right), glucose tolerance test results (C), insulin tolerance test results (D), fasting plasma insulin level (E), and body weight (F). *P < 0.05, **P < 0.01, ***P < 0.005, ****P < 0.0001, all vs. Ctrl. ΚΙC, α-ketoisocaproic acid; KIV, α-ketoisovaleric acid; KMV, α-keto-β-methylvaleric acid.

References

    1. Newgard CB, An J, Bain JR, et al. A branched-chain amino acid-related metabolic signature that differentiates obese and lean humans and contributes to insulin resistance. Cell Metab 2009;9:311–326 - PMC - PubMed
    1. Lynch CJ, Adams SH. Branched-chain amino acids in metabolic signalling and insulin resistance. Nat Rev Endocrinol 2014;10:723–736 - PMC - PubMed
    1. Felig P, Marliss E, Cahill GFJ Jr. Plasma amino acid levels and insulin secretion in obesity. N Engl J Med 1969;281:811–816 - PubMed
    1. Lu J, Xie G, Jia W, Jia W. Insulin resistance and the metabolism of branched-chain amino acids. Front Med 2013;7:53–59 - PubMed
    1. Lu Y, Wang Y, Ong C-N, et al. Metabolic signatures and risk of type 2 diabetes in a Chinese population: an untargeted metabolomics study using both LC-MS and GC-MS. Diabetologia 2016;59:2349–2359 - PubMed

Publication types

Substances