. 2019 Jun;570(7762):528-532.
doi: 10.1038/s41586-019-1276-2. Epub 2019 Jun 5.

Group 3 innate lymphoid cells mediate early protective immunity against tuberculosis

Affiliations

Group 3 innate lymphoid cells mediate early protective immunity against tuberculosis

Amanda Ardain et al. Nature. 2019 Jun.

Erratum in

  • Publisher Correction: Group 3 innate lymphoid cells mediate early protective immunity against tuberculosis.
    Ardain A, Domingo-Gonzalez R, Das S, Kazer SW, Howard NC, Singh A, Ahmed M, Nhamoyebonde S, Rangel-Moreno J, Ogongo P, Lu L, Ramsuran D, de la Luz Garcia-Hernandez M, Ulland TK, Darby M, Park E, Karim F, Melocchi L, Madansein R, Dullabh KJ, Dunlap M, Marin-Agudelo N, Ebihara T, Ndung'u T, Kaushal D, Pym AS, Kolls JK, Steyn A, Zúñiga J, Horsnell W, Yokoyama WM, Shalek AK, Kløverpris HN, Colonna M, Leslie A, Khader SA. Ardain A, et al. Nature. 2019 Aug;572(7768):E10. doi: 10.1038/s41586-019-1458-y. Nature. 2019. PMID: 31337923

Abstract

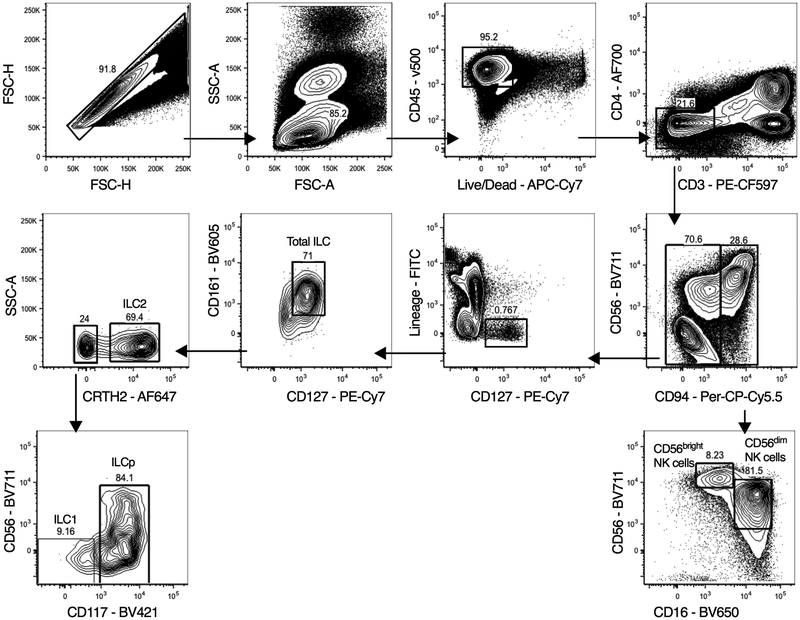
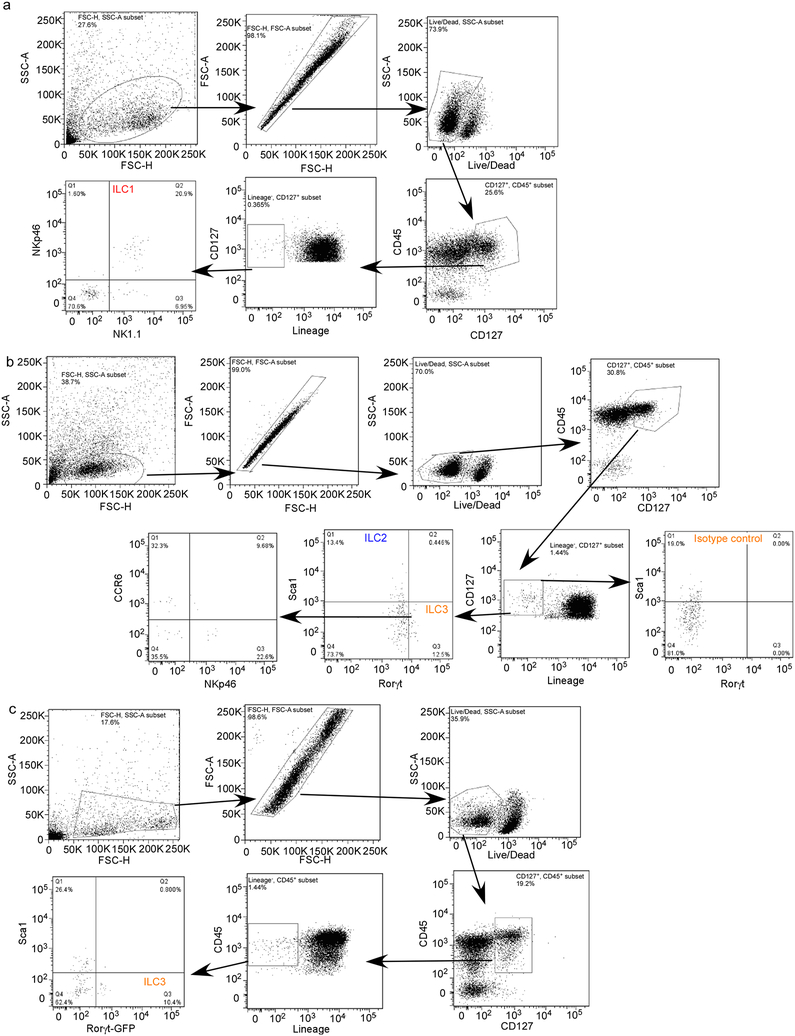
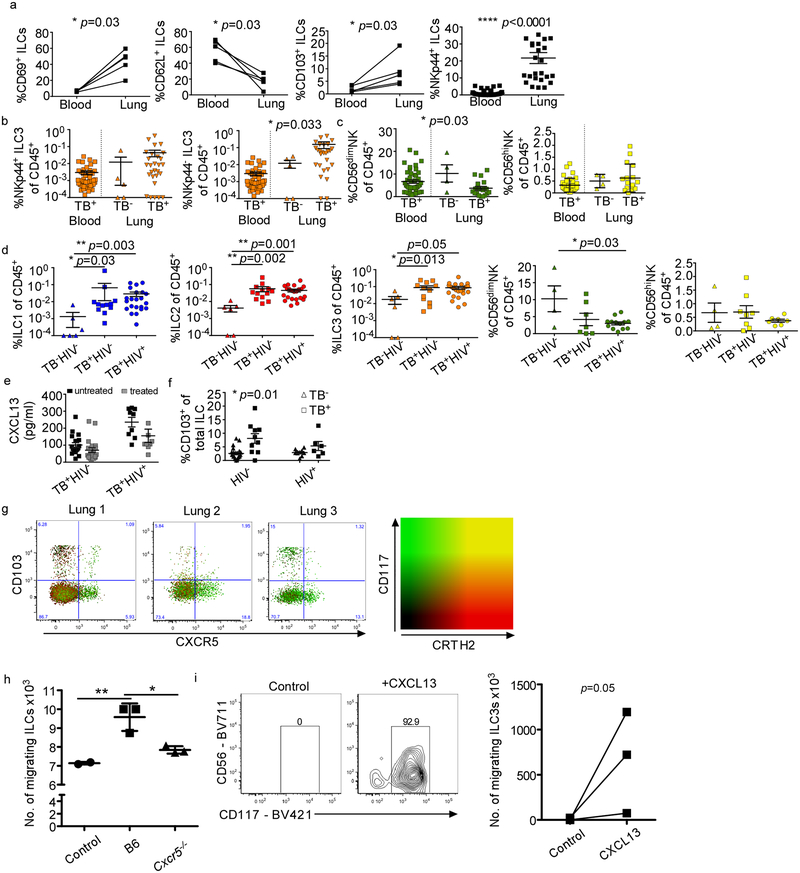
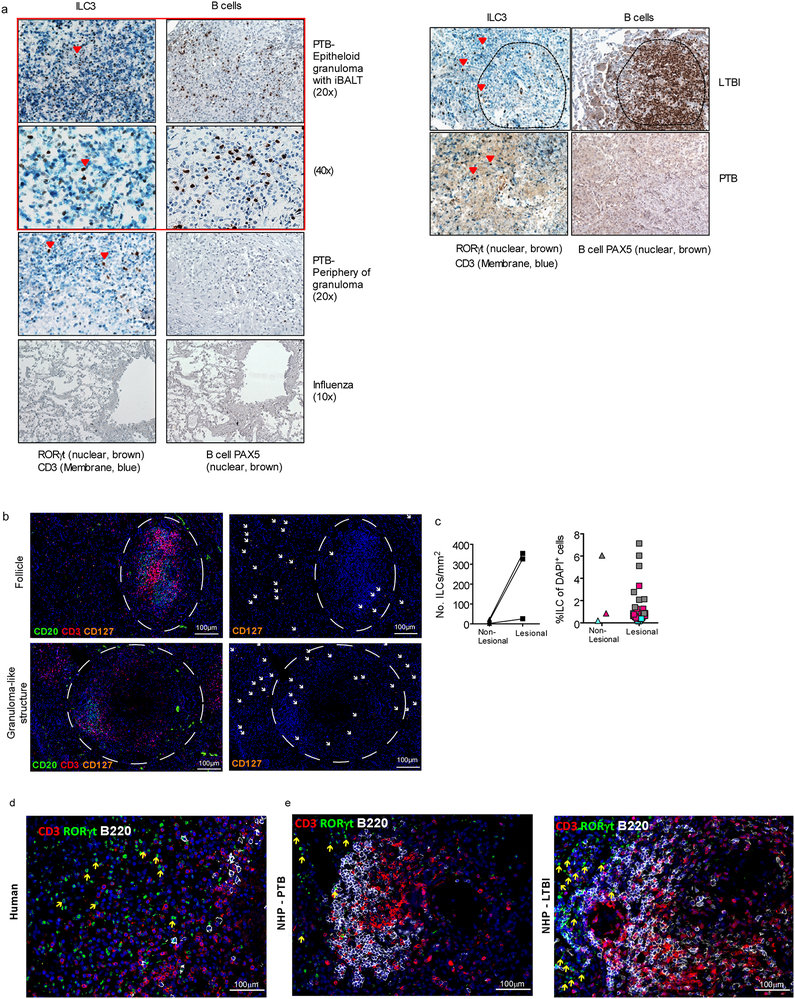
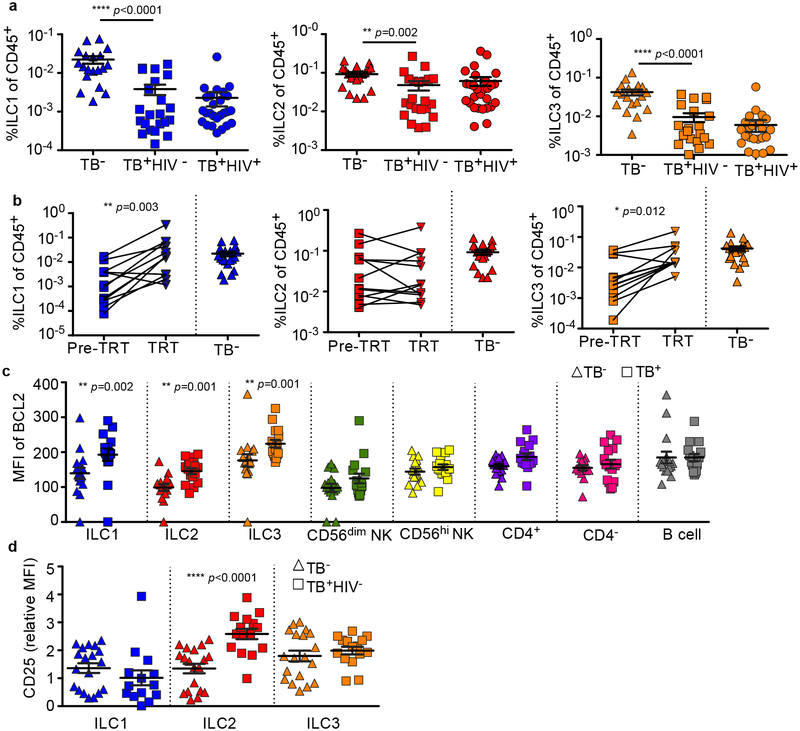
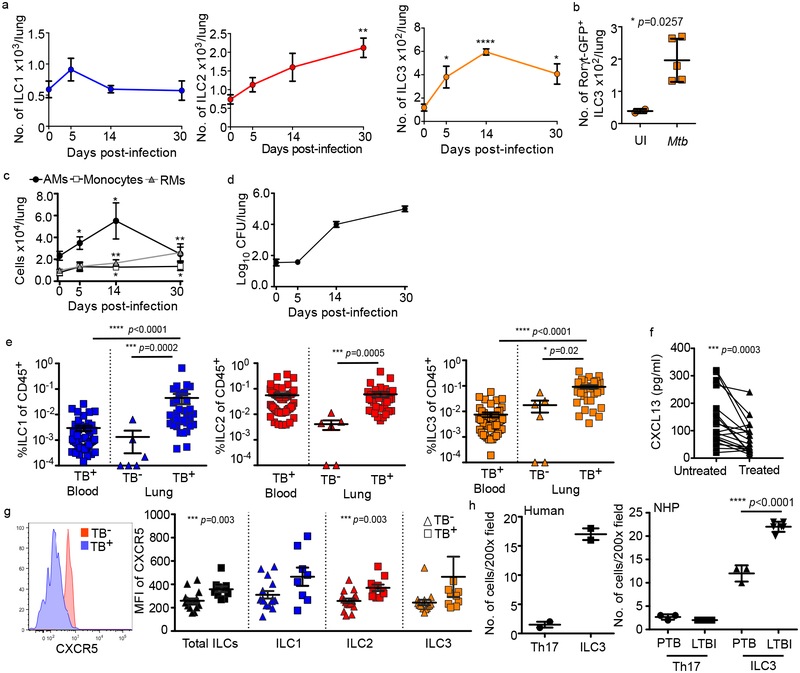
Tuberculosis is the leading cause of death by an infectious disease worldwide1. However, the involvement of innate lymphoid cells (ILCs) in immune responses to infection with Mycobacterium tuberculosis (Mtb) is unknown. Here we show that circulating subsets of ILCs are depleted from the blood of participants with pulmonary tuberculosis and restored upon treatment. Tuberculosis increased accumulation of ILC subsets in the human lung, coinciding with a robust transcriptional response to infection, including a role in orchestrating the recruitment of immune subsets. Using mouse models, we show that group 3 ILCs (ILC3s) accumulated rapidly in Mtb-infected lungs and coincided with the accumulation of alveolar macrophages. Notably, mice that lacked ILC3s exhibited a reduction in the accumulation of early alveolar macrophages and decreased Mtb control. We show that the C-X-C motif chemokine receptor 5 (CXCR5)-C-X-C motif chemokine ligand 13 (CXCL13) axis is involved in Mtb control, as infection upregulates CXCR5 on circulating ILC3s and increases plasma levels of its ligand, CXCL13, in humans. Moreover, interleukin-23-dependent expansion of ILC3s in mice and production of interleukin-17 and interleukin-22 were found to be critical inducers of lung CXCL13, early innate immunity and the formation of protective lymphoid follicles within granulomas. Thus, we demonstrate an early protective role for ILC3s in immunity to Mtb infection.


Conflict of interest statement

The authors declare no competing interests.

Figures

Extended Data Figure 1.
Extended Data Figure 1.. Hierarchical gating strategy used to identify lymphocyte populations in human blood and lung samples.
Single cells from blood or lung samples from human participants were processed for flow cytometry, and all doublets were excluded. Cells were gated as lymphocytes, live, CD45+ and CD3+ T cells or CD3 cells. CD3 cells were gated on CD56 and CD94. CD94+ cells are NK cells and were further sub-gated as CD16CD56hi NK cells or CD16+CD56dim NK cells. ILCs in the CD94 fraction were CD127+ and negative for all lineage markers CD4, CD11c, CD14, CD19, CD34, FcER1, BDCA2, TCRαβ and TCRγδ. Total ILCs were CD127+CD161+, ILC2 were LinCD127+CRTH2+ cells. ILC1 were LinCD127+CRTH2CD56CD117 cells. ILC3 were LinCD127+CRTH2CD117+ cells with variable CD56 expression.
Extended Data Figure 2.
Extended Data Figure 2.. ILC depletion seen in TB participants is not affected by TB drug resistance or concurrent HIV infection.
(a) The frequencies of the two main circulating NK populations, CD16+CD56dim and CD16CD56hi were measured in human participants with TB and healthy controls by flow cytometry. NK cell frequencies in paired samples taken from the same TB participant before and after 6 months of standard and successful TB therapy were also determined by flow cytometry. (b). Percentages of blood ILC1, ILC2, ILC3, CD56dim NK cells, and CD56hi NK cells in TBHIV control subjects, TB participants without (TB+HIV) and with HIV co-infection (TB+HIV+), and multi-drug resistant TB participants without (MDRTB+HIV) and with HIV co-infection (MDRTB+HIV+) were measured. Significance calculated by a Dunn’s multiple comparison test. Where p-value not shown, *p<0.05, **p<0.01. (c) Capase-3 expression in circulating lymphocytes from peripheral blood of TB participants and controls was done by flow cytometry. Significance calculated using a Mann-Whitney U test.
Extended Data Figure 3.
Extended Data Figure 3.. Hierarchical gating strategy used to identify ILC populations in mouse lung.
(a-c) B6 mice were aerosol infected with ~100 CFU Mtb and lungs were harvested at different dpi and flow cytometric analysis was carried out on single cell suspensions. Flow gating strategy for (a) ILC1 (CD45+CD127+LinNKp46+NK1.1+), (b) ILC2 (CD45+CD127+LinNK1.1Sca1+), and ILC3 (CD45+CD127+LinNK1.1Rorγt+) and NKp46-expressing (CD45+CD127+LinNK1.1Rorγt+NKp46+) ILC3 cells are shown. (c) Rorγt-GFP mice were aerosol infected with ~100 CFU Mtb and lungs were harvested at 14 dpi. ILC3 (CD45+CD127+LinNK1.1GFP+) populations were quantified using flow cytometry.
Extended Data Figure 4.
Extended Data Figure 4.. Pulmonary ILCs are tissue resident and express markers of migration.
(a) CD69, CD103, CD62L and NKp44 expression on the circulating ILCs in human peripheral blood and lung tissue were measured by flow cytometry. Significance by unpaired Mann-Whitney U test. Percentage of total human ILCs expressing these markers in paired samples of TB participants shown. Significance calculated using a one-way Wilcoxon-matched paired test. (b,c) NKp44, CD56 expression were measured in TB-infected lung tissues in comparison to control samples. Significance by unpaired Mann-Whitney U test (b) and a Kruskal-Wallis test with adjustments for multiple comparisons (c). (d) Percentages of ILC1, ILC2, ILC3, CD56dim NK cells, and CD56hi NK cells in human lung tissue were measured by flow cytometry TBHIV control subjects, TB participants without (TB+HIV) and with HIV co-infection (TB+HIV+). (e) CXCL13 protein levels were measured in the plasma from TB participants without (TB+HIV) and with HIV co-infection (TB+HIV+). Significance calculated by Mann-Whitney U test (no significance after Bonferonni correction). (f) Frequencies of CD103+ ILCs were measured by flow cytometry in the blood from TBHIV control subjects, TB participants without (TB+HIV) and with HIV co-infection (TB+HIV+). Significance by Mann-Whitney U test with Bonferroni corrections (only significant values after correction shown). (g) Representative FACS plots showing two distinct subpopulations of CD103 and CXCR5-expressing ILCs measured in lung tissues from three TB+ subjects, where most CXCR5-expressing cells are CD117+ ILC3s, and CD103+ lung ILCs are a combination of CD117+ ILC3s, CRTH2+ ILCs and CD117CRTH2 cells. Green = CD117+; Red = CRTH2+. (h) B6 mice were aerosol infected with ~100 CFU Mtb and lungs were harvested at 14 dpi. Lung ILCs were sorted from single cell suspensions (ILCs: CD45+CD127+LinNK1.1). The ability of sorted ILCs to migrate towards media alone or mouse CXCL13 gradient was quantitated in transwell migration assay. n=3–5 biological replicates. Significance by one way ANOVA, *p<0.05, **p<0.01. (i) Human ILC3s sorted from lungs migrated in response to recombinant human CXCL13 in transwell migration assays. Significance by one tailed t-test.
Extended Data Figure 5.
IHC staining for nuclear RORγt, CD3, and PAX5 on paraffin-embedded formalin fixed lung tissues from (a, left) PTB or influenza-infected human participants, (a, right) or macaque with LTBI and PTB. (b) Representative fluorescent immunohistology scans of TB-infected human and non-human primate lung tissues, with CD20 (FITC), CD3 (PE-Texas Red) and CD127 (PE-Cy5). CD3CD127+ ILCs are present adjacent to follicles (upper panels) and granuloma-like structures (lower panels). (c) Total numbers of ILCs/mm2 of tissue are increased in structures of TB histopathlogy (combined lesional tissue) in comparison to remainder of unaffected tissue (Non-Lesional). But percentages of ILCs per total cell number (DAPI+ cells) are not different between regions of interest (Lesional tissue) and unaffected tissue (Non-Lesional). ILC3 immunofluorescence for nuclear RORγt, B220 and CD3 on FFPE lung tissues from (d) human and (e) macaque with PTB and LTBI.
Extended Data Figure 6.
Extended Data Figure 6.. Sort purity of human ILC3 and CD4+ T cells.
ILC3s and CD4+ T cells were sorted from human PBMCs and reflowed back into FACSARIA fusion to confirm purity. Purity of ILC3s confirmed as 100% and CD4+ T cells sort was 97% pure.
Extended Data Figure 7.
Extended Data Figure 7.. VIP and OSM are expressed within human TB infected lung tissue.
(a) VIP and (b) OSM protein expression was confirmed in situ in TB-infected human lung tissues using multiplexed fluorescent immunohistology. (c) The network of upstream drivers enriched in the differentially expressed genes in sorted ILC3s between TB infected and uninfected samples are shown. Inset: GO Network generated over the genes identified as downstream of OSM by IPA (n=64, see Methods). Each node represents a specific GO/KEGG/Reactome term (Supplementary Table 4). Broad categories of pathways are annotated. Line width/darkness corresponds to number of shared genes between nodes. Node size: ** p<0.01, *** p<0.001. (d) Select predicted downstream pathways enriched in the differentially expressed genes in ILC3s between TB infected and uninfected samples are shown.
Extended Data Figure 8.
Extended Data Figure 8.. Sorting purity of mouse ILCs.
(a) B6 mice were aerosol infected with ~100 CFU Mtb and lungs were harvested at 5 dpi. Lung CD45 population was enriched by using CD45 Microbeads. CD45 enriched cells were stained and lung ILCs (CD45+CD127+LinNK1.1) were purified by using FACSJazz. Sort purity is shown here. (b) mRNA expression of Ccr6, Rorγt and Ahr relative to GAPDH on the purified ILCs (CD45+CD127+LinNK1.1) and non ILC population (CD45+CD127LinNK1.1) were quantitated by RT-PCR. Significance by two way ANOVA, ****p<0.0001.
Extended Data Figure 9.
Extended Data Figure 9.. ILC1 and ILC2 are dispensable, while ILC3 is required for early protection against TB.
B6 (n=5–10), Ifnγ−/−(n=3–7), Il13−/− (n=5–15) and Rorγt−/− (n=4–5) mice were aerosol infected with ~100 CFU Mtb and at 14 dpi, (a, c) bacterial burden was measured in the lungs by plating (n=5–9/B6). (b, d) Numbers of lung ILC1s, ILC2s and ILC3s were quantified by using flow cytometry. Significance by one way ANOVA (a, b) or Student’s t-test (c,d). (e) Cbfbf/fNKp46Cre and Cbfbf/f mice were aerosol infected with ~100 CFU Mtb and at 14 and 30 dpi (e) bacterial burden was determined in the lungs by plating (n=5–11/Cbfbf/f, n=3–11/Cbfbf/f Nkp46cre), (f) Numbers of lung ILC1s, ILC2s, ILC3s and AMs were determined by using flow cytometry, (g) FFPE lung sections from 30 dpi Mtb-infected mice were stained with antibodies to B220 and CD3, and the average size of B cell follicles were quantified. (h) Uninfected Cbfbf/fNKp46Cre and Cbfbf/f mice were harvested, and lung and lymph nodes were analysed for the different myeloid (AMs, myeloid Dendritic Cells (mDCs), neutrophils, monocytes and recruited macrophages) and (i) T cell (CD3+CD4+, CD3+CD8+, CD3+TCRα+, CD3+γδ+) populations by flow cytometry. Significance by Student’s t-test.
Extended Data Figure 10.
Extended Data Figure 10.. IL-17 and IL-22 are produced by lung ILCs following Mtb infection and mediate protection through the CXCR5 axis.
B6 mice were aerosol infected with ~100 CFU Mtb and treated with isotype (n=5) or anti-NK1.1 (n=5, PK126, 100 μg) every 3 days. (a) Lung NK cells were determined following treatment with isotype or anti-NK1.1 at 30 dpi by flow cytometry. (b) Lung bacterial burden was assessed at 30 dpi. All data shown as mean ± SD. Significance calculated by Student’s t-test (a-b). (c-d) Uninfected Ahrf/f and Ahrf/f Rorγtcre mice were harvested, and lung and lymph nodes were analyzed for the different myeloid (c, AMs, mDCs, neutrophils, monocytes and recruited macrophages) and (d) T cell (CD3+CD4+, CD3+CD8+, CD3+TCRα+, CD3+γδ+) populations by flow cytometry (n=9). (e) Lung cells from B6 mice were infected in vitro with MOI 0.1 Mtb and IL-23 (n=3/UI, n=4/Mtb) protein levels were measured in supernatants on 5 dpi and compared to uninfected (UI) cells (f, left). Lung cells from B6 mice were infected in vitro with MOI 0.1 Mtb as before and stimulated with recombinant (r) IL-23, rIL-1β and the protein levels of IL-22 and IL-17 were measured in supernatants and compared with levels in uninfected (UI) cells and (f, right) the numbers of IL-17 and IL-22 producing ILCs were measured by flow cytometry. (g) B6 and Cxcr5−/− mice were aerosol infected with ~100 CFU Mtb and at 30 dpi bacterial burden was determined in the lungs by plating (n=5). (h) ILC3 quantification in FFPE lung sections was carried out by staining with CD3, B220 and Rorγt and the number of Rorγt+CD3 ILC3 were counted and shown. (i) FFPE lung sections from 30 dpi Mtb infected mice were stained with antibodies to B220 and CD3, and the average size of B cell follicles were quantified. All data shown as mean ± SD. Significance by Student’s t-test (c-i).
Figure 1.
Figure 1.. Circulating ILCs are depleted and activated in response to TB.
(a) Circulating ILC subsets were enumerated in blood of HIV+ and HIV TB participants, and healthy controls by flow cytometry. Significance by Kruskal-Wallis test with corrections for multiple comparisons. (b) Paired ILC subsets in the blood before and after standard TB treatment were compared to frequencies in healthy controls (p-value by Wilcoxon matched-pairs test). Pre-TRT = untreated; TRT = after treatment. (c) The median fluorescent intensity (MFI) of the anti-apoptotic marker BCL2 was measured in TB+ and control participants on all ILC subsets, and in CD56hi NK cells, but not CD56dim NKs, CD4+, CD4CD3+ T cells and CD19-expressing B cells. Significance by unpaired Mann-Whitney U test with Bonferroni corrections. (d) Expression of activation and pro-survival marker CD25 was determined using flow cytometry in ILC subsets in blood from HIV+ and HIV TB participants. Significance by Kruskal-Wallis test with corrections for multiple comparisons.
Figure 2.
Figure 2.. ILCs rapidly accumulate within lung tissues and are associated with lymphoid follicle containing granulomas.
(a-c) C57BL/6 (B6, n=5) mice or Rorγt-GFP (n=3–5) mice were aerosol infected with ~100 CFU Mtb. (a) Numbers of ILC1s, ILC2s, ILC3s in B6 mice and (b) number of ILC3s in Rorγt-GFP mice were quantified by flow cytometric analyses. (c) Numbers of AMs, monocytes, and recruited macrophages (RMs) were measured and quantified by flow cytometric analyses in B6 mice (n=5). (d) Bacterial burden was measured in the lungs of B6 mice by plating (n=5). Data shown as mean ± SEM (a) or mean ± SD (b-d). Where p-value not shown, *p<0.05, **p<0.01, ****p<0.0001. Significance by Student’s t-test (a-c). (e) Human ILC subsets were measured in TB infected lung tissue (TB+) compared to TB control lung tissue, and in the circulation using flow cytometry. Significance by Kruskal-Wallis test with adjustments for multiple comparisons was carried out. (f) CXCL13 protein levels were measured in plasma from drug-susceptible TB subjects, and after 6 months of standard TB treatment (two-tailed Wilcoxon matched-pairs test). (g) CXCR5 expression was measured on circulating ILC subsets using flow cytometry. Significance by Mann-Whitney U test with correction for multiple comparisons; only significant p-values after correction shown. (h) ILC3 quantification in the FFPE lung sections from human, non-human primates (LTBI and PTB) was carried out by staining with CD3, B220 and RORγt and the number of RORγt+CD3 (ILC3) and RORγt+CD3+ (Th17) cells were counted and shown. Data shown as mean ± SD. Significance by Student’s t-test (h).
Figure 3.
Figure 3.. ILCs demonstrate a structured response to PTB at the transcriptomic level.
(a) Lung ILC2s and ILC3s were sorted and differential gene expression between TB infected (n=5) and uninfected control tissue (n=2) were determined by RNA sequencing. (b) Expression of key chemokines and chemoattractant proteins significantly upregulated in pulmonary ILCs from TB participants (Pos, n=5) when compared to uninfected control lungs is shown (Neg, n=2). p-values corrected using Benjamini-Hochberg with a significance cut-off of FDR < 0.01. (c) Upstream drivers of differentially expressed genes in ILC2s and ILC3s were predicted using Ingenuity Pathway Analysis (IPA). p-values calculated by hypergeometric test between genes in our data and known interactions in the literature for each driver.
Figure 4.
Figure 4.. ILCs mediate iBALT formation and contribute to early protection from Mtb.
Rag1−/−, Rag2γc−/− and wild type mice were aerosol infected with ~100 CFU Mtb. ILCs (CD45+CD127+LinNK1.1) were isolated from Mtb infected wild type mice and ~5X10³ cells were intratracheally transferred into Rag2γc−/− mice 1 day before infection. (a) Lung bacterial burden at 14 dpi was determined by plating (n=5/group). (b) Number of ILC1s, ILC2s, total ILC3s and NKp46+ ILC3s and (c) AMs were measured by flow cytometry. (d) ILC3 quantification in histological lung sections was carried out by staining with CD3, B220 and Rorγt and the number of Rorγt+CD3 ILC3s were counted and shown. (e) Ahrf/f, Ahrf/fRorγtCre mice were aerosol infected with ~100 CFU Mtb and lung bacterial burden at 14 and 30 dpi was determined by plating (n=7–10/group). (f) Number of ILC1s, ILC2s, total ILC3s, NKp46+ ILC3s and AMs were enumerated by flow cytometry. (g) B6 and Il17/Il22−/− were aerosol infected with ~100 CFU Mtb and lung bacterial CFU were measured by plating (n=12/group). (h) Number of ILC1, ILC2, ILC3, CXCR5+ ILC3, and CXCR5+NKp46+ ILC3 were measured by flow cytometry (n=5/B6, n=8/Il17/Il22−/−). (i) FFPE lung sections were subjected to ISH with the mouse-Cxcl13 probe and the ratio of Cxcl13 mRNA+ area occupied per lung was quantified. (j) B6 mice received IL-23 blocking antibody (i.p.) 1 day prior to infection with ~100 CFU Mtb and the lung bacterial burden and (k) number of AMs, ILC2s and ILC3s were quanified at 14 dpi using plating and flow cytometry respectively (n=5/isotype, n=5–6/anti-IL-23), Iso = Isotype. (l) FFPE lung sections from 30 dpi Mtb infected mice were stained with antibodies to B220 and CD3, and the average size of B cell follicles were quantified in Ahrf/f, Ahrf/fRorγtCre, B6, Il17/Il22−/−, isotype-treated B6 and anti-IL-23-treated B6 Mtb-infected mice. All data shown as mean ± SD. Significance by either one way ANOVA (a-d) or Student’s t-test (e-l).

Comment in

References

    1. World Health Organization. Global Tuberculosis Report 2018. Geneva, S. W.
    1. Klose CS & Artis D Innate lymphoid cells as regulators of immunity, inflammation and tissue homeostasis. Nat Immunol 17, 765–774, doi:10.1038/ni.3489 (2016). - DOI - PubMed
    1. Diefenbach A, Colonna M & Koyasu S Development, differentiation, and diversity of innate lymphoid cells. Immunity 41, 354–365, doi:10.1016/j.immuni.2014.09.005 (2014). - DOI - PMC - PubMed
    1. Takatori H et al. Lymphoid tissue inducer-like cells are an innate source of IL-17 and IL-22. J Exp Med 206, 35–41, doi:10.1084/jem.20072713 (2009). - DOI - PMC - PubMed
    1. Jones GW & Jones SA Ectopic lymphoid follicles: inducible centres for generating antigen-specific immune responses within tissues. Immunology 147, 141–151, doi:10.1111/imm.12554 (2016). - DOI - PMC - PubMed

Publication types

MeSH terms