. 2019 Jun;570(7760):182-188.
doi: 10.1038/s41586-019-1279-z. Epub 2019 Jun 5.

The population history of northeastern Siberia since the Pleistocene

Affiliations

The population history of northeastern Siberia since the Pleistocene

Martin Sikora et al. Nature. 2019 Jun.

Abstract

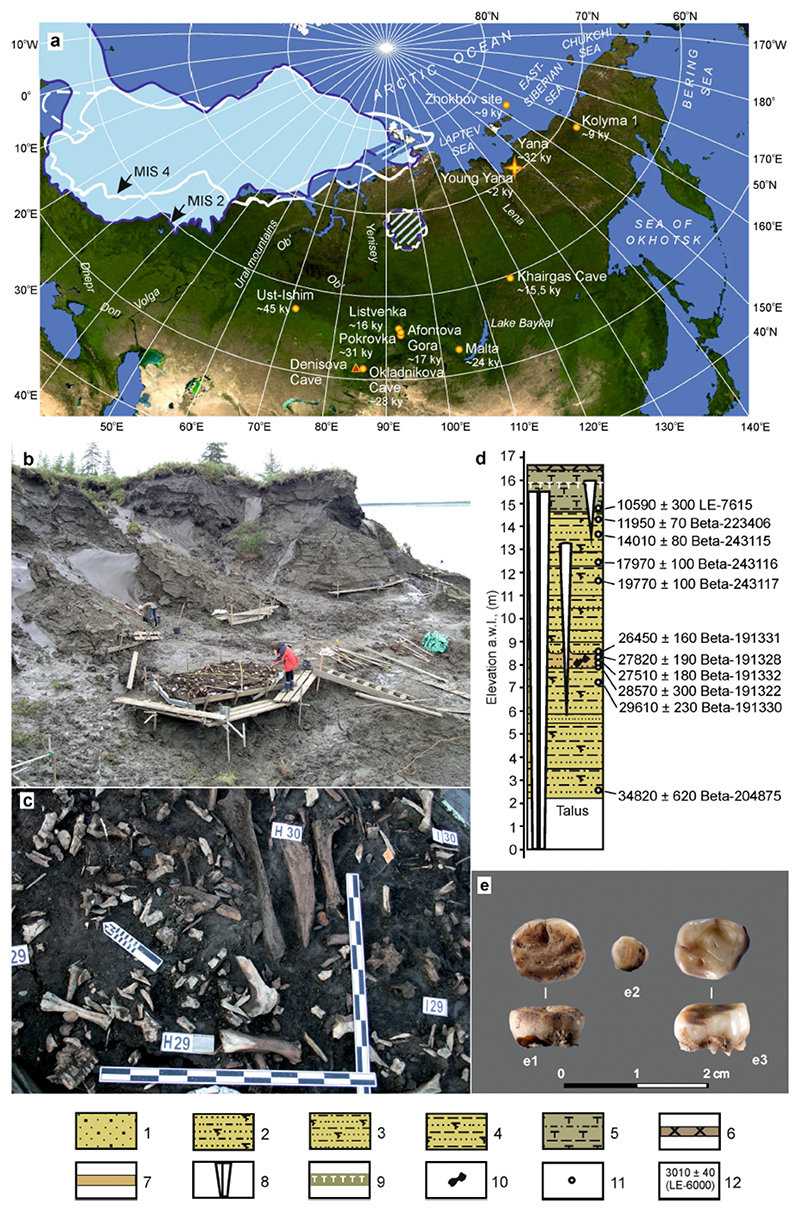
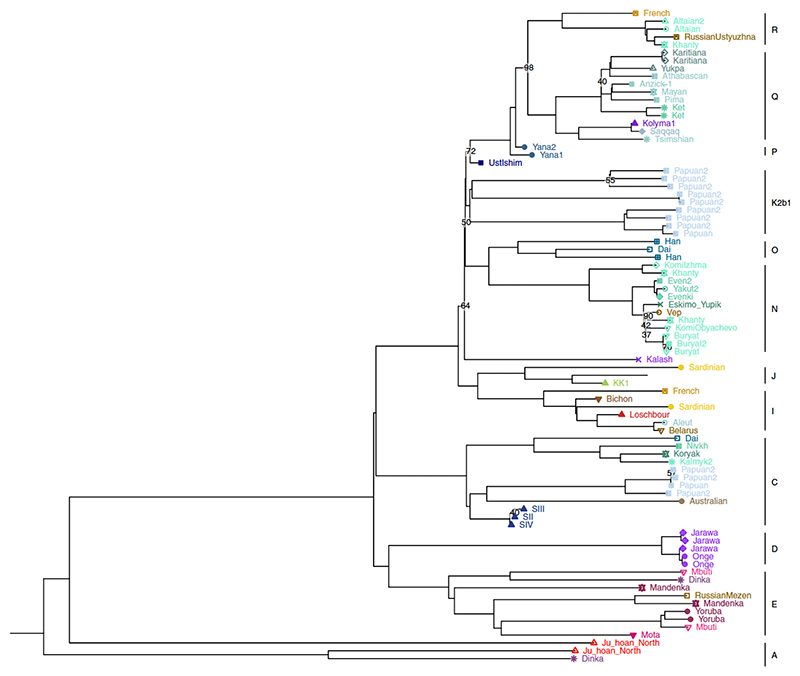
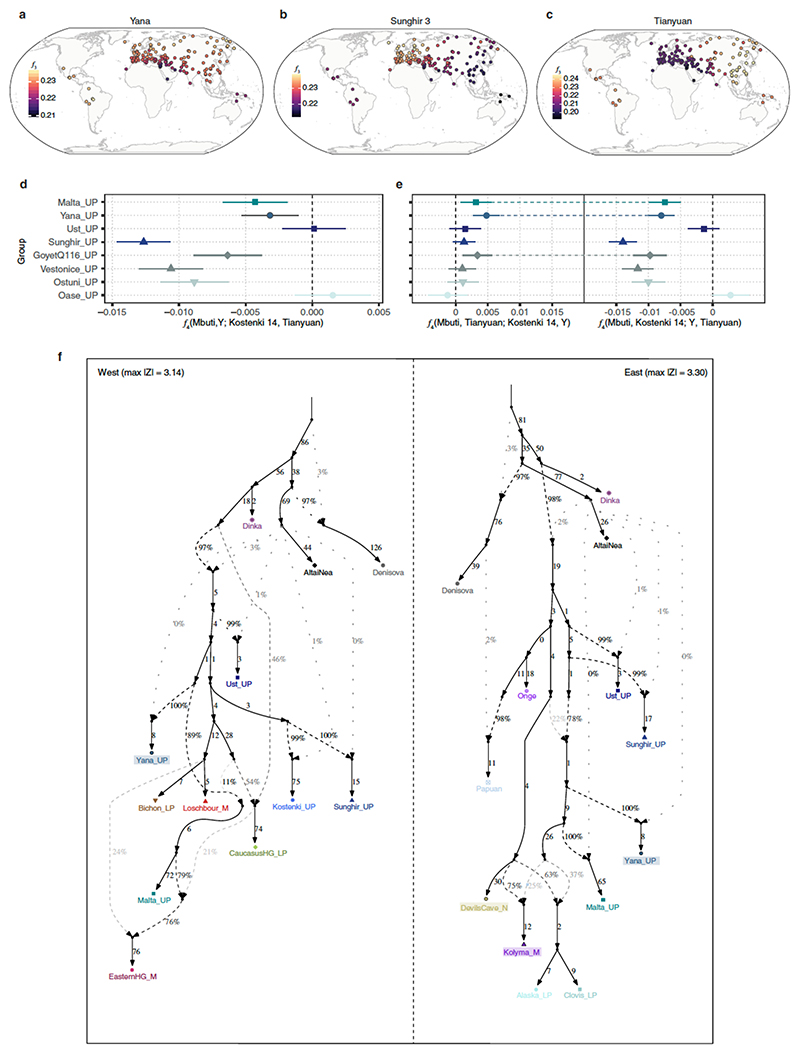
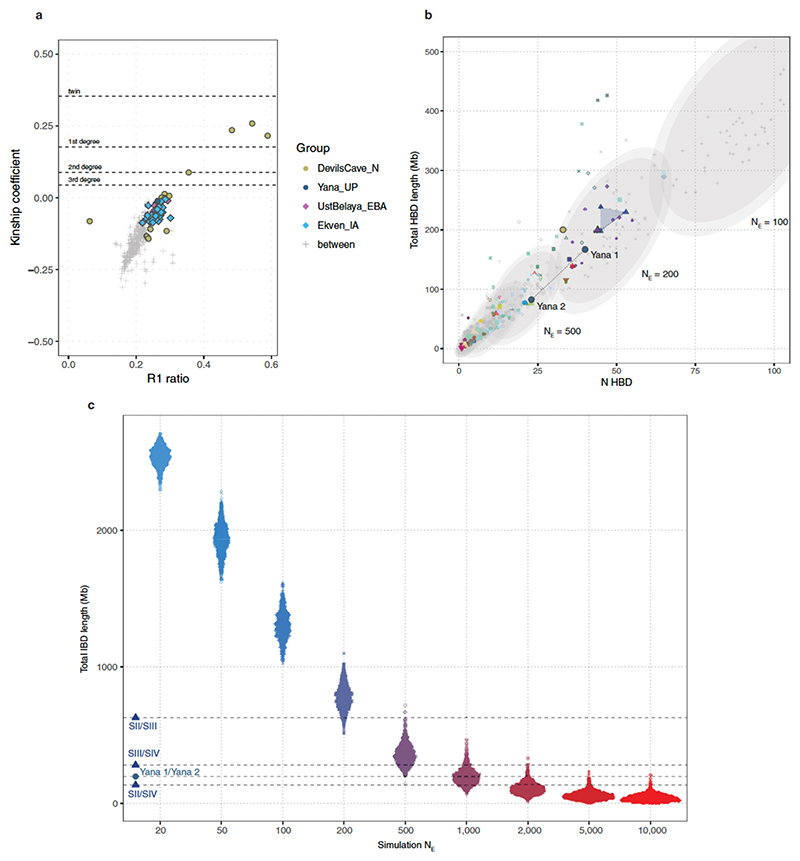
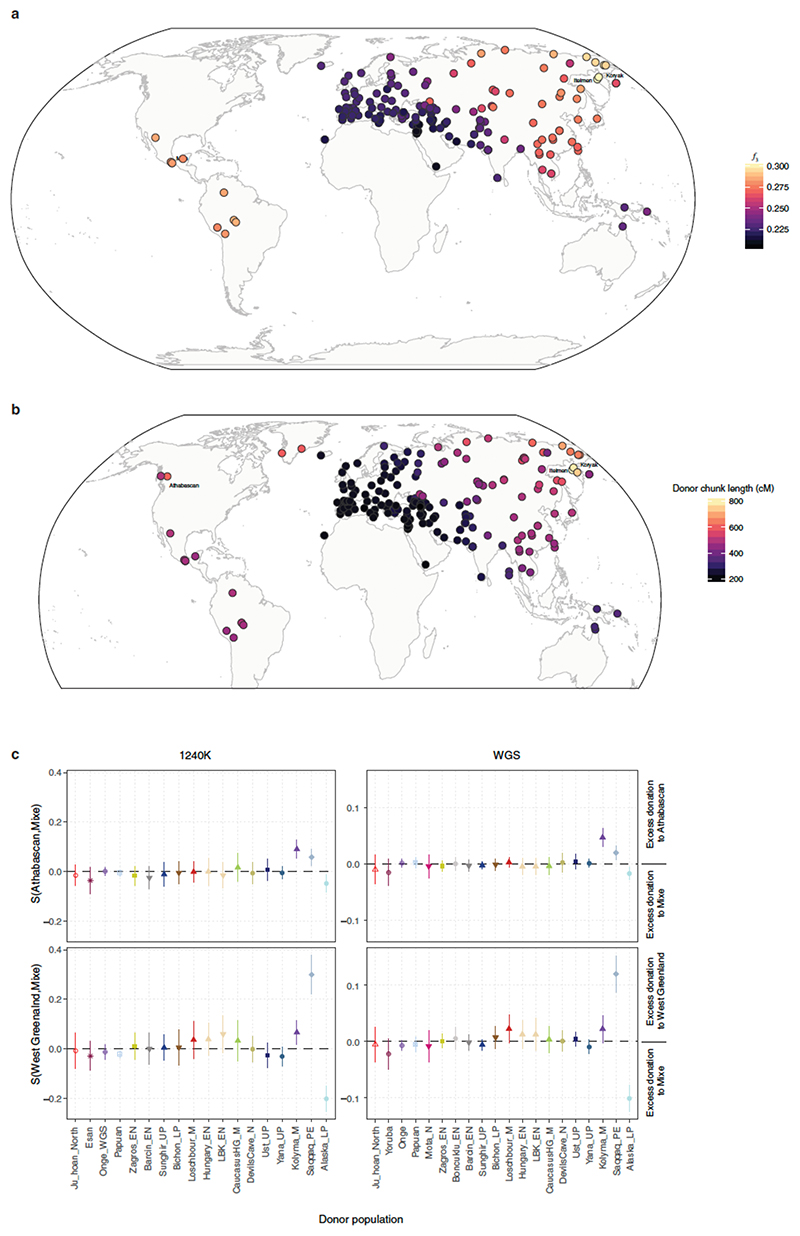
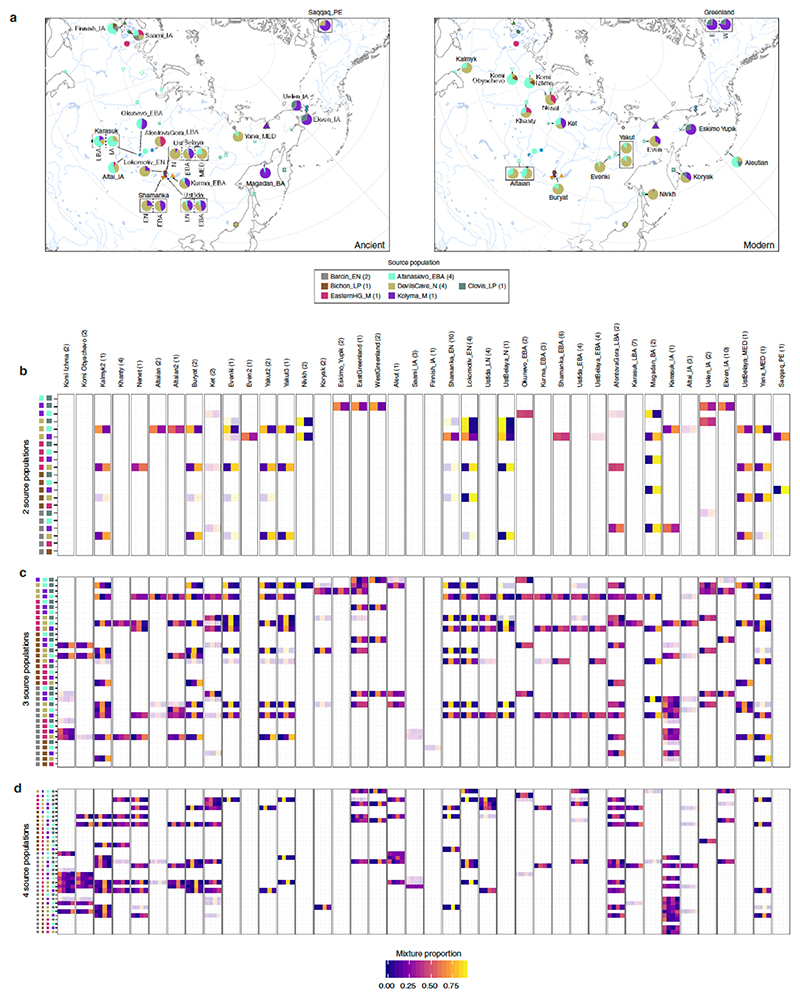
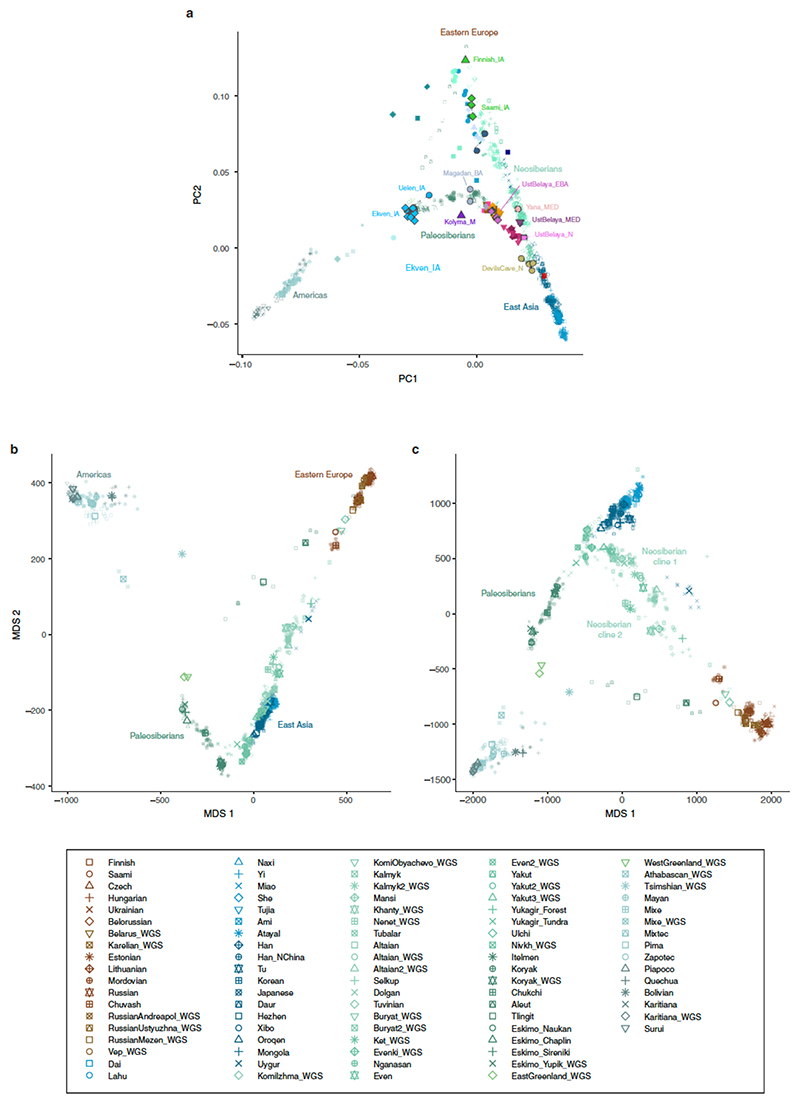
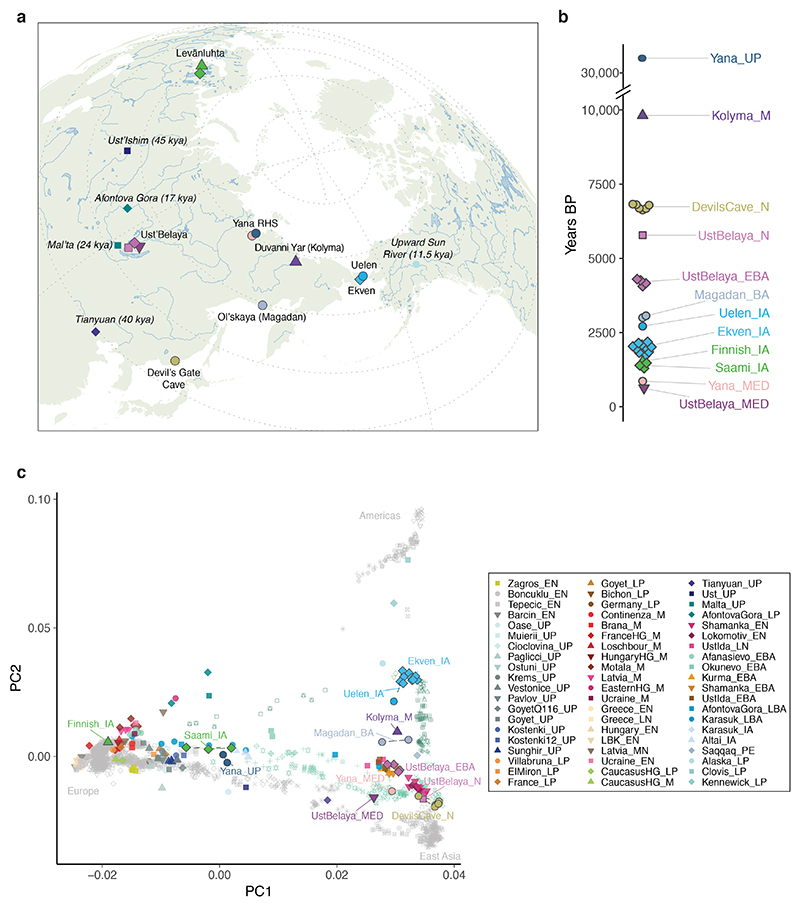
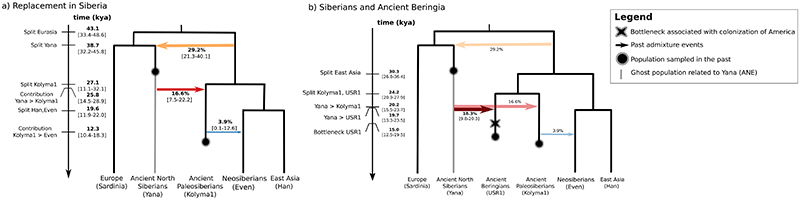
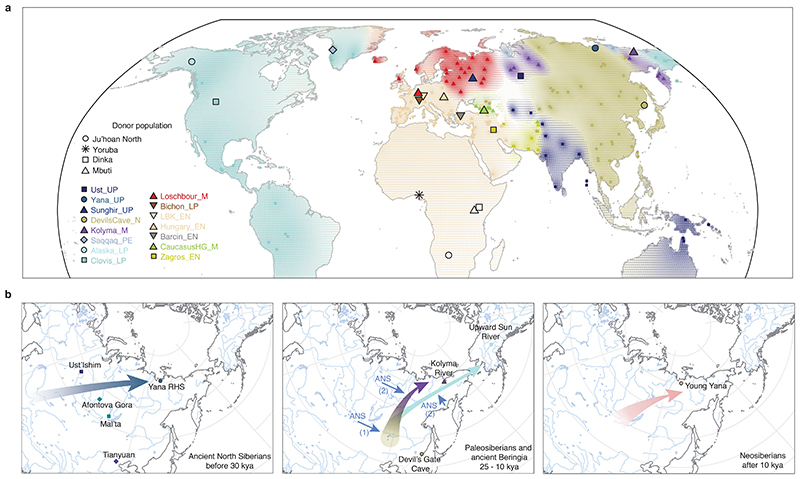
Northeastern Siberia has been inhabited by humans for more than 40,000 years but its deep population history remains poorly understood. Here we investigate the late Pleistocene population history of northeastern Siberia through analyses of 34 newly recovered ancient genomes that date to between 31,000 and 600 years ago. We document complex population dynamics during this period, including at least three major migration events: an initial peopling by a previously unknown Palaeolithic population of 'Ancient North Siberians' who are distantly related to early West Eurasian hunter-gatherers; the arrival of East Asian-related peoples, which gave rise to 'Ancient Palaeo-Siberians' who are closely related to contemporary communities from far-northeastern Siberia (such as the Koryaks), as well as Native Americans; and a Holocene migration of other East Asian-related peoples, who we name 'Neo-Siberians', and from whom many contemporary Siberians are descended. Each of these population expansions largely replaced the earlier inhabitants, and ultimately generated the mosaic genetic make-up of contemporary peoples who inhabit a vast area across northern Eurasia and the Americas.


Conflict of interest statement

Author information

Reprints and permissions information is available at www.nature.com/reprints. The authors declare no competing financial interests.

Figures

Extended Data Figure 1
Extended Data Figure 1. Geographical, chronological and archaeological context for the earliest human remains discovered in Northern Siberia.
a, map of known 14C dated anatomically modern human fossils of late Pleistocene and early Holocene age (yellow dots) found in Siberia (Akimova et al. 2010; Alexeev 1998; Chikisheva et al. 2016; Fu et al. 2014; Khaldeyeva et al. 2016; Pitulko et al. 2015; Zubova and Chikisheva 2015) and Yana RHS finds (yellow star), Denisova Cave that yielded Neanderthal/Denisovan remains, red triangle (Chikisheva, Shunkov 2017; Reich et al. 2010) and the reconstructed maximum ice sheet extent at about 60,000 years ago (white line) and during the Last Glacial Maximum (LGM) around 20,000 years ago (ice-blue filling) (Hubberten et a. 2004; Svendsen et al. 2004); potentially glaciated areas are cross-hatched; b, general view of the Northern Point excavation area at the Yana site (Pitulko et al. 2004); c, cultural layer in H29 unit where the human tooth was found; d, cryolithological profile for Northern Point of Yana RSH (Pitulko et al. 2013); e, human teeth found during the excavations in unit 2V26, occlusal and lateral view (e1), unit X26 (e2), occlusal view, and H29 (e3), occlusal and lateral view, samples e2 (Yana 2 genome) and e3 (Yana 1 with high coverage (25.6X) genome sequence) are being used in this study. Legend for (c): 1 − sand with small pebbles; 2 − sandy silt; 3 − claey-sand silt; 4 − sandy-clayey silt; 5 − interbedding of clayey silt bands and sandy-clayey silt with beds and lenses of peat; 6 − soil-vegetable layer; 7 − culture layer; 8 − polygonal ice wedges; 9 − boundary of seasonal active layer; 10 − location of bones of Pleistocene animals sampled for 14C dating; 11 − location of 14C samples of plant remains; 12 − radiocarbon date and lab code.
Extended Data Figure 2
Extended Data Figure 2. Y chromosome phylogeny.
Maximum likelihood tree of Y chromosome sequences for modern and ancient individuals, with major haplogroups highlighted. Numbers on internal nodes show bootstrap support values from 100 replicates for nodes with bootstrap values < 100.
Extended Data Figure 3
Extended Data Figure 3. Genetic affinities of Yana.
a-c Geographic heat maps depicting outgroup-f3 statistic for a, Yana1, b, Tianyuan and c Sunghir3 with 167 world-wide populations. d, f4-statistics contrasting allele sharing of Yana and other selected UP groups with early West Eurasians (Kostenki) or East Asians (Tianyuan). e, f4-statistics for highlighting groups with affinities to both early West Eurasians and East Asians (joined with dashed lines). Error bars indicate ± 3 standard errors obtained using a block jackknife (Methods) f, Admixture graph models of ancient and modern populations for western Eurasia (left) and East Asia and the Americas (right). Newly reported individuals are highlighted with coloured background. Early Upper Palaeolithic individuals were modelled allowing for a possible additional Neanderthal contribution to account for higher level of Neanderthal ancestry (dotted lines).
Extended Data Figure 4
Extended Data Figure 4. Relatedness and identity-by-descent (IBD).
a, Kinship coefficients and R1 ratio (number of double heterozygous (Aa/Aa) sites divided by the total number of discordant genotypes) for newly reported ancient groups with multiple individuals per site. b, Number and length of homozygosity-by-descent (HBD) segments in ancient and modern individuals. Grey ellipses indicate 95% confidence region obtained from simulations of 100 haploid genomes of indicated effective population size. c, Distribution of total IBD lengths for simulations of varying effective population sizes. Observed values for pairs from Sunghir and Yana are indicated by dashed lines.
Extended Data Figure 5
Extended Data Figure 5. Genetic affinities of Kolyma1.
a, b Geographic heat maps depicting genetic affinities of Kolyma individual using (a) outgroup-f3 statistics with 167 modern populations and (b) total length of haplotype chunks donated to 206 modern populations in chromosome painting. c, chromosome painting symmetry statistic contrasting the total length of haplotypes donated from ancient and modern non-American donor groups to pairs of American populations, for two different datasets (1240K and WGS, Supplementary Information 3). The top panels show greater excess in donations to Athabascans from Kolyma1. The bottom panel shows the same statistic for West Greenland Inuit, a population with known affinity to Paleoeskimos, reflected in the excess donations observed from Saqqaq. Error bars indicate ± 3 standard errors obtained using a block jackknife.
Extended Data Figure 6
Extended Data Figure 6. Genetic diversity in Northern Eurasia related to ancient genomes.
a, PCA of 93 ancient individuals projected onto a set of 587 modern Asian and American individuals. b, c MDS plots of 715 individuals from 91 modern populations, obtained from the chromosome painting co-ancestry matrix using modern Africans and high coverage ancient individuals as donors, based on (b) total length of chunks, or (c) total number of chunks.
Extended Data Figure 7
Extended Data Figure 7. Admixture modelling using qpAdm.
a, Maps showing locations and ancestry proportions of ancient (left) and modern (right) groups. b-d, Ancestry proportions and fit for all possible 2-way (b), 3-way (c) and 4-way (d) reference population combinations. Transparent shading indicates model fit, with lighter transparency indicating models accepted with 0.05 > p ≥ 0.01 in qpAdm. Number of individuals for source and target populations are given in brackets.
Extended Data Figure 8
Extended Data Figure 8. Paleo-climatic niche modelling.
Maps showing climatically suitable regions for human occupation across temporal and spatial dimensions. Projections are bounded between 60 E to 180 E and from 38 N to 80N. Colour-key represents suitability values, with darker (lighter) colours corresponding to higher (lower) suitability values. a, Examples of climatic suitability for human occupation for different time slices. b, Median and standard deviation of climatic suitability across 23 climatic periods of millennial or bi-millennial time resolution. c, Regions highly climatically suitable for humans (red), low (grey), and regions with both periods of high and low suitability (orange)
Figure 1
Figure 1. Genetic structure of ancient northeast Siberians.
a, Sampling locations of newly reported and selected previously published individuals (italics). b, Sample ages. c, PCA of 257 ancient individuals projected onto a set of 1,541 modern Eurasian and American individuals. Abbreviations in group labels: UP − Upper Palaeolithic; LP − Late Palaeolithic; M − Mesolithic; EN − Early Neolithic; MN − Middle Neolithic; LN − Late Neolithic; EBA − Early Bronze Age; LBA - Late Bronze Age; IA − Iron Age; PE − Paleoeskimo; MED - Medieval
Figure 2
Figure 2. Demographic modelling of Siberian and Native American populations. Inferred parameters for models with:
a, Ancient and modern Siberian populations, b, Siberian and Ancient Beringian. Point parameter estimates are shown in bold and 95% confidence intervals within square brackets. Times of events in kya indicated in the left, and admixture estimates in percentage in the arrows. Neanderthal contribution was modelled as an unsampled (“ghost”) Neanderthal population contributing 3% into the ancestors of all Eurasian populations, and an extra 0.5% into the Asian lineage. Neanderthal effective size and split times were fixed according to recent estimates based on genome-wide SFS. Shaded arrows for the “Siberia and Ancient Beringia” model (b) indicate admixture proportions that were fixed to values estimated under model (a).
Figure 3
Figure 3. Genetic legacy of ancient Eurasians.
a, World-wide map of top haplotype donations inferred by chromopainter. Coloured symbols represent a modern recipient population, with the colour and shape indicating the donor population contributing the highest fraction of haplotypes to that recipient population. Geographic locations of donor populations used in this analysis (modern Africans and ancient Eurasians) are indicated by the corresponding larger symbols with black outline added. Extended regions of shared top donors are visualized by spatial interpolation of the respective donor population color. b, Major hypothesized migrations into northeast Siberia. Arrows indicate putative migrations giving rise to Ancient North Siberians (left), Ancient Paleosiberians (middle) and Neosiberians (right). Key sample locations for the respective time slice are indicated with symbols. Small blue arrows in the middle panel indicate possible ANS admixture scenarios: (1) admixture in Southern Siberia (2) admixture in Beringia.

Comment in

References

    1. Fedorova SA, et al. Autosomal and uniparental portraits of the native populations of Sakha (Yakutia): implications for the peopling of Northeast Eurasia. BMC Evolutionary Biology. 2013;13:127. doi: 10.1186/1471-2148-13-127. - DOI - PMC - PubMed
    1. Pugach I, et al. The Complex Admixture History and Recent Southern Origins of Siberian Populations. Mol Biol Evol. 2016:msw055. doi: 10.1093/molbev/msw055. - DOI - PMC - PubMed
    1. Wong EHM, et al. Reconstructing genetic history of Siberian and Northeastern European populations. Genome Res. 2017;27:1–14. doi: 10.1101/gr.202945.115. - DOI - PMC - PubMed
    1. Pitulko VV, et al. The Yana RHS Site: Humans in the Arctic Before the Last Glacial Maximum. Science. 2004;303:52–56. - PubMed
    1. Pitulko VV, Nikolskiy PA, Basilyan A, Pavlova EY. In: Paleoamerican Odyssey. Graf KE, Ketron CV, Waters MR, editors. Texas A&M University Press; 2014. Human Habitation in Arctic Western Beringia Prior to the LGM.

Methods references

    1. Allentoft ME, et al. Population genomics of Bronze Age Eurasia. Nature. 2015;522:167–172. - PubMed
    1. Damgaard PB, et al. Improving access to endogenous DNA in ancient bones and teeth. Sci Rep. 2015;5:11184. doi: 10.1038/srep11184. - DOI - PMC - PubMed
    1. Orlando L, et al. Recalibrating Equus evolution using the genome sequence of an early Middle Pleistocene horse. Nature. 2013;499:74. - PubMed
    1. Dabney J, Meyer M. Length and GC-biases during sequencing library amplification: a comparison of various polymerase-buffer systems with ancient and modern DNA sequencing libraries. BioTechniques. 2012;52:87–94. - PubMed
    1. Schubert M, Lindgreen S, Orlando L. AdapterRemoval v2: rapid adapter trimming, identification, and read merging. BMC Res Notes. 2016;9 doi: 10.1186/s13104-016-1900-2. - DOI - PMC - PubMed

Publication types