. 2019 Jun;570(7762):523-527.
doi: 10.1038/s41586-019-1289-x. Epub 2019 Jun 5.

Individual brain organoids reproducibly form cell diversity of the human cerebral cortex

Affiliations

Individual brain organoids reproducibly form cell diversity of the human cerebral cortex

Silvia Velasco et al. Nature. 2019 Jun.

Abstract

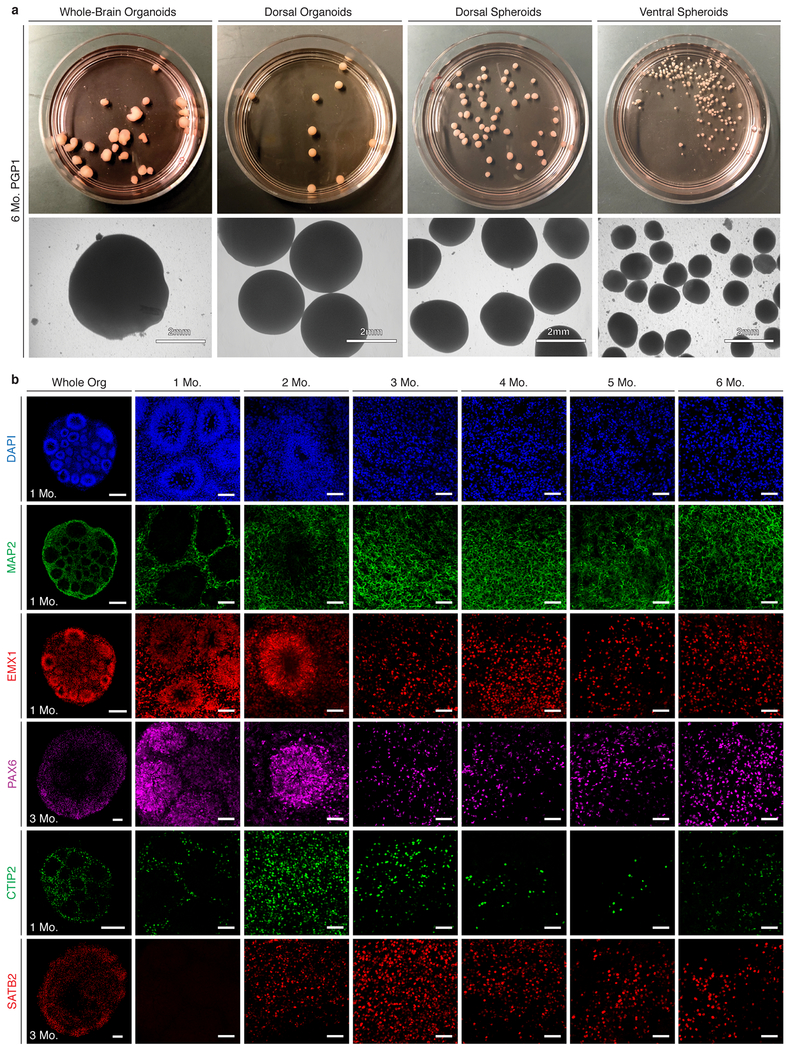
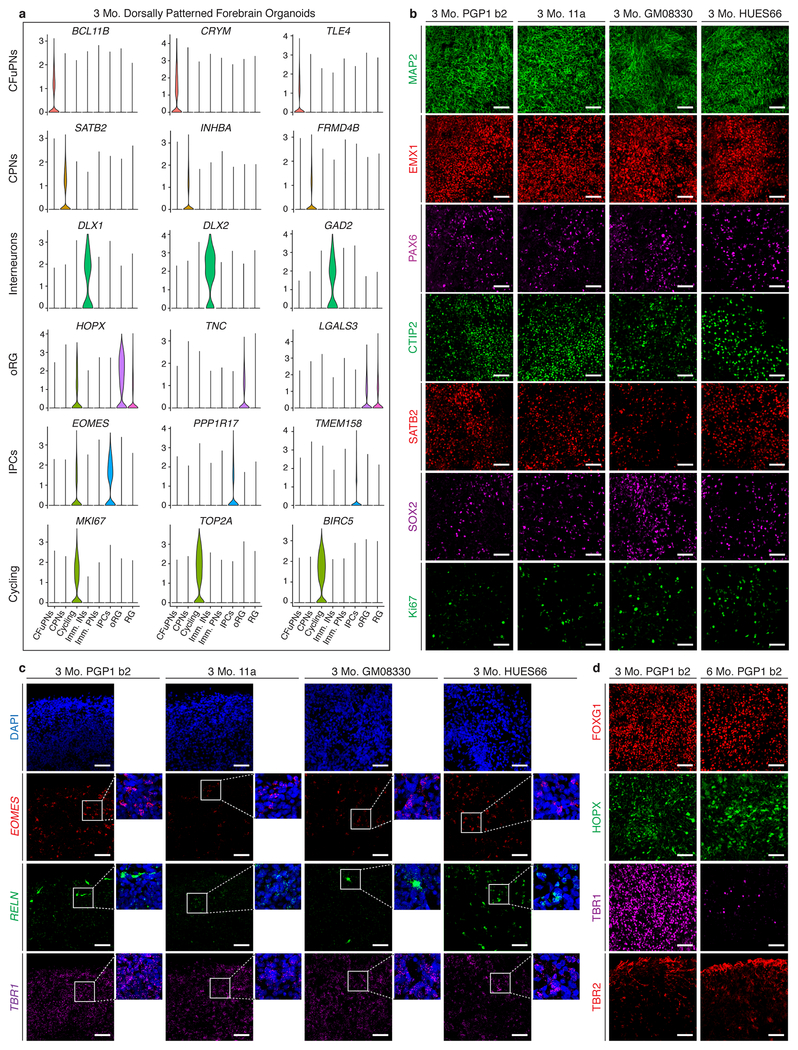
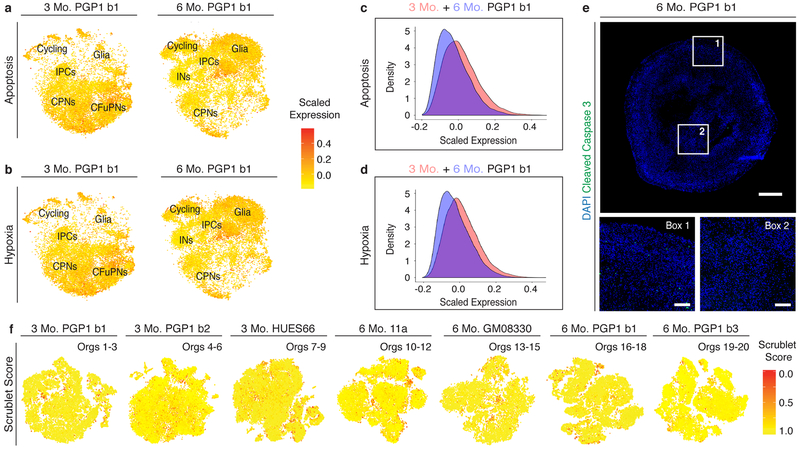
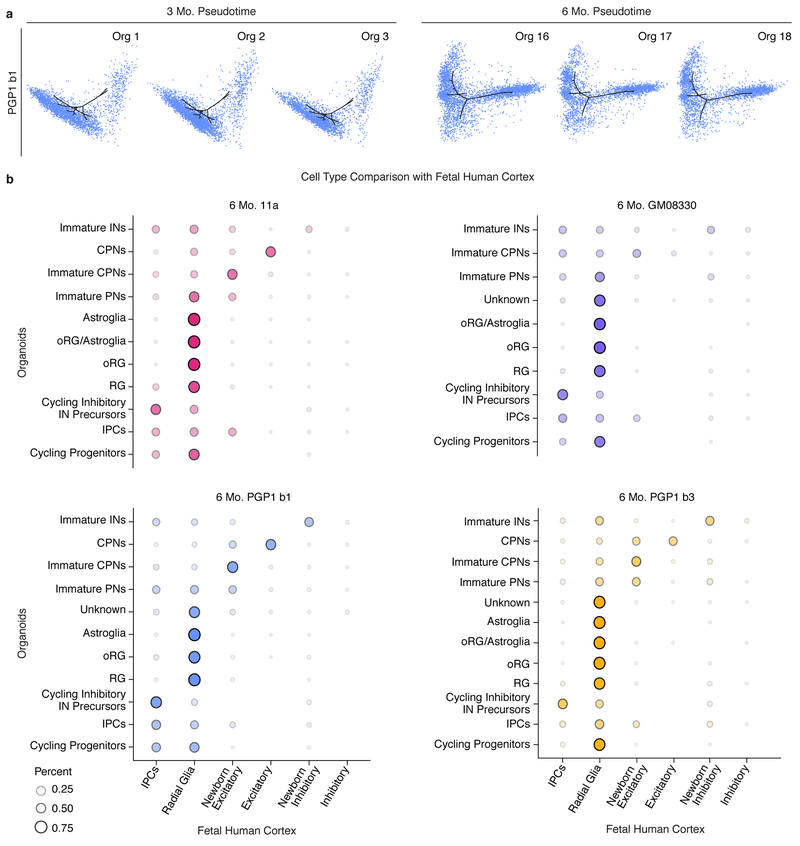
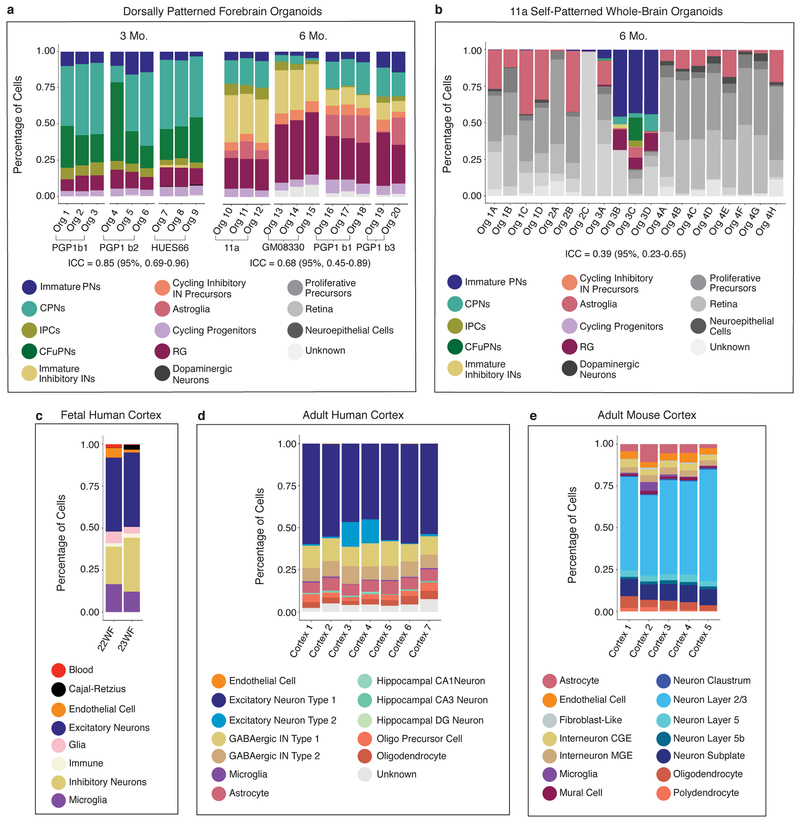
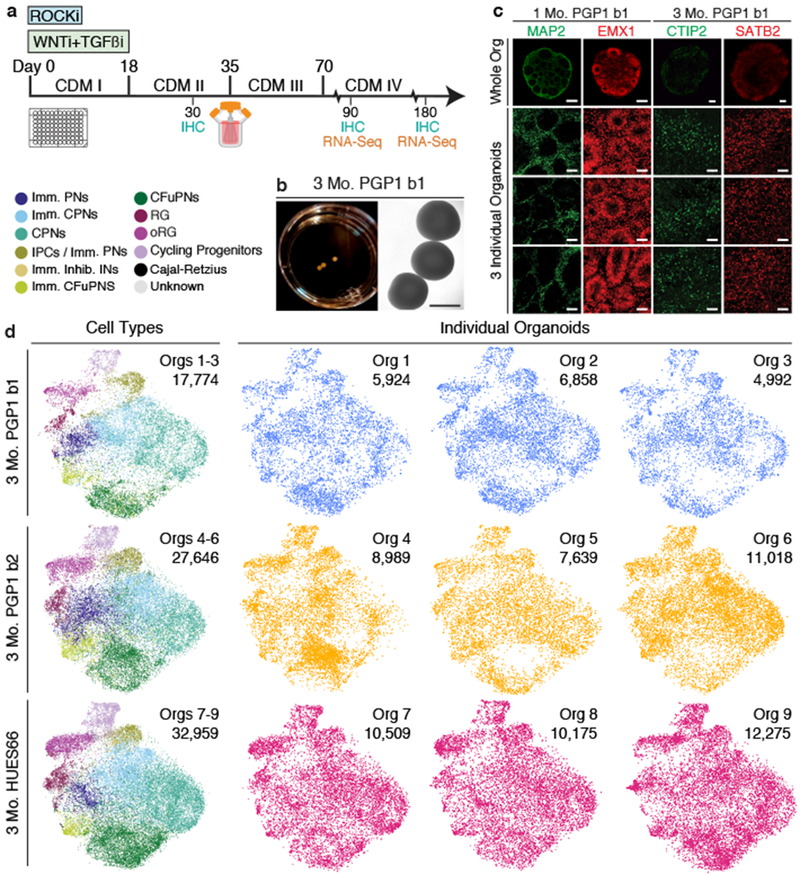
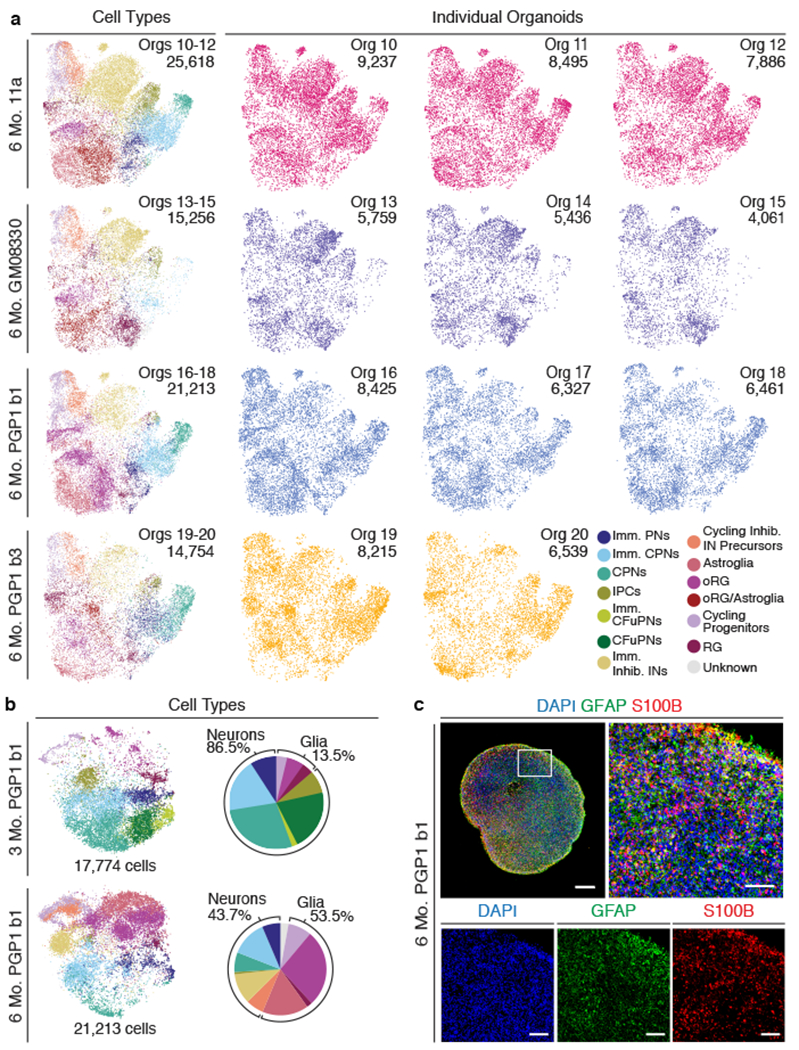
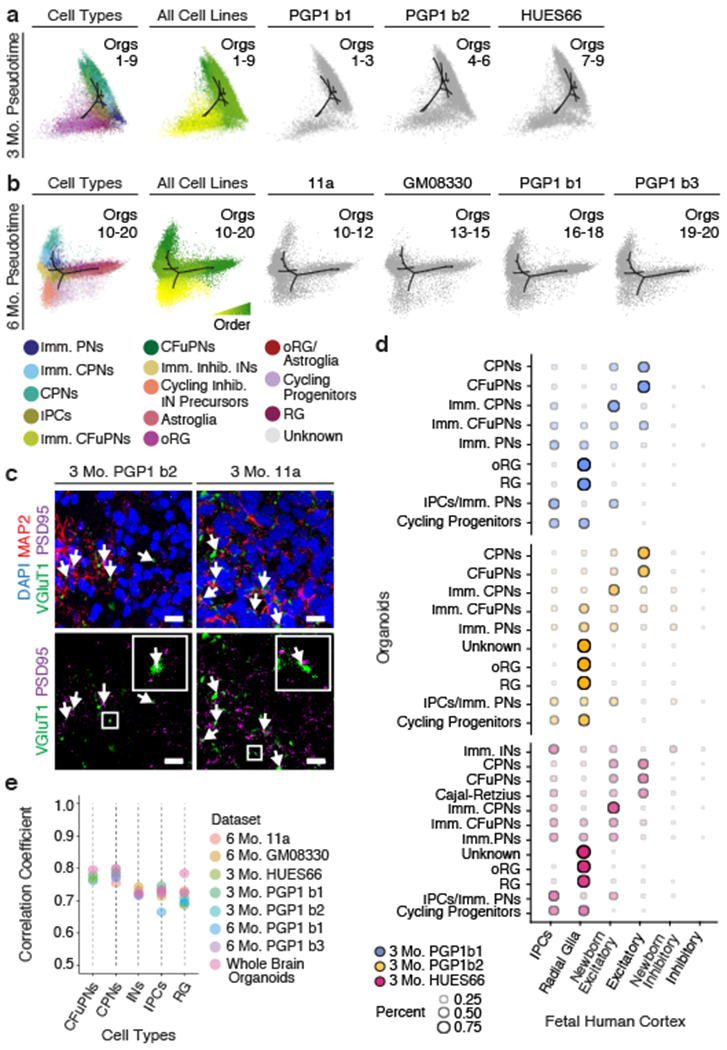
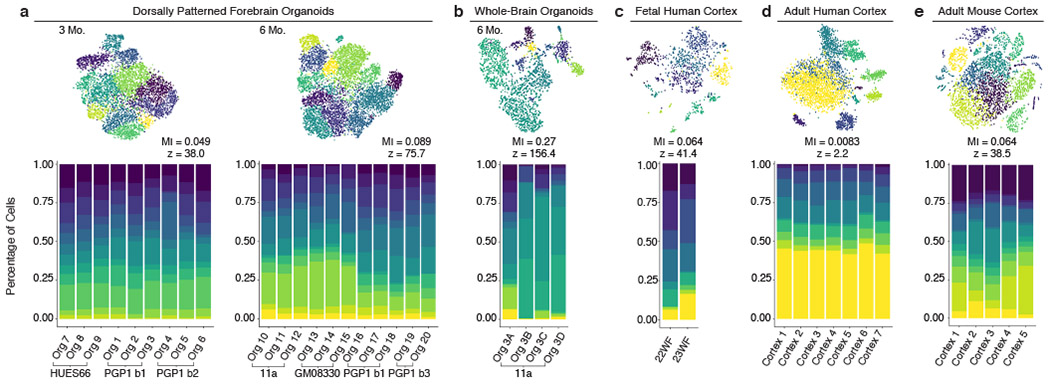
Experimental models of the human brain are needed for basic understanding of its development and disease1. Human brain organoids hold unprecedented promise for this purpose; however, they are plagued by high organoid-to-organoid variability2,3. This has raised doubts as to whether developmental processes of the human brain can occur outside the context of embryogenesis with a degree of reproducibility that is comparable to the endogenous tissue. Here we show that an organoid model of the dorsal forebrain can reliably generate a rich diversity of cell types appropriate for the human cerebral cortex. We performed single-cell RNA-sequencing analysis of 166,242 cells isolated from 21 individual organoids, finding that 95% of the organoids generate a virtually indistinguishable compendium of cell types, following similar developmental trajectories and with a degree of organoid-to-organoid variability comparable to that of individual endogenous brains. Furthermore, organoids derived from different stem cell lines show consistent reproducibility in the cell types produced. The data demonstrate that reproducible development of the complex cellular diversity of the central nervous system does not require the context of the embryo, and that establishment of terminal cell identity is a highly constrained process that can emerge from diverse stem cell origins and growth environments.


Conflict of interest statement

The authors declare no competing interests.

Figures

Extended Data Figure 1:
Extended Data Figure 1:. Comparison of organoids and spheroids generated by different protocols.
a, From left: self-patterned whole-brain organoids, dorsally patterned forebrain organoids (protocol modified from Kadoshima et al.), and dorsal and ventral forebrain spheroids (protocol modified from Rigamonti et al.). All models are generated from the PGP1 line and cultured for 6 months. b, IHC for neuronal (MAP2), dorsal forebrain progenitor (EMX1 and PAX6), CFuPN (CTIP2), and CPN (SATB2) markers, across a time course from 1 to 6 months [scale bars: whole organoids (Whole Org), left column, 200μm; close-up images, 50μm].
Extended Data Figure 2:
Extended Data Figure 2:. Analysis of cell type-specific markers in organoids derived from different lines.
a, Expression of selected marker genes used in cell type identification. Violin plots show distribution of normalized expression in cells from CCA-aligned organoids at 3 months (n=9 organoids from 3 batches). CFuPNS: n=15,866 cells; CPNs, n=18,905 cells; Cycling, n=4,035 cells; Immature INs, n=353 cells; Immature PNs, n=6,727 cells; IPCs, 4,276 cells; oRG, n=5,436 cells; and RG, n=3,318 cells. Scale: normalized read counts. b, IHC for neuronal (MAP2), dorsal forebrain progenitor (EMX1 and PAX6), CFuPN (CTIP2), CPN (SATB2), radial glia (SOX2), and proliferation (Ki67) markers in PGP1 (b2), 11a, GM08330, and HUES66 organoids at 3 months. c, In situ RNA hybridization for the IPC (EOMES a.k.a. TBR2), Cajal-Retzius (Reelin), and post-mitotic PN (TBR1) markers in 3 month PGP1 (b2), 11a, GM08330, and HUES66 organoids. d, IHC for the forebrain progenitor (FOXG1), outer radial glia (HOPX), post-mitotic PN (TBR1), and IPC (TBR2) markers in PGP1 (b2) organoids at 3 and 6 months (scale bars for B, C, D: 50 μm). Abbreviations as in Figure 1.
Extended Data Figure 3:
Extended Data Figure 3:. Evaluation of apoptosis, hypoxia, and doublets in organoid scRNA-seq data.
a-b, T-SNE plots showing average scaled expression of all genes from the a, apoptosis and b, hypoxia mSigDB Hallmark genesets in PGP1 (b1) organoids at 3 (left) and 6 (right) months. Abbreviations as in Figure 1. n=3 organoids per timepoint. c-d, Histograms showing number of cells expressing c, apoptosis markers and d, hypoxia markers in PGP1 organoids at 3 and 6 months. X-axis indicates average scaled expression of all genes in the corresponding mSigDB Hallmark geneset. The similarity in markers of hypoxia and apoptosis between the three and six month single-cell data indicates that the growth conditions of this protocol preserve the health of the tissue over many months in culture. e, IHC of a 6 month PGP1 organoid for the apoptotic marker activated caspase 3, on the perimeter (Box 1) and in the center of an organoid (Box 2) (scale bar: whole organoid section, 500 μm; close-up images, 100μm). f, Multiplet detection using the Scrublet program. Scores represent the probability that the “cell” represents a droplet containing more than one cell. From left, t-SNE plots of PGP1 (two batches: b1, b2; n=3 organoids for b1, and n=3 organoids for b2) and HUES66 (n=3 organoids) organoids at 3 months; and 11a (n=3 organoids), GM08330 (n=3 organoids), and PGP1 (two batches: b1, b3; n=3 organoids for b1, and n=2 organoids for b3) organoids at 6 months. Overall, 2-8% of cells were predicted to be multiplets, which is consistent with the expected multiplet rate (~5%) given our loadings of approximately 10,000 cells per channel.
Extended Data Figure 4:
Extended Data Figure 4:. Cell types in individual organoids are generated following a precise and reproducible temporal order and are transcriptionally similar to human fetal cortex cell types.
a, T-SNE plots produced by Monocle2 showing the contribution of cells from individual PGP1 (b1) organoids at 3 (n=2,665, 3,094, and 2,264 cells from Orgs 1-3) and 6 months (n=3,959, 2,971, and 3,042 cells from Orgs 16-18) to plots in Fig. 3a–b. b, Agreement between cell type classifications in cell populations of 11a, GM08330, and PGP1 organoids (two batches: b1, b3) at 6 months with cell types described in a previously published single-cell RNA-seq dataset of the human fetal cortex. Dot size and color intensity indicate the percent of organoid cells in each cell cluster assigned to each human cortex cell type by a Random Forest classifier. Abbreviations as in Figure 1.
Extended Data Figure 5:
Extended Data Figure 5:. Dorsally patterned forebrain organoids show reproducibility similar to that of endogenous brain, as compared to self-patterned whole-brain organoids.
a-b, Percent distribution of cell types in a, (left) individual 3 month PGP1 (two batches: b1, b2) and HUES66 (n=3 per batch) dorsally patterned forebrain organoids, and (right) individual 6 month 11a, GM08330, and PGP1 (two batches: b1, b3, n=3 per batch) dorsally patterned forebrain organoids, vs. b, individual 6 month self-patterned whole-brain organoids. c-e, Distribution of cell types as assigned in the original publication across c, individual samples of fetal human cortex, d, adult human cortex samples from distinct individuals, and e, adult mouse cortex samples from distinct individuals. Abbreviations as in Fig. 1. DG, dentate gyrus; CGE, caudal ganglionic eminence; MGE, medial ganglionic eminence.
Figure 1:
Figure 1:. Brain organoids cultured for 3 months generate cellular diversity of the human cerebral cortex with high organoid-to-organoid reproducibility.
a, Protocol schematic. b, 3 month PGP1 (batch 1: b1) organoids. c, IHC of 1 month PGP1 (b1) organoids for neuronal (MAP2) and dorsal forebrain progenitor (EMX1) markers, and of 3 month PGP1 (b1) organoids for corticofugal projection neuron (CTIP2) and callosal projection neuron (SATB2) markers. Top, entire organoids (scale bar, 200 μm); bottom, high-magnification views of three different organoids per timepoint (scale bar, 50 μm). d, T-distributed stochastic neighbor embedding (t-SNE) plots of scRNA-seq data from 3 month organoids after canonical correlation analysis (CCA) batch correction and alignment (PGP1: two batches, b1, b2; HUES66: one batch, n=3 organoids per batch). Left column, combined organoids from each batch, colored by cell types; right, individual organoids. Number of cells per plot are indicated. PNs, projection neurons; CPNs, callosal PNs; IPCs, intermediate progenitor cells, CFuPNs, corticofugal PNs; INs, interneurons; RG, radial glia; oRG, outer radial glia; Imm., immature; Inhib., inhibitory. Information on replicates for all figures is reported in the Methods under “Statistics and Reproducibility”.
Figure 2:
Figure 2:. Brain organoids cultured for 6 months show increased cortical cell diversity while maintaining high organoid-to-organoid reproducibility.
a, T-SNE plots of combined 6 month organoids after batch correction (11a: one batch; GM08330: one batch; PGP1: two independent batches, b1, b3; n=3 organoids per batch). Left column, combined organoids from each batch, colored by cell type; right, individual organoids. Abbreviations as in Figure 1. b, Left, t-SNE plots of PGP1 (b1) organoids at 3 and 6 months (n=3 organoids per timepoint) after batch correction. Right, percent distribution of cell types at each timepoint. c, IHC for astroglial markers GFAP and S100B in a PGP1 (b1) organoid at 6 months (scale bar: whole organoid, 500 μm; high-magnification, 100μm).
Figure 3:
Figure 3:. Cells in organoids are generated following a precise and reproducible trajectory and are transcriptionally similar to cells of the human fetal cortex.
a-b, Pseudotime t-SNE plots for the 3 (a) and 6 (b) month organoids shown in Figures 1d and 2a, colored according to cell type (far left) and pseudotime trajectory (center left; yellow-early to green-late). Right: contribution of each batch of organoids to the pseudotime plots. (n=3 organoids per batch, downsampled to 35,000 cells per timepoint.) c, Agreement between cell type classifications in the human fetal cortex and in cell populations of organoids at 3 months (n=3 organoids per batch). Dot size and color intensity indicate the percent of cells in each organoid cell type assigned to each human cell type by a Random Forest classifier. Abbreviations as in Fig. 1. d, Spearman correlation coefficients of variable gene expression in human fetal cortex with equivalent cell types found in dorsally patterned forebrain organoids (n as in Figures 1d and 2a) and self-patterned whole-brain organoids (n=19 individual organoids, 4 independent batches). e, IHC for neuronal (MAP2) and excitatory presynaptic (VGluT1) and postsynaptic (PSD95) markers in 3 month PGP1 and 11a dorsally patterned organoids; co-localization is shown in white (arrows) (scale bars: 20μm). Lower panels: VGluT1 and PSD95 staining alone; insets: enlargements of boxed areas.
Figure 4:
Figure 4:. Dorsally patterned organoids show sample-to-sample reproducibility similar to endogenous brains.
(a-e) Percent of cells from each individual organoid or endogenous cortex belonging to each cell cluster in identically processed datasets from a, dorsally patterned forebrain organoids at 3 months (3 batches, n=9 organoids) and 6 months (4 batches, n=11 organoids), b, self-patterned whole-brain organoids at 6 months (n=4), c, fetal human cortex (n=2), d, adult human cortex (n=7), and e, adult mouse cortex (n=5). Top: t-SNE plots of the cell clusters for each dataset. Mutual information (MI) scores represent the dependence between the cluster and the individual (scores range from 0: individuals have the same cluster makeup, to 1: individuals cluster separately). Z-scores represent the divergence of the MI score from the mean MI score expected at random. All datasets downsampled to n=659 cells per sample.

Similar articles

Cited by

References

    1. Silbereis JC, Pochareddy S, Zhu Y, Li M & Sestan N The Cellular and Molecular Landscapes of the Developing Human Central Nervous System. Neuron 89, 248–268 (2016). - PMC - PubMed
    1. Quadrato G, Brown J & Arlotta P The promises and challenges of human brain organoids as models of neuropsychiatric disease. Nat. Med 22, 1220–1228 (2016). - PubMed
    1. Quadrato G et al. Cell diversity and network dynamics in photosensitive human brain organoids. Nature 545, 48–53 (2017). - PMC - PubMed
    1. Lancaster MA et al. Cerebral organoids model human brain development and microcephaly. Nature 501, 373–379 (2013). - PMC - PubMed
    1. Kadoshima T et al. Self-organization of axial polarity, inside-out layer pattern, and species-specific progenitor dynamics in human ES cell-derived neocortex. Proc. Natl. Acad. Sci 110, 20284–20289 (2013). - PMC - PubMed

Supplementary References

    1. Sheridan SD et al. Epigenetic characterization of the FMR1 gene and aberrant neurodevelopment in human induced pluripotent stem cell models of fragile X syndrome. PLoS One 6, e26203 (2011). - PMC - PubMed
    1. Sugathan A et al. CHD8 regulates neurodevelopmental pathways associated with autism spectrum disorder in neural progenitors . Proc. Natl. Acad. Sci 111, E4468–E4477 (2014). - PMC - PubMed
    1. Velasco S, Paulsen B & Arlotta P Highly reproducible human brain organoids recapitulate cerebral cortex cellular diversity. Nat. Protoc. Exch (2019).
    1. Quadrato G, Sherwood JL & Arlotta P Long term culture and electrophysiological characterization of human brain organoids. Protoc. Exch (2017). doi:10.1038/protex.2017.049 - DOI
    1. Zheng GXY et al. Massively parallel digital transcriptional profiling of single cells. Nat. Commun 8, 1–12 (2017). - PMC - PubMed

Publication types