. 2019 Oct;138(4):551-574.
doi: 10.1007/s00401-019-02032-w. Epub 2019 Jun 6.

Tau is required for progressive synaptic and memory deficits in a transgenic mouse model of α-synucleinopathy

Affiliations

Tau is required for progressive synaptic and memory deficits in a transgenic mouse model of α-synucleinopathy

Balvindar Singh et al. Acta Neuropathol. 2019 Oct.

Abstract

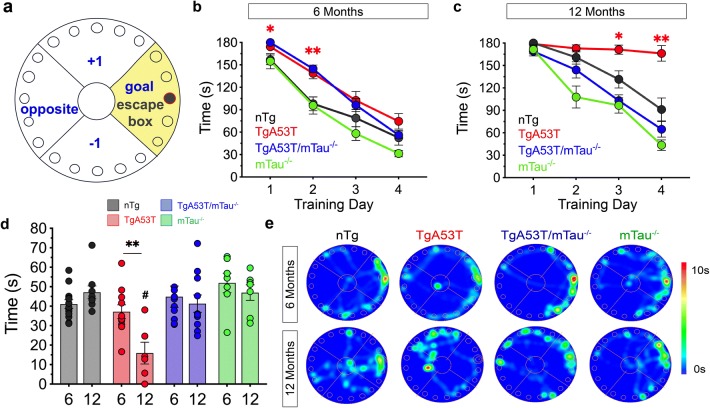
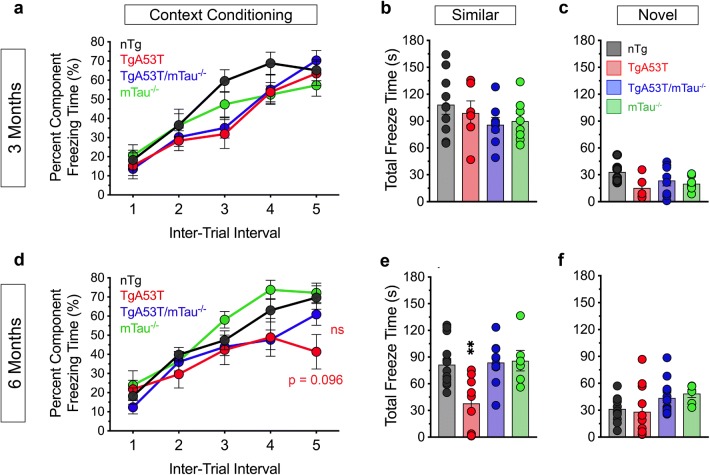
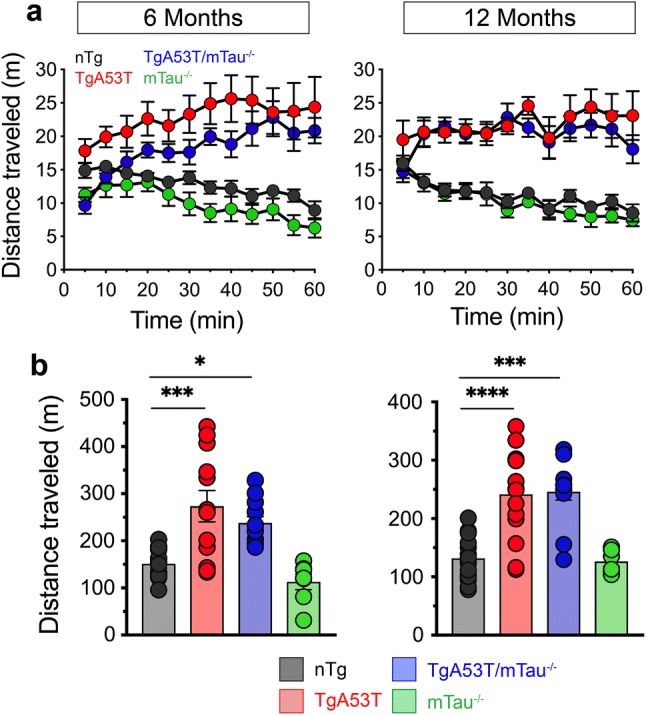
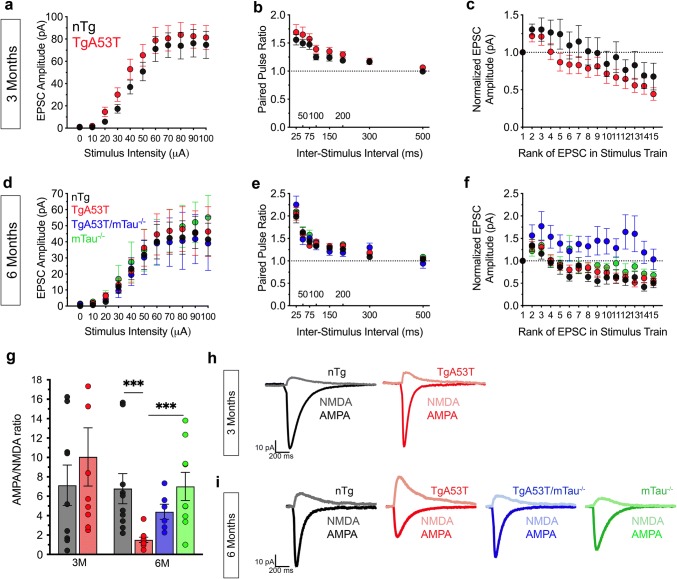
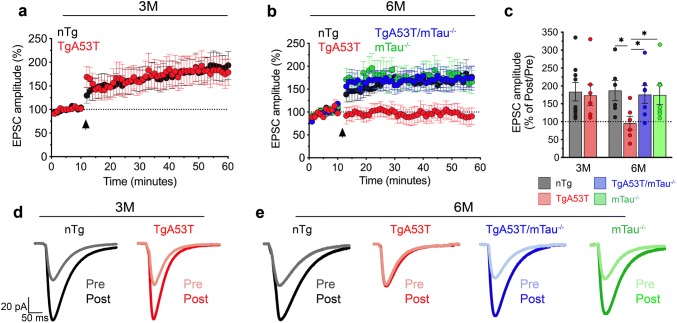
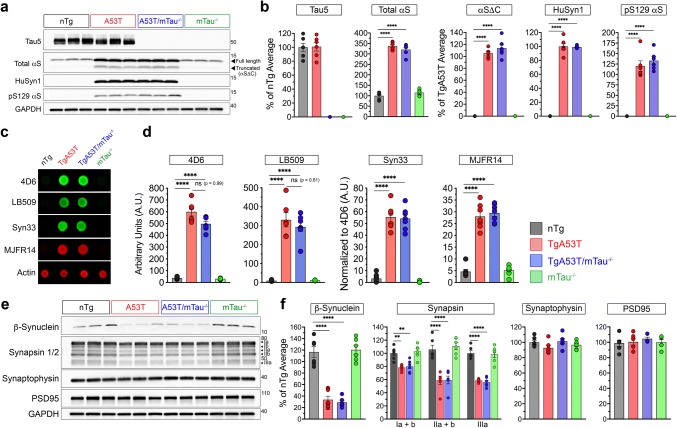
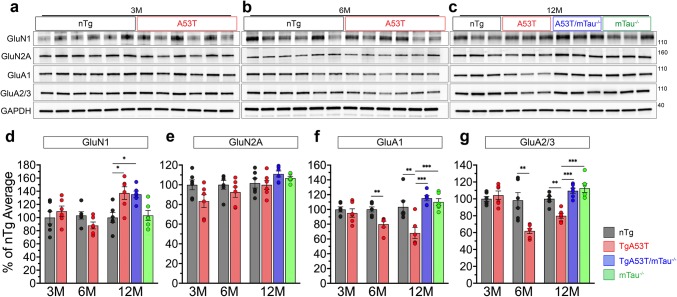
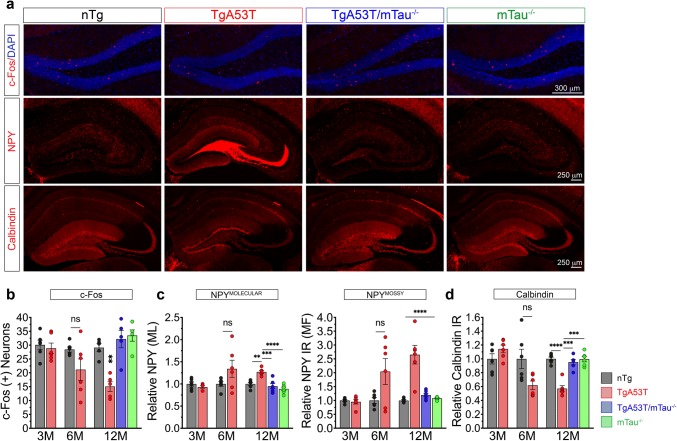
Parkinson's disease dementia (PDD) and dementia with Lewy bodies (DLB) are clinically and neuropathologically highly related α-synucleinopathies that collectively constitute the second leading cause of neurodegenerative dementias. Genetic and neuropathological studies directly implicate α-synuclein (αS) abnormalities in PDD and DLB pathogenesis. However, it is currently unknown how αS abnormalities contribute to memory loss, particularly since forebrain neuronal loss in PDD and DLB is less severe than in Alzheimer's disease. Previously, we found that familial Parkinson's disease-linked human mutant A53T αS causes aberrant localization of the microtubule-associated protein tau to postsynaptic spines in neurons, leading to postsynaptic deficits. Thus, we directly tested if the synaptic and memory deficits in a mouse model of α-synucleinopathy (TgA53T) are mediated by tau. TgA53T mice exhibit progressive memory deficits associated with postsynaptic deficits in the absence of obvious neuropathological and neurodegenerative changes in the hippocampus. Significantly, removal of endogenous mouse tau expression in TgA53T mice (TgA53T/mTau-/-), achieved by mating TgA53T mice to mouse tau-knockout mice, completely ameliorates cognitive dysfunction and concurrent synaptic deficits without affecting αS expression or accumulation of selected toxic αS oligomers. Among the known tau-dependent effects, memory deficits in TgA53T mice were associated with hippocampal circuit remodeling linked to chronic network hyperexcitability. This remodeling was absent in TgA53T/mTau-/- mice, indicating that postsynaptic deficits, aberrant network hyperactivity, and memory deficits are mechanistically linked. Our results directly implicate tau as a mediator of specific human mutant A53T αS-mediated abnormalities related to deficits in hippocampal neurotransmission and suggest a mechanism for memory impairment that occurs as a consequence of synaptic dysfunction rather than synaptic or neuronal loss. We hypothesize that these initial synaptic deficits contribute to network hyperexcitability which, in turn, exacerbate cognitive dysfunction. Our results indicate that these synaptic changes present potential therapeutic targets for amelioration of memory deficits in α-synucleinopathies.

Keywords: Dementia; Lewy body disease; Neuronal plasticity; Parkinson’s disease; Tau; α-Synuclein.


Conflict of interest statement

SEL is a scientific consultant for Acelot, Inc. and has no actual or potential conflict of interest in relation to this study. All other authors declare no conflict of interest.

Figures

Fig. 1
Fig. 1
Mutant A53T αS-driven deficits in spatial learning and memory are progressive and tau-dependent. Average duration of training trials per group for each of the 4 training days during the Barnes Maze (BM) when tested at either 6 (a) or 12 months of age (6M or 12M) (b). 6M training: three-way repeated measures ANOVA with Geisser–Greenhouse correction and Tukey’s posthoc analysis revealed a significant effect of training day [F(2.448,105.3) = 190.7, p < 0.0001], significant effect of hαSA53T genotype [F(1,43) = 18.63, p < 0.0001], no significant effect of mTau−/− genotype [F(1,43) = 190.7, p = 0.2926], and no significant training day*hαSA53T*mTau−/− interaction [F(3,129) = 0.1160 p = 0.9506]. 12M training: three-way repeated measures ANOVA with Geisser–Greenhouse correction and Tukey’s posthoc analysis revealed a significant effects of training day [F(2.192,63.56) = 62.15, p < 0.0001], hαSA53T genotype [F(1,29) = 13.78, p = 0.0009], and mTau−/− genotype [F(1,29) = 49.05, p < 0.0001], and no significant training day*hαSA53T*mTau−/− interaction [F(3,87) = 3.734, p = 0.0141]. c BM diagram for testing and probe trial, with yellow shading indicating goal quadrant and dark grey showing escape box location in that quadrant. d Time spent in goal quadrant during probe trial for 6M or 12M mice. To compare within genotype between 6 and 12M: unpaired t test with Welch’s correction; TgA53T: t = 3.369 and df = 15 (**p = 0.0042). To compare between genotypes at 6M or 12M: one-way ANOVA with Tukey’s posthoc analysis. 12M group probe test: F(3,29) = 9.216 (#p = 0.0002). 6M: nnTg = 13; nTgA53T = 11; nTgA53T/mTau−/− = 10; nmTau−/− = 8. 12M: nnTg = 9; nTgA53T = 7; nTgA53T/mTau−/− = 11; nmTau−/− = 8. e Probe test BM occupancy heat maps during probe test obtained by averaging the location of all animals in each genotype and cohort. Orientation of BM is shown in c. In all figures: (1) the color code is: nTg (black), TgA53T (red), TgA53T/mTau−/− (blue), and mTau−/− (green); (2) the data are expressed as mean ± standard error of the mean (SEM); and (3) *p < 0.05, **p < 0.01, ***p < 0.001, and ****p < 0.0001, unless stated otherwise
Fig. 2
Fig. 2
Mutant synuclein impairs hippocampal contributions to contextual fear conditioning in both age and tau-dependent manners. Contextual fear conditioning (CFC) in mice at 3 months (3M) (a–c) and 6 months (6M) of age (d–f). 3M conditioning trial (a): three-way repeated measures ANOVA with Geisser–Greenhouse correction and Tukey’s posthoc analysis revealed a significant effect of inter-trial interval [F(3.200,89.59) = 67.91, p < 0.0001], no significant effect of hαSA53T genotype [F(1,28) = 2.123, p = 0.1562], no significant effect of mTau−/− genotype [F(1,28) = 0.2536, p = 0.6185], and no significant inter-trial interval*hαSA53T*mTau−/− interaction [F(4,112) = 1.075, p = 0.3723]. 6M conditioning trial (d): three-way repeated measures ANOVA with Geisser–Greenhouse correction and Tukey’s posthoc analysis revealed a significant effect of inter-trial interval [F(3.175,120.6) = 52.72, p < 0.0001], a significant effect of hαSA53T genotype [F(1,38) = 5.429, p = 0.0252], no significant effect of mTau−/− genotype [F(1,38) = 0.7273, p = 0.3991], and no significant inter-trial interval*hαSA53T*mTau−/− interaction [F(4,152) = 2.257, p = 0.0655]. Percent of time spent freezing during conditioning trials (a, d) show similar responses in all genotypes. When mice are exposed to the similar environment, all genotypes show similar freezing responses at 3M (b), while 6M TgA53T mice freeze less than controls (e) [one-way ANOVA with Tukey’s posthoc analysis: F(3,37) = 7.538, p = 0.0005], indicating defective CFC. In contrast, 6M TgA53T/mTau−/− mice show normal memory (e). Responses to the novel environment are not different between groups at both 3M (c) and 6M (f). 3M: nnTg = 8; nTgA53T = 7; nTgA53T/mTau−/− = 8; nmTau−/− = 9. 6M: nnTg = 13; nTgA53T = 11; nTgA53T/mTau−/− = 10; nmTau−/− = 8. One- and three-way ANOVA: **p < 0.01. ns not significant. Error bars represent mean ± SEM
Fig. 3
Fig. 3
Locomotor hyperactivity in the TgA53T model is tau-independent. a Distance traveled (m), binned into 5-min intervals, for the entire 60-min activity trial. b Summary graph of total distance traveled during the entire 60-min trial. TgA53T and TgA53T/mTau−/− mice exhibit increases activity compared to controls (nTg and mTau−/−). 6 months (6M): F(3,40) = 11.47 (p < 0.0001), one-way ANOVA with Tukey’s posthoc analysis. 12 months (12M): F(3,47) = 19.28 (p < 0.0001), one-way ANOVA with Tukey’s posthoc analysis. 6M: nnTg = 11; nTgA53T = 12; nTgA53T/mTau−/− = 11; nmTau−/− = 9. 12M: nnTg = 13; nTgA53T = 9; nTgA53T/mTau−/− = 11; nmTau−/− = 8. One-way ANOVA: *p < 0.05 and ***p < 0.001. Error bars represent mean ± SEM
Fig. 4
Fig. 4
Tau is required for progressive loss of AMPAR-mediated neurotransmission in TgA53T neurons. Core excitatory postsynaptic current (EPSC) synaptic parameters assed in acute hippocampal slices from animals at 2–3 (3 months, 3M) and 5–6 (6 months, 6M) months of age, respectively: a, d Input–output curve. b, e Short-term potentiation measured via paired-pulse facilitation. c, f Short-term depression analyzed through synaptic fatigue. 3M: input–output: genotype F(1,262) = 4.790, p = 0.0295, stimulus intensity F(10,262) = 28.19, p < 0.0001, genotype*stimulus intensity interaction F(10,262) = 0.1596, p = 0.9985; paired pulse: genotype F(1,176) = 7.422, p = 0.0071; inter-stimulus interval F(7,176) = 15.34, p < 0.0001; genotype*inter-stimulus interval interaction F(7,176) = 0.1785, p = 0.9894; synaptic fatigue: genotype F(1,360) = 14.26, p = 0.0002, EPSC in train F(14,360) = 4.611, p < 0.0001, genotype*EPSC in train interaction F(14,360) = 0.2468, p = 0.9978; all two-way ANOVA with Sidak’s posthoc analysis. 6M: Input–output: genotype F(3,407) = 0.7457, p = 0.5253, stimulus intensity F(10,407) = 13.90, p < 0.0001, genotype*stimulus intensity interaction F(30,407) = 0.05744, p > 0.9999; paired pulse: genotype F(3,318) = 0.8501, p = 0.4674, inter-stimulus interval F(7,318) = 51.83, p < 0.0001, genotype*inter-stimulus interval interaction F(7,318) = 0.7178, p = 0.8147; synaptic fatigue: genotype F(3,645) = 42.33, p < 0.0001, EPSC in train F(14,645) = 5.048, p < 0.0001, genotype*EPSC in train interaction F(42,645) = 0.7835, p = 0.8360; all two-way ANOVA with Tukey’s posthoc analysis. 3M (mice/slices/cells): nnTg = 3/7/13; nTgA53T = 3/7/13. 6M (mice/slices/cells): nnTg = 5/10/11; nTgA53T = 5/9/11; nTgA53T/mTau−/− = 4/8/8; nmTau−/− = 4/11/11. Except for modest reductions in synaptic fatigue associated with the mTau−/− genotype (f), there are no obvious differences in evoked synaptic parameters. g Ratio of amplitude of AMPA:NMDA currents in CA1 pyramidal neurons from nTg and TgA53T mice at 3M, and nTg, TgA53T, TgA53T/mTau−/−, and mTau−/− at 6M. AMPA/NMDA: F(3,31) = 5.044, p = 0.0058, by one-way ANOVA with Tukey’s posthoc analysis. 3M (mice/slices/cells): nnTg = 3/6/9 cells; nTgA53T = 3/6/9 cells. 6M (mice/slices/cells): nnTg = 7/9/10 cells; nTgA53T = 4/10/10 cells; nTgA53T/mTau−/− = 3/7/7 cells; nmTau−/− = 3/8/9 cells. Example AMPA and NMDA current traces from 3M (h) and 6M groups (i). While the AMPA/NMDA ratio is normal in 3-month-old TgA53T neurons, there is significant reduction in 6-month-old neurons. t test, and one- and two-way ANOVA: *p < 0.05 and ***p < 0.001. Error bars represent mean ± SEM
Fig. 5
Fig. 5
Spontaneous synaptic activity deficits in TgA53T neurons are reversed by loss of mTau expression. Spontaneous recordings of mini excitatory postsynaptic currents (mEPSCs) from CA1 pyramidal neurons in acute hippocampal slices were recorded from and analyzed for frequency (a) and amplitude (b) of mEPSCs from mice at 2–3 months (3M) and 5–6 months (6M) of age. 3M mEPSC frequency: t = 2.32, df = 13.51, p = 0.0364, by unpaired t test with Welch’s correction. 6M mEPSC frequency: F(3, 31) = 6.213, p = 0.0020, by one-way ANOVA and Tukey’s posthoc analysis. 6M mEPSC amplitude: F(3, 31) = 4.187, p = 0.0134, by one-way ANOVA and Tukey’s posthoc analysis. c Example mEPSC traces from 2 to 3-month-old TgA53T and nTg littermate controls. 3M (mice/slices/cells): nnTg = 3/7/11; nTgA53T = 3/6/10. 6M (mice/slices/cells): nnTg = 5/8/8 cells; nTgA53T = 3/7/9 cells; nTgA53T/mTau−/− = 5/11/12 cells; nmTau−/− = 3/6/7 cells. d Example mEPSC traces from 5 to 6-month-old nTg, TgA53T, TgA53T/mTau−/−, and mTau−/− mice. The results show that reductions in mEPSC frequency in TgA53T neurons is not progressive from 3M to 6M, while reductions in mEPSC amplitude in TgA53T neurons is age-progressive over this time frame. t test and one-way ANOVA: *p < 0.05 and **p < 0.01. Error bars represent mean ± SEM
Fig. 6
Fig. 6
Progressive deficits in long-term potentiation in TgA53T neurons are tau-dependent and correlate with onset of cognitive impairments. Excitatory postsynaptic currents (EPSC) recorded via whole-cell recordings from hippocampal CA1 pyramidal neurons during long-term potentiation induced by high-frequency stimulation (HFS) of Schaffer collaterals of animals at 2–3 months (3M) (a) and 5–6 months (6M) of age (b). Arrowhead indicates application of HFS. c EPSC amplitudes 45 min following HFS (post), relative to baseline established prior to HFS (pre), from both 3M to 6M animals. 6M LTP EPSC: F(3,22) = 2.584, p = 0.0262, by one-way ANOVA and Tukey’s posthoc analysis. 3M (mice/slices/cells): nnTg = 4/9/9 cells; nTgA53T = 4/7/7 cells. 6M (mice/slices/cells): nnTg = 5/6/6 cells; nTgA53T = 5/6/6 cells; nTgA53T/mTau−/− = 3/7/7 cells; nmTau−/− = 3/7/7 cells. These results show that TgA53T neurons exhibit normal LTP at 3M but severe LTP deficits at 6M. Furthermore, TgA53T/mTau−/− neurons exhibit normal LTP at 6M. d, e Example EPSC traces from LTP experiments. Presented here are pre- and post-HFS in 3M neurons (d) and 6M neurons (e). t test and one-way ANOVA: *p < 0.05. Error bars represent mean ± SEM
Fig. 7
Fig. 7
Tau-dependent synaptic and cognitive deficits in TgA53T mice are independent of expression or aggregate-specific changes in αS or key presynaptic proteins. a Representative western blot analysis of hippocampal lysates from 12-month-old mice. b Densitometry of hippocampal protein expression. For tau and total αS (full length), values were normalized to the average values for nTg samples within each gel. For truncated αS (αSΔC), human αS (HuSyn1), αS phosphorylated at Ser129 (pS129 αS), values were normalized to the average densitometric values of TgA53T samples within each gel. For western blot densitometry: one-way ANOVA with Tukey’s posthoc analysis. Total αS: F(3,20) = 252.4, p < 0.0001. αSΔC: F(3,20) = 335.9, p < 0.0001. HuSyn1: F(3,20) = 616.2, p < 0.0001. pS129 αS: F(3,20) = 88.70, p < 0.0001. While αS-associated protein levels are increased in TgA53T mice, the levels are not altered in TgA53T/mTau−/− mice. N = 6 animals/genotype. c Representative dot blots from non-denatured 12-month-old hippocampal lysates for the epitopes associated with total αS (4D6), human αS (LB509), and various pathological αS oligomers (Syn33, MJFR14). Dot blots for additional αS oligomers and pathological tau are shown in Suppl. Figure 5 (Online Resources). d Dot blot densitometry for levels of total αS (4D6) and human αS (LB509), normalized to actin levels. For higher order αS species, Syn33 and MJFR14, densitometry values were normalized to the average densitometric values of TgA53T samples within each gel. For all dot blot densitometry: one-way ANOVA with Tukey’s posthoc analysis. 4D6: F(3,23) = 232.9, p < 0.0001. LB509: F(3,23) = 68.53, p < 0.0001. Syn33: F(3,23) = 116.4, p < 0.0001. MJFR14: F(3,23) = 101.1, p < 0.0001. N = 8 animals/genotype. While αS and αS oligomer species levels are increased in TgA53T mice, they are unchanged by tau removal in TgA53T/mTau−/− mice. e Representative western blot images of presynaptic and postsynaptic proteins of interest in 12-month-old hippocampi. f Densitometry of hippocampal protein expression. Values were normalized to the average values for nTg samples within each gel. For western blot densitometry: one-way ANOVA with Tukey’s posthoc analysis. β-Synuclein: F(3,20) = 49.86, p < 0.0001. Synapsin Ia + b: F(3,20) = 8.501, p = 0.0008. Synapsin IIa + b. F(3,20) = 9.482, p = 0.0004. Synapsin IIIa: F(3,20) = 46.62, p < 0.0001. N = 6 animals/genotype. Densitometry shows that while β-synuclein and synapsin isoforms are decreased in TgA53T mice, they are not altered by loss of tau expression. Furthermore, the levels of synaptophysin and PSD95 are comparable in all animals, indicating a lack of synaptic loss. For all, values were normalized to the average densitometric values of nTg samples within each gel. One-way ANOVA: **p < 0.01 and ****p < 0.0001. ns not significant. Error bars represent mean ± SEM
Fig. 8
Fig. 8
Progressive loss of AMPA receptor subunits in the TgA53T is tau-dependent. Representative western blot images of hippocampal lysates of AMPA (GluA) and NMDA (GluN) receptor subunits at 3 (a), 6 (b), and 12 (c) months of age (3M, 6M, and 12M, respectively). d–g Densitometry of immunoblots for AMPA and NMDA receptor subunits at 3M, 6M, and 12M. For all, values were normalized to the average densitometric values of nTg samples within each gel. For 3M and 6M: unpaired t test with Welch’s correction. For 12M densitometry: one-way ANOVA with Tukey’s posthoc analysis. 12M GluN1: F(3,20) = 7.004, p = 0.0021. 6M GluA1: t = 3.773, df = 9.679, p = 0.0039. 12M GluA1: F(3,20) = 11.55, p = 0.0001. 6M GluA2/3: t = 3.801, df = 6.180, p = 0.0085. 12M GluA2/3: F(3,20) = 16.21, p < 0.0001. N = 6 animals/age/genotype. Compared to nTg mice, the NMDA receptor subunits are not decreased in TgA53T mice at all ages tested (d, e). However, AMPA receptor subunits are significantly decreased starting at 6M in TgA53T mice compared to nTg (f, g). Significantly, the loss of AMPA receptor subunits are reversed in TgA53T/mTau−/− animals (f, g). t test and one-way ANOVA: *p < 0.05, **p < 0.01, and ***p < 0.001. Error bars represent mean ± SEM
Fig. 9
Fig. 9
Progressive alterations in inhibitory circuits in the dentate gyrus of TgA53T mice is tau-dependent and correlate with the onset of synaptic and memory deficits. a Representative images from dentate gyri and hippocampi of 12-month-old (12M) nTg, TgA53T, TgA53T/mTau−/−, and mTau−/− mice. Similar images for 3-month-old (3M) and 6-month-old (6M) are shown in Supplementary Fig. 11 (Suppl. Figure 11, Online Resources). c-Fos scale bar 300 μm. NPY and calbindin scale bar 250 μm. Quantification of immunoreactivity (IR) via cell counting (b c-Fos) or densitometry (c NPY in the Molecular Layer “Molecular”; NPY in the Mossy Fiber pathway, “Mossy”, and d calbindin) at 3M, 6M, and 12M. 6M: c-Fos: U = 7, p = 0.0844; NPY-molecular: U = 10, p = 0.2403; NPY-Mossy: U = 11, p = 0.3905; Calbindin: U = 6, p = 0.0649. 12M: c-Fos: F(3,16)= 14.88, p < 0.0001; NPY-molecular: F(3,16) = 15.97, p < 0.0001; NPY-Mossy: F(3,16) = 19.77, p < 0.0001; Calbindin: F(3,16) = 19.03, p < 0.0001. 3M analysis: unpaired t test with Welch’s correction. 6M analysis: Mann–Whitney t test. 12M analysis: one-way ANOVA with Tukey’s posthoc analysis. N = 6 animals/age/genotype, n = 8 sections/animal. In 3M TgA53T mice, the levels of synaptic activity markers are comparable to nTg mice. In 6M TgA53T mice, two distinct populations of mice exist: TgA53T and TgA53TINT (analyzed in Suppl. Figure 11, Online Resources). All 12M TgA53T mice exhibit aberrant network remodeling which was reversed in TgA53T/mTau−/− mice. t test and one-way ANOVA: *p < 0.05, **p < 0.01, ***p < 0.001, and ****p < 0.0001. ns not significant, IR immunoreactivity, ML molecular layer, MF mossy fiber. Error bars represent mean ± SEM

References

    1. Aarsland D, Beyer MK, Kurz MW. Dementia in Parkinsonʼs disease. Curr Opin Neurol. 2008;21:676–682. doi: 10.1097/WCO.0b013e3283168df0. - DOI - PubMed
    1. Aarsland D, Creese B, Politis M, Chaudhuri KR, Ffytche DH, Weintraub D, et al. Cognitive decline in Parkinson disease. Nat Rev Neurol. 2017;13:217–231. doi: 10.1038/nrneurol.2017.27. - DOI - PMC - PubMed
    1. Abeliovich A, Schmitz Y, Fariñas I, Choi-Lundberg D, Ho W-H, Castillo PE, et al. Mice lacking α-synuclein display functional deficits in the nigrostriatal dopamine system. Neuron. 2000;25:239–252. doi: 10.1016/S0896-6273(00)80886-7. - DOI - PubMed
    1. Adamowicz DH, Roy S, Salmon DP, Galasko DR, Hansen LA, Masliah E, et al. Hippocampal α-synuclein in dementia with Lewy bodies contributes to memory impairment and is consistent with spread of pathology. J Neurosci. 2017;37:1675–1684. doi: 10.1523/JNEUROSCI.3047-16.2016. - DOI - PMC - PubMed
    1. Amar F, Sherman MA, Rush T, Larson M, Boyle G, Chang L, et al. Amyloid-β oligomer Aβ*56 induces specific alterations of tau phosphorylation and neuronal signaling. Sci Signal. 2017 doi: 10.1126/scisignal.aal2021. - DOI - PMC - PubMed

Publication types

MeSH terms