. 2019 Dec;76(23):4783-4794.
doi: 10.1007/s00018-019-03133-1. Epub 2019 Jun 5.

PGAM5 is a key driver of mitochondrial dysfunction in experimental lung fibrosis

Affiliations

PGAM5 is a key driver of mitochondrial dysfunction in experimental lung fibrosis

Ingo Ganzleben et al. Cell Mol Life Sci. 2019 Dec.

Abstract

Rationale: Mitochondrial homeostasis has recently emerged as a focal point in the pathophysiology of idiopathic pulmonary fibrosis (IPF), but conflicting data have been reported regarding its regulation. We speculated that phosphoglycerate mutase family member 5 (PGAM5), a mitochondrial protein at the intersection of multiple cell death and mitochondrial turnover pathways, might be involved in the pathogenesis of IPF.

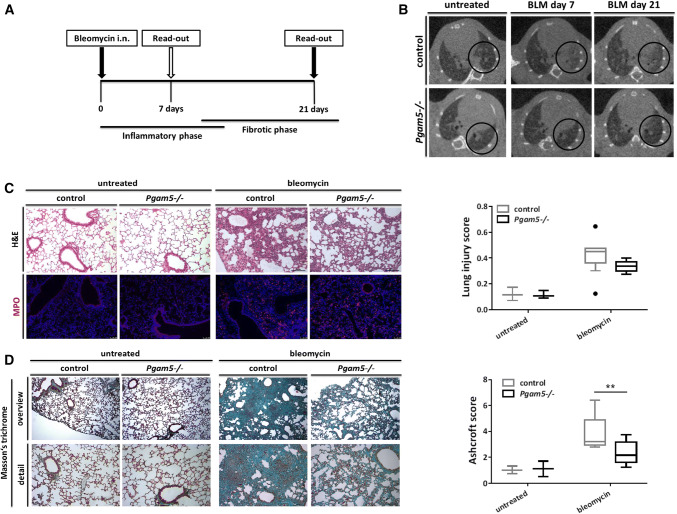
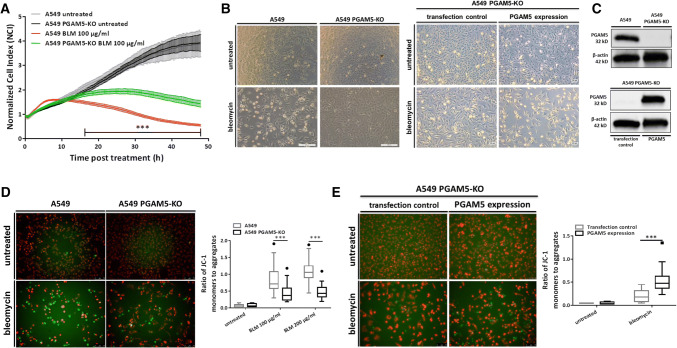
Methods: PGAM5-deficient mice and human pulmonary epithelial cells were analyzed comparatively with PGAM5-proficient controls in a bleomycin-based model of pulmonary fibrogenesis. Mitochondria were visualized by confocal and transmission electron microscopy. Mitochondrial homeostasis was assessed using JC1 (ΔΨ) and flow cytometry.

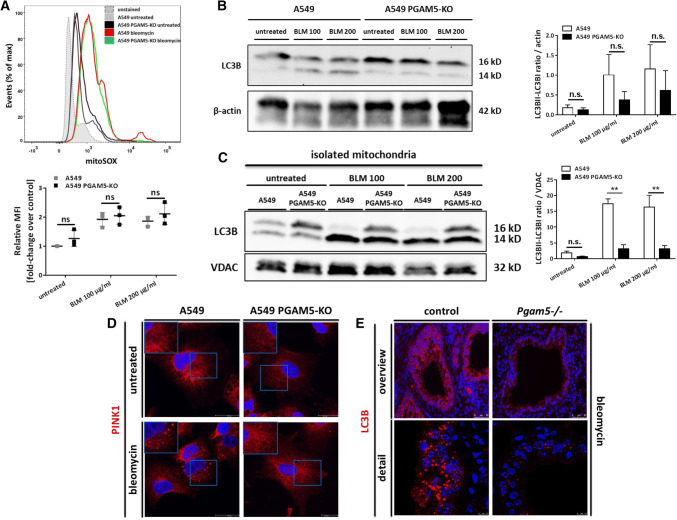
Results: PGAM5 plays an important role in pulmonary fibrogenesis. Pgam5-/- mice displayed significantly attenuated lung fibrosis compared to controls. Complementary, in vitro studies demonstrated that PGAM5 impaired mitochondrial integrity on a functional and structural level independently of mtROS-production. On a molecular level, reduced mitophagy caused by PGAM5 deficiency improved mitochondrial homeostasis.

Conclusions: Our study identifies PGAM5 as an important regulator of mitochondrial homeostasis in pulmonary fibrosis. Our data further indicate PGAM5-mediated mitophagy itself as a pivotal gateway event in the mediation of self-sustaining mitochondrial damage and membrane depolarization. Our work hereby highlights the importance of mitochondrial dynamics and identifies a potential therapeutic target that warrants further studies. Toxic agents lead to mitochondrial damage resulting in depolarization of the mitochondrial membrane potential (ΔΨ) which is a gateway event for the initiation of PGAM5-mediated mitophagy. PGAM5-mediated mitophagy in turn leads to a self-perpetuating escalation of ΔΨ depolarization. Loss of the mitophagy-based damage-enhancing loop under PGAM5-deficient conditions breaks this vicious cycle, leading to improved mitochondrial homeostasis.

Keywords: Bleomycin; IPF; Mitophagy.


Conflict of interest statement

We, the authors, have no conflicting financial interests.

Figures

Fig. 1
Fig. 1
PGAM5 is an important mediator of experimental pulmonary fibrosis in vivo. a–dPgam5/− and control mice were challenged with intranasal bleomycin and analyzed after 7 days (n = 12 Pgam5/− bleomycin; n = 12 controls bleomycin) and 21 days (n = 13 Pgam5/− bleomycin; n = 10 controls bleomycin). Each time point represents three independent experiments with similar results. Unchallenged mice (n = 3 Pgam5/−; n = 3 controls) served as reference for both time points. a Model of bleomycin-induced pulmonary inflammation and fibrosis. b CT of the lung with cross sections of comparable anatomical locations. Healthy lung tissue is black, and diseased lung tissue increasingly white (increased density). c Representative H&E and MPO immunofluorescence (IF) staining of lung tissue 7 days after bleomycin treatment. Bar 100 µm. Quantitative lung injury score as Tukey box plot. One-way ANOVA with Tukey’s test (p = 0.11). d Representative Masson’s trichrome staining (overview: bar 100 µm; detail: bar 200 µm) with quantitative histological fibrosis scoring (Ashcroft score) of lung tissue 21 days after bleomycin. Tukey box plot. One-way ANOVA with Tukey’s test (**p < 0.01 Pgam5/− bleomycin compared to control bleomycin)
Fig. 2
Fig. 2
PGAM5 drives bleomycin-induced cytotoxicity and mitochondrial dysfunction in human pulmonary epithelial cells. A549 (ad) and A549 PGAM5-KO (ae) cells were treated either with bleomycin 100 µg/ml (a, b, d, e) or bleomycin 200 µg/ml (d) and analyzed over the course of 48 h (a), respectively, after an interval of 48 h (b, d, e). Depictions are representative of three independent experiments with similar results. Untreated cells of each modality served as controls. (a) X-celligence. Normalized cell index (NCI) normalized to the time of bleomycin addition. Each curve represents multiple measurements (n = 4 for untreated, n = 6 for treated modalities). Two-way ANOVA with Tukey’s test (***p < 0.001 comparing bleomycin-treated A549 PGAM5-KO to bleomycin-treated A549). Displayed are mean and error ± SD. b Light microscopy. Left panel: A549 and A549 PGAM5-KO cells (bar 500 µm). Right panel: A549 PGAM5-KO cells either transfected with a transfection control or with a PGAM5 plasmid to induce PGAM5 expression (bar 100 µm). c PGAM5 deficiency (upper panel) and efficient vector-based PGAM5-expression in genetically deficient A549 PGAM5-KO cells (lower panel) was confirmed using immunoblotting. β-Actin served as loading control. d, e JC-1 experiments: healthy cells (intact ΔΨ) emit a red signal (JC-1 aggregates). Cells with depolarized ΔΨ emit a green signal (JC-1 monomers). An increased green-to-red-ratio indicates a higher percentage of depolarized cells. Graphs are Tukey box plots. d Representative JC-1 IF microscopy (bleomycin 100 µg/ml, bar 75 µm). Cumulative quantification: > 900 events per modality were assessed. Two-way ANOVA with Tukey’s test (***p < 0.001). e A549 PGAM5-KO cells were analyzed in comparison to A549 PGAM5-KO cells with vector-based PGAM5 expression (via transfected plasmid analogous to Fig. 2b and c) employing JC-1 IF microscopy. Representative JC-1 IF microscopy (upper panel: untreated, bar 50 µm; lower panel: bleomycin 100 µg/ml, bar 75 µm). Quantification: > 1500 events of each modality were assessed. Two-way ANOVA with Tukey’s test (***p < 0.001)
Fig. 3
Fig. 3
PGAM5 mediates structural damage of mitochondria in human pulmonary epithelial cells after bleomycin treatment. A549 and A549 PGAM5-KO cells were treated with bleomycin 100 µg/ml (a, c, d) or bleomycin 200 µg/ml (b, c, d) for 48 h unless stated otherwise. Depictions are representative of three independent experiments (a, c), one iteration per time point (b, 24 h results not shown) or one measurement series (d) with similar results. Nuclei were counterstained with Hoechst 33342. (ac) Confocal immunofluorescence images (a) PGAM5. Right column: overlay of fluorescence images with cell contour outlines based on bright-field overlay (bar 20 µm; bright field not shown). (b) PGAM5 and TOMM20 co-localization (bar 10 µm). (c) TOMM20 visualization. Representative images of TOMM20 staining (bleomycin 100 µg/ml; 24 h, 48 h; bar 20 µm). Quantification (after 48 h): > 140 cells per modality were assessed. Tukey box plot. Two-way ANOVA with Tukey’s test (*p < 0.05/***p < 0.001). d Independent TEM images. Overview (upper panel): arrowheads mark different mitochondrial subtypes: elongated/branched (green) and swollen (red). Details (lower panel): red arrows mark mitochondrial membrane alterations
Fig. 4
Fig. 4
PGAM5 disrupts mitochondrial function by mediating downstream mitophagy independently of mtROS levels. A549 and A549 PGAM5-KO cells (ad) were treated with bleomycin 100 µg/ml (ad) or bleomycin 200 µg/ml (ac) and analyzed after 24 h. All results are representative of three independent experiments with similar results. Nuclei were counterstained with Hoechst 33342. a Mitochondrial ROS (mtROS) were measured by mitoSOX flow cytometry. Histogram: x-axis displays fluorescence signal intensity; y-axis displays events as percentage of the maximum. Graph: aligned dot plot with mean ± SD of relative mean fluorescence intensity (MFI). Two-way ANOVA (ns p ≥ 0.05). Statistical analysis is cumulative. b Western blot from whole cell lysate with immunoblotting of LC3B. β-Actin served as loading control. Bar chart with mean and SEM displays the pooled densitometry results of the LC3BII–LC3BI ratio (lower and upper band, respectively) after normalization to β-actin [for each genotype (A549/A549 PGAM5-KO): n = 2 “untreated”; n = 3 “BLM 100 µg/ml”; n = 2 “BLM 200 µg/ml”]. Two-way ANOVA (ns p ≥ 0.05). Statistical analysis is cumulative. c Western blot from isolated mitochondria with immunoblotting of LC3B. VDAC served as loading control. Bar chart with mean and SEM displays the pooled densitometry results of the LC3BII–LC3BI ratio (lower and upper band, respectively) after normalization to VDAC [for each genotype (A549/A549 PGAM5-KO): n = 2 “untreated”; n = 3 “BLM 100 µg/ml”; n = 3 “BLM 200 µg/ml”]. Two-way ANOVA with Tukey’s test (ns p ≥ 0.05/**p < 0.01). Statistical analysis is cumulative. d Confocal immunofluorescence images of PINK1 (bar 20 µm). e Immunofluorescence images of LC3B on murine lung sections of mice sacrificed 7 days after bleomycin challenge (same cohort as Fig. 1c). Scale bar 50 µm (upper panel, microscopy), scale bar 7.5 µm (lower panel, confocal microscopy)

References

    1. King TE, Jr, Tooze JA, Schwarz MI, Brown KR, Cherniack RM. Predicting survival in idiopathic pulmonary fibrosis: scoring system and survival model. Am J Respir Crit Care Med. 2001;164:1171–1181. doi: 10.1164/ajrccm.164.7.2003140. - DOI - PubMed
    1. Aggarwal S, Mannam P, Zhang J. Differential regulation of autophagy and mitophagy in pulmonary diseases. Am J Physiol Lung Cell Mol Physio. 2016;311:L433–452. doi: 10.1152/ajplung.00128.2016. - DOI - PMC - PubMed
    1. Ryter SW, Choi AM. Autophagy in lung disease pathogenesis and therapeutics. Redox Biol. 2015;4:215–225. doi: 10.1016/j.redox.2014.12.010. - DOI - PMC - PubMed
    1. Choi AM, Ryter SW, Levine B. Autophagy in human health and disease. N Engl J Med. 2013;368:651–662. doi: 10.1056/NEJMra1205406. - DOI - PubMed
    1. Mizumura K, et al. Mitophagy-dependent necroptosis contributes to the pathogenesis of COPD. J Clin Investig. 2014;124:3987–4003. doi: 10.1172/JCI74985. - DOI - PMC - PubMed

MeSH terms