Review
. 2019 Aug;31(33):e1901071.
doi: 10.1002/adma.201901071. Epub 2019 Jun 6.

Advances in Biomaterials and Technologies for Vascular Embolization

Affiliations
Review

Advances in Biomaterials and Technologies for Vascular Embolization

Jingjie Hu et al. Adv Mater. 2019 Aug.

Abstract

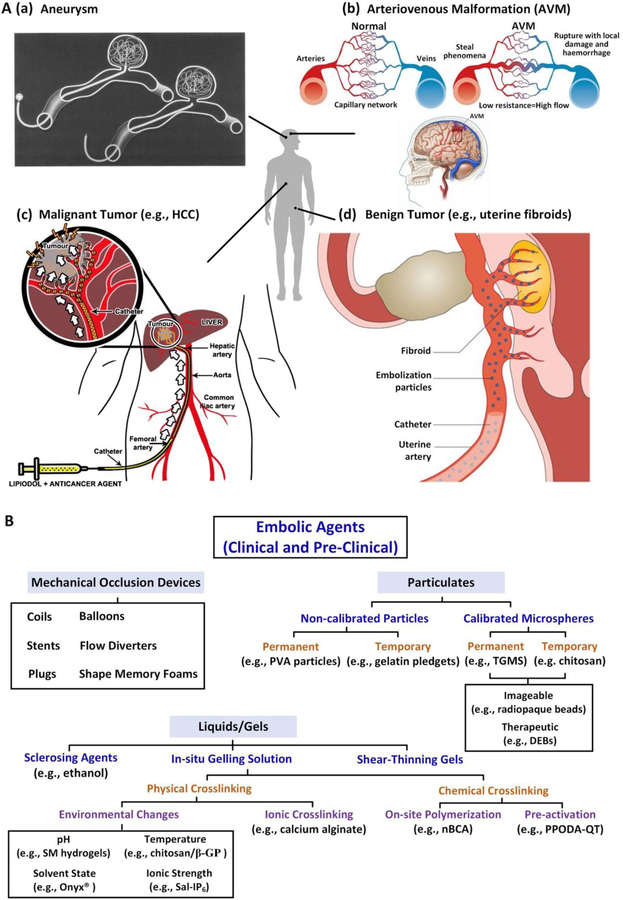
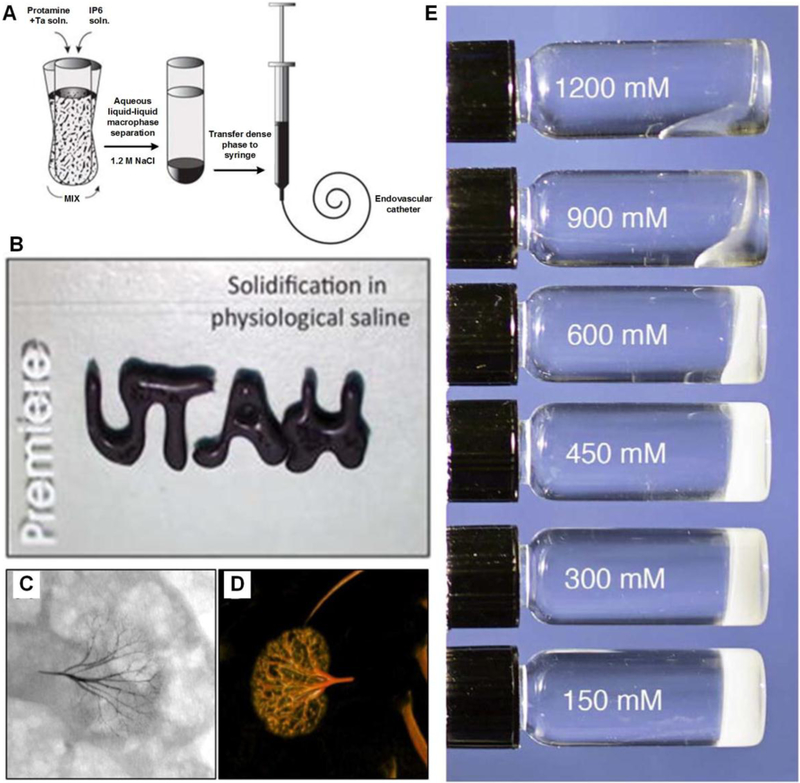
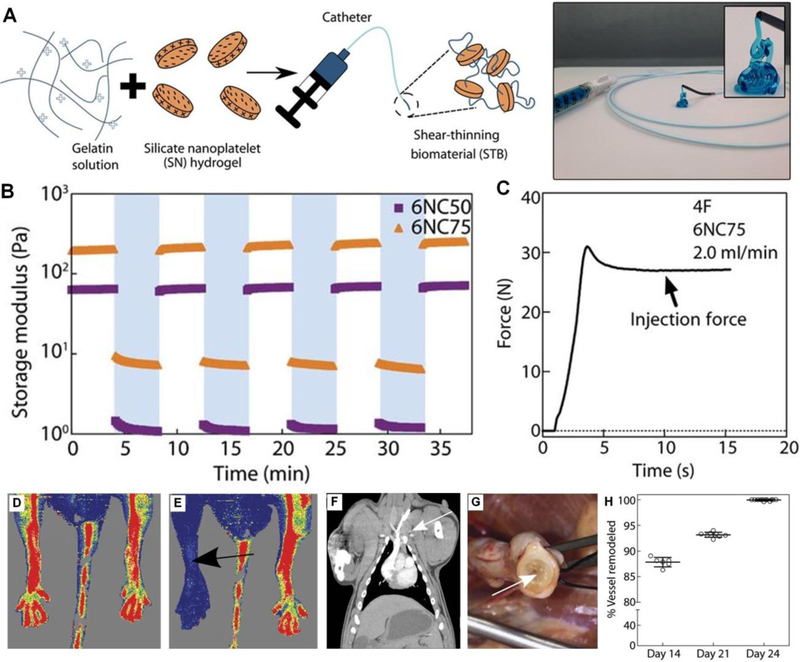
Minimally invasive transcatheter embolization is a common nonsurgical procedure in interventional radiology used for the deliberate occlusion of blood vessels for the treatment of diseased or injured vasculature. A wide variety of embolic agents including metallic coils, calibrated microspheres, and liquids are available for clinical practice. Additionally, advances in biomaterials, such as shape-memory foams, biodegradable polymers, and in situ gelling solutions have led to the development of novel preclinical embolic agents. The aim here is to provide a comprehensive overview of current and emerging technologies in endovascular embolization with respect to devices, materials, mechanisms, and design guidelines. Limitations and challenges in embolic materials are also discussed to promote advancement in the field.

Keywords: catheter-based delivery; embolic agents; interventional radiology; minimally invasive surgery; vascular embolization.


Conflict of interest statement

Conflict of Interest

RO and AK have recently launched a joint start-up Obsidio, Inc. in the field of vascular embolization.

Figures

Figure 1.
Figure 1.
A) Schematic demonstrating embolization of (a) aneurysms; (b) AVMs; (c)malignant tumors (e.g., hepatocellular carcinoma, HCC) and (d) benign tumors (e.g., uterine fibroids). Figure components adapted and reproduced with permission.[12] Copyright 2000, Elsevier; 2014, BMJ Publishing Group Ltd.; 2015 Springer Nature; 2013, Elsevier; and 2016, Springer Nature. B) Summary of clinical and pre-clinical embolic agents. PVA: polyvinyl alcohol; TGMS: trisacryl gelatin microspheres; DEB: drug eluting bead; SM: sulfamethzaine; β-GP: β-glycerophosphate; Sal: polycationic salmine sulfate; IP6: polyanionic sodium inositol hexaphosphate; nBCA: N-bnutyl-2-cyanoacrylate; PPODA: poly(propylene glycol) diacrylate; QT: pentaerythritol tetrakis 3-mercaptopropionate.
Figure 2.
Figure 2.
(A-E) Catheter-based endovascular approaches to the treatment of cancer (A-E and F-G) and benign conditions (H-J and K-N). A) Digital subtraction angiography (DSA) from a catheter inside the celiac artery shows a liver tumor blush in the liver (black arrow). B) The same lesion is demonstrated in a contrast enhanced liver MRI measuring more than 6 cm in diameter. C) Following high dose segmentectomy radioembolization, the lesion is completely ablated allowing the patient to receive potentially curative surgical resection in D) with a 6 month follow-up CT imaging E) showing absence of any malignancy. F) and G) demonstrates MRI images before and after TACE embolization of a 4 cm liver tumor; white arrow in G) shows complete ablation of tumor. H) DSA from the prostate artery in a patient benign prostatic hyperplasia (BPH); corresponding Dyna-CT at the time of procedure is shown in I) Using particulate embolization, this prostate artery was completely blocked in J) (white arrow). (K-N) demonstrates particulate embolization of fibroids in uterus K). DSA of the uterine artery in L) and M) demonstrates the large fibroids; these were successfully embolized and follow-up MRI in N) shows successful treatment of the fibroids.
Figure 3.
Figure 3.
Illustrations of A) a AZUR® framing coil (coil OD of 0.014–0.015 inches or 0.022 inches); B) a polymer-fibered (either PLGA or nylon) Concerto™ 3D detachable coil system (available diameter ranging between 2mm and 18 mm with length spanning from 2 cm to 40 cm); C) a polymer-fibered (either PLGA or nylon) Concerto™ HELIX detachable coil system (available diameter ranging between 2mm and 20 mm with length spanning from 4 cm to 50 cm); and D) a AZUR® HydroCoil, which combined a platinum coil and an expandable hydrogel polymer (pre expansion coil OD at 0.014–0.017 inch (or 0.024–0.030 inch) and post expansion OD of 0.034 inch (or 0.048 inch)) (Courtesy of Terumo and Medtronic). OD represents outer diameter.
Figure 4.
Figure 4.
A) Box plots of Young’s modulus of coil-clot complex. SEM images of B) HydroCoil–clot complex and C) bare platinum coil–clot complex, Figure components adapted and reproduced with permission.[107] Copyright 2014, BMJ Publishing Group Ltd..
Figure 5.
Figure 5.
A) Schematic fabrication process of radiopaque hydrogel coils. B) The temperature triggered response of shape memory hydrogel coil. C) The shape memory induced embolism by the hydrogel coil assessed at 37 °C. D) Schematic of the transarterial embolization process. E) Angiograms of radiopaque coil delivery (yellow dots outlined contour of delivered hydrogel coils) into the renal artery. F) Angiographic images obtained at 4, 8, and 12 weeks after embolization with red circles denotes microcoil position. G) Gross appearance of the embolized and normal kidneys at 4, 8, and 12 weeks, respectively, after procedure. (Scale bars: 2 cm). Figure components adapted and reproduced with permission.[118] Copyright 2018, John Wiley & Sons Inc..
Figure 6.
Figure 6.
SMP device A) before and B) after expansion. C) Schematics demonstrating temporary shape of SMP foam device for catheter delivery into aneurysm, intermediate stage of SMP during expansion and fully recovered foam for aneurysm filling. D) Histology of SPM samples perfused with blood in vitro, with perfusion time of 30 seconds in a-c and 270 seconds in d-f. Samples a&d, b&e, and c&f represent proximal, middle and distal regimes, respectively. Pinkish red stained for erythrocytes and purple stained for fibrin and leukocytes. E) Gross examination of the implanted SMP foams in vein pouch aneurysm model thirty-minute, thirty-day and ninety-day after embolization, respectively. Figure components adapted and reproduced with permission.[128, 139] Copyright 2016, Elsevier and 2013, John Wiley & Sons, Inc.
Figure 7.
Figure 7.
A) (a) 2,4,5 triiodinated benzyl nucleus in commercial contrast media; (b)-(d) examples of iodinated vinylic monomers used for microsphere synthesis; and (e) 2,3,5, triiodinated compound for conjugation. B) (a) Schematics of microfluidics technique to fabricate alginate microspheres with in situ synthesized BaSO4 nanoparticles; (b) optical image of hydrated BaSO4/ALG microsphere and SEM image of a dried particle; and (c) BaSO4/ALG microsphere solution. C) Digital radiography of tantalum nanoparticle loaded calcium alginate particle (a-e) and blank calcium alginate particle (f-j) immediately, 1 week, 2 weeks, 3 weeks and 4 weeks of rabbit kidney after embolization. Figure components adapted and reproduced with permission.[193, 199, 202] Copyright 2016, Elsevier; 2015, American Chemical Society and 2018 Ivyspring International Publisher.
Figure 8.
Figure 8.
Schematics of A) arterial blood supply to HCC and B) mechanisms of bland embolization, conventional chemoembolization, DEB chemoembolization, and radioembolization. Pharmacokinetic assay measured during 7 days in patients treated with DEB-TACE and conventional TACE. Doxorubicin level in serum at different time points posted C) DEB-TACE treatment, and D) conventional TACE procedure. Figure components adapted and reproduced with permission.[205, 208] Copyright 2013, Elsevier and 2007, Elsevier.
Figure 9.
Figure 9.
T2-weighted MRI A) pre- and B) post- transcatheter intra-arterial infusion of nanocomposite microspheres consisting of gold nanorods and iron oxide coatings in a rat HCC model (yellow circle indicates tumor location), showing enhanced tumor edge contrast. C) contrast to noise ratio (CNR) of tumor margin before and after microspheres embolization. D) Whole body coronal CT (left panel) and three dimensional maximum intensity projection (right panel) image after nanocomposite microspheres embolization, with circles highlighting regions with enriched signal. Figure components adapted and reproduced with permission.[207c] Copyright 2016, Nature Publishing Group.
Figure 10.
Figure 10.
A) MicroCT of normal porcine liver embolized with small and large DEBs. Doxorubicin concentration and penetration depth from the bead surface of B) small (70–150 μm) and C) large (100–300 μm) radiopaque DEBs in porcine liver over one week. Figure components adapted and reproduced with permission.[236c] Copyright 2012, Elsevier.
Figure 11.
Figure 11.
A) Doxorubicin distribution around and away from the bead and B) doxorubicin concentration in patient liver explants at 8 hours, 9–14 days, and 32–36 days after embolization. C) Distribution of beads in peritumoral and intratumoral regimes in the patient transplanted at 8 hours. Figure components adapted and reproduced with permission.[237a] Copyright 2011, Elsevier.
Figure 12.
Figure 12.
Comparison between thrombin-loaded and non-thrombin coupled iodinated acrylic microspheres in platelet rich plasma at various time points. Thrombin-loaded microspheres aggregate within 30 seconds while control particles (without thrombin) do not show obvious aggregation after 20 minutes. Figure components adapted and reproduce with permission.[157a] Copyright 2007, Elsevier.
Figure 13.
Figure 13.
A) Compression testing on single TG-ms microsphere; Summary of B) modulus and C) relaxation half time of the TG-ms, APVA-ms, and PP-PMMA-ms obtained by compressing a monolayer of microspheres immersed in physiological saline. Figure components adapted and reproduced with permission.[224, 250] Copyright 2010, Elsevier and 2011, Elsevier.
Figure 14.
Figure 14.
A) Alginate structure and reaction mechanism with divalent calcium ions, transitioning from liquid to solid gel states. B) Strength and polymer yield percentage of the four alginates, with different compositions, at 40% and 60% compression levels. C) Concentration dependent viscosity of four types of alginate (at room temp. 28°C) versus alginate concentration. D) Flow rates at different catheter diameters for non-Newtonian alginate and Newtonian glycerin solution with similar initial viscosities, injected at a maximum pressure of 2100 kPa. The shear-thinning properties allow alginate flow at wider ranges compared to Newtonian fluid with same viscosity. Figure components adapted and reproduced with permission.[258] Copyright 2000, John Wiley & Sons Inc.
Figure 15.
Figure 15.
Sol-gel transition behavior of temperature sensitive PIB-I-6150 A) phase diagram and B) storage modulus, loss modulus and loss tangent. C) Digital subtraction angiography (DSA) images of VX2 rabbit tumor embolization. (a-c) are DSA images of PIB-I-6150 treated group before embolization, 7 and 14 days post embolization, respectively. (d-f) are DSA images of Lipiodol treated group before embolization, 7 and 14 days post embolization, respectively. D) Schematics of Ivalon, Lipiodol and PIB-I-6150 embolization. Figure components adapted and reproduced with permission.[265] Copyright 2011, Jon Wiley & Sons Inc..
Figure 16.
Figure 16.
A) Schematics of drug loaded SELP liquid embolic agent. B) Illustration of SELP-815 K structure. In vitro drug release profiles from 12% SELP-815 K loaded with doxorubicin and sorafenib powders. Relative release rates of C) Doxorubicin and D) Sorafenib from single drug loaded gels (either 25 mg/mL or 50 mg/mL) or from dual drug loaded gel at 25 mg/mL loading (per drug). Statistical significance between single drug loaded versus dual drug loaded gels (*); single drug loaded 25 mg/mL versus single drug loaded 50 mg/mL gels (+);single drug loaded 50 mg/mL gels and the dual drug loaded gels (•). Statistical significance is reported as p < 0.05, highly significant as p < 0.01 and very highly significant as p < 0.001. Figure components adapted and reproduced with permission.[271, 272b] Copyright 2016, American Chemical Society and 2015, Elsevier.
Figure 17.
Figure 17.
A) Illustration of fabrication process of injectable radiopaque Sal-IP6 embolic coacervate. B) The fluid rapidly solidifies into a stable gel under physiological saline. C) Fluoroscope image and D) Post-mortem dorsal three dimensional image of a rabbit kidney 90 min after arterial embolization with Sal-IP6. E) Morphological changes of Sal-IP6 as a function of NaCl concentration. Figure components adapted and reproduced with permission.[285] Copyright 2016, John Wiley & Sons Inc..
Figure 18.
Figure 18.
A) Schematic illustration of STB fabrication. STB is extruded from the catheter tip. B) Storage moduli (G′) of 6% (w/v) STBs after repeated cycles of low and high strain. C) A representative injection force curve to deliver STB through the catheter. Laser Doppler microperfusion imaging in mouse showing D) hindlimb perfusion before STB injection and E) no perfusion in STB injected limb. F) Coronal CT study confirmed no pulmonary embolism occurred in porcine model during 24 days after STB embolization. G) Gross evaluation at 24 days shows STB (arrow) occluding the vein. H) Percentage of vessel remodeling (replacement of STB with connective tissue) over time. Figure components adapted and reproduced with permission.[10] Copyright 2016, The American Association for the Advancement of Science.

References

    1. Sheth RA, Sabir S, Krishnamurthy S, Avery RK, Zhang YS, Khademhosseini A, Oklu R, J. Funct. Biomater 2017, 8. - PMC - PubMed
    1. Leyon JJ, Littlehales T, Rangarajan B, Hoey ET, Ganeshan A, Curr. Probl. Diagn. Radiol 2014, 43, 35. - PubMed
    1. Transcatheter Embolization and Therapy 2010, 1;
    2. Behravesh S, Yakes W, Gupta N, Naidu S, Chong BW, Khademhosseini A, Oklu R, Cardiovascular Diagnosis and Therapy 2016, 6, 557; - PMC - PubMed
    3. Gunn AJ, Oklu R, J. Obes 2014, 2014, 4. - PMC - PubMed
    1. Interventional Radiology, Williams and Wilkins, Baltimore: 1997;
    2. Luessenhop AJ, Spence WT, JAMA, J. Am. Med. Assoc 1960, 172, 1153; - PubMed
    3. Dawbarn RHM, J. Am. Med. Assoc 1904, 43, 0792.
    1. Brooks B, South. Med. J 1930, 23, 100.

LinkOut - more resources