

Frontline Science: Endotoxin-induced immunotolerance is associated with loss of monocyte metabolic plasticity and reduction of oxidative burst
- PMID: 31169935
- PMCID: PMC6852552
- DOI: 10.1002/JLB.5HI0119-018R
Frontline Science: Endotoxin-induced immunotolerance is associated with loss of monocyte metabolic plasticity and reduction of oxidative burst
Abstract
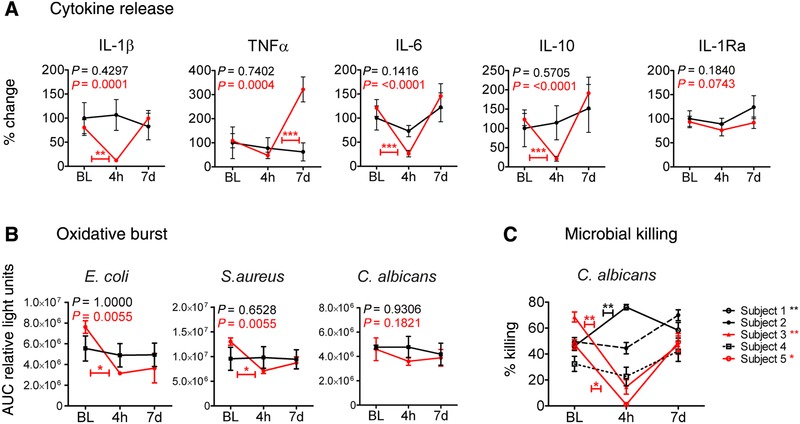
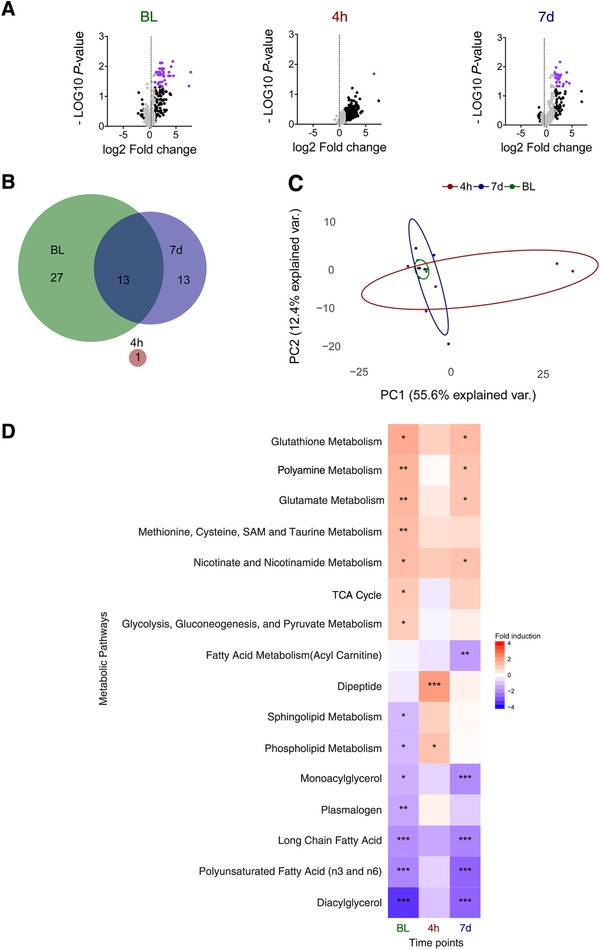
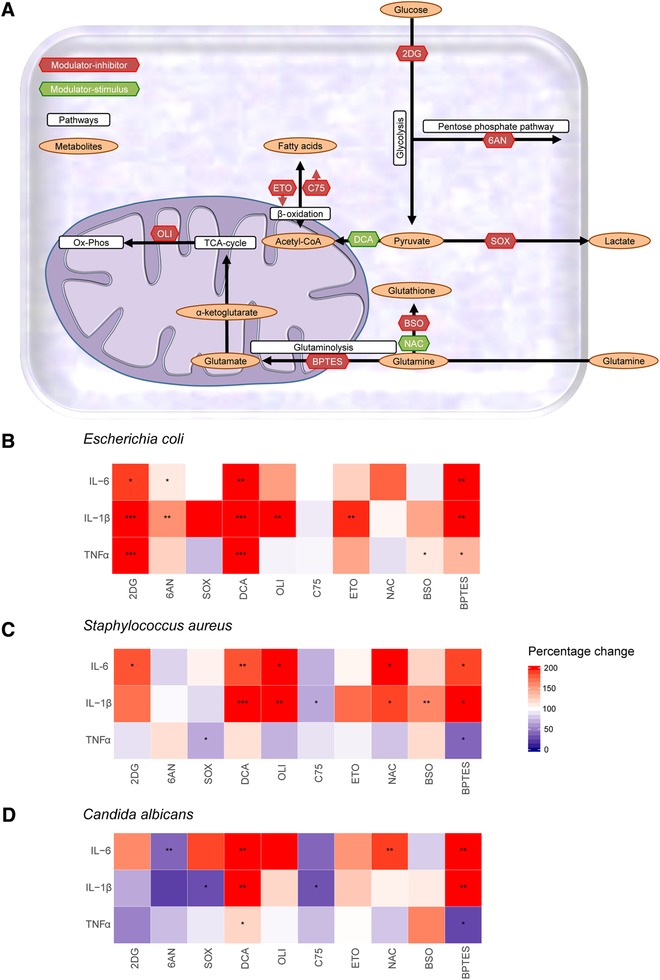
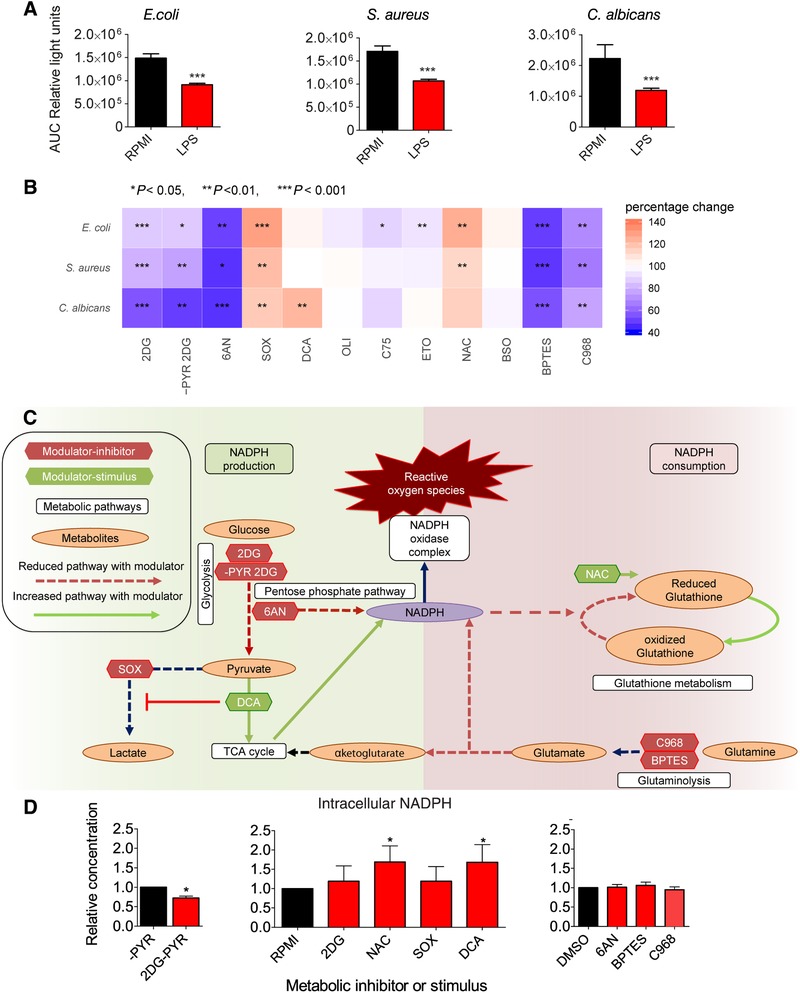
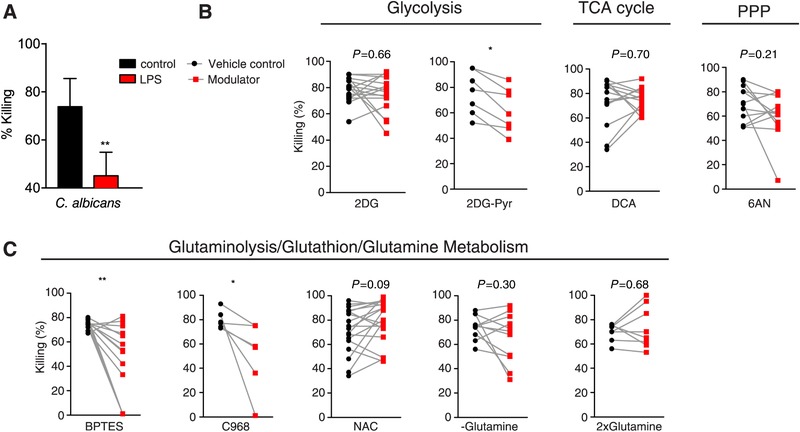
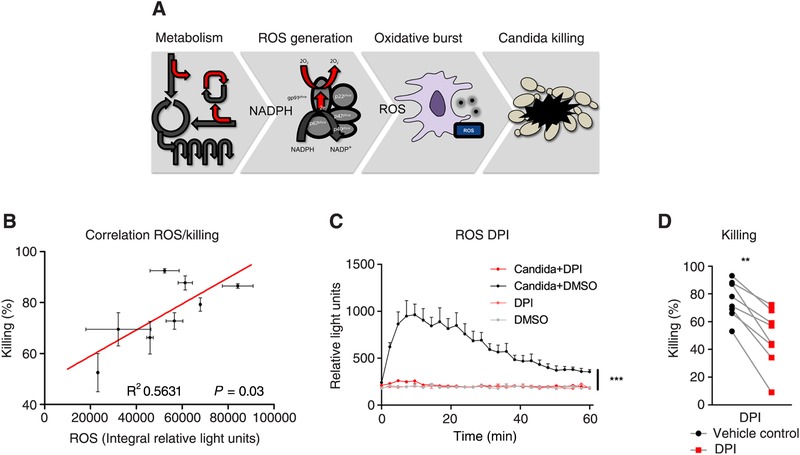
Secondary infections are a major complication of sepsis and associated with a compromised immune state, called sepsis-induced immunoparalysis. Molecular mechanisms causing immunoparalysis remain unclear; however, changes in cellular metabolism of leukocytes have been linked to immunoparalysis. We investigated the relation of metabolic changes to antimicrobial monocyte functions in endotoxin-induced immunotolerance, as a model for sepsis-induced immunoparalysis. In this study, immunotolerance was induced in healthy males by intravenous endotoxin (2 ng/kg, derived from Escherichia coli O:113) administration. Before and after induction of immunotolerance, circulating CD14+ monocytes were isolated and assessed for antimicrobial functions, including cytokine production, oxidative burst, and microbial (Candida albicans) killing capacity, as well metabolic responses to ex vivo stimulation. Next, the effects of altered cellular metabolism on monocyte functions were validated in vitro. Ex vivo lipopolysaccharide stimulation induced an extensive rewiring of metabolism in naive monocytes. In contrast, endotoxin-induced immunotolerant monocytes showed no metabolic plasticity, as they were unable to adapt their metabolism or mount cytokine and oxidative responses. Validation experiments showed that modulation of metabolic pathways, affected by immunotolerance, influenced monocyte cytokine production, oxidative burst, and microbial (C. albicans) killing in naive monocytes. Collectively, these data demonstrate that immunotolerant monocytes are characterized by a loss of metabolic plasticity and these metabolic defects impact antimicrobial monocyte immune functions. Further, these findings support that the changed cellular metabolism of immunotolerant monocytes might reveal novel therapeutic targets to reverse sepsis-induced immunoparalysis.
Keywords: endotoxemia; endotoxin tolerance; immunometabolism; immunoparalysis; monocytes; sepsis.
©2019 The Authors. Society for Leukocyte Biology Published by Wiley Periodicals, Inc.
Conflict of interest statement
The authors declare no conflicts of interest.
Figures
Comment in
-
Loss of monocyte metabolic plasticity in endotoxin tolerance: A model for understanding sepsis-induced immune paralysis?J Leukoc Biol. 2019 Jul;106(1):7-9. doi: 10.1002/JLB.4CE0319-100R. Epub 2019 May 14. J Leukoc Biol. 2019. PMID: 31087702 Free PMC article.
Similar articles
-
Broad defects in the energy metabolism of leukocytes underlie immunoparalysis in sepsis.Nat Immunol. 2016 Apr;17(4):406-13. doi: 10.1038/ni.3398. Epub 2016 Mar 7. Nat Immunol. 2016. PMID: 26950237
-
Comparison of monocyte functions after LPS- or IL-10-induced reorientation: importance in clinical immunoparalysis.Pathobiology. 1999;67(5-6):253-6. doi: 10.1159/000028104. Pathobiology. 1999. PMID: 10725796
-
Dexamethasone, colchicine and iodine-lithium-alpha-dextrin act differentially on the oxidative burst and endotoxin tolerance induction in vitro in patients with Behçet's disease.Int Immunopharmacol. 2006 Mar;6(3):396-407. doi: 10.1016/j.intimp.2005.09.003. Epub 2005 Oct 7. Int Immunopharmacol. 2006. PMID: 16428075
-
The Significance and Challenges of Monocyte Impairment: For the Ill Patient and the Surgeon.Surg Infect (Larchmt). 2016 Jun;17(3):303-12. doi: 10.1089/sur.2015.245. Epub 2016 Mar 9. Surg Infect (Larchmt). 2016. PMID: 26958709 Review.
-
The Metabolic Basis of Immune Dysfunction Following Sepsis and Trauma.Front Immunol. 2020 May 29;11:1043. doi: 10.3389/fimmu.2020.01043. eCollection 2020. Front Immunol. 2020. PMID: 32547553 Free PMC article. Review.
Cited by
-
Monocyte subset distribution and surface expression of HLA-DR and CD14 in patients after cardiopulmonary resuscitation.Sci Rep. 2021 Jun 11;11(1):12403. doi: 10.1038/s41598-021-91948-z. Sci Rep. 2021. PMID: 34117334 Free PMC article.
-
Functional and genomic adaptations of blood monocytes to pregravid obesity during pregnancy.iScience. 2021 Jun 4;24(6):102690. doi: 10.1016/j.isci.2021.102690. eCollection 2021 Jun 25. iScience. 2021. PMID: 34195568 Free PMC article.
-
Participation of Monocyte Subpopulations in Progression of Experimental Endotoxemia (EE) and Systemic Inflammation.J Immunol Res. 2021 Feb 12;2021:1762584. doi: 10.1155/2021/1762584. eCollection 2021. J Immunol Res. 2021. PMID: 33628841 Free PMC article. Review.
-
The cellular basis of organ failure in sepsis-signaling during damage and repair processes.Med Klin Intensivmed Notfmed. 2020 May;115(Suppl 1):4-9. doi: 10.1007/s00063-020-00673-4. Epub 2020 Mar 31. Med Klin Intensivmed Notfmed. 2020. PMID: 32236799 Free PMC article. Review.
-
The epigenetic regulator G9a attenuates stress-induced resistance and metabolic transcriptional programs across different stressors and species.BMC Biol. 2021 May 24;19(1):112. doi: 10.1186/s12915-021-01025-0. BMC Biol. 2021. PMID: 34030685 Free PMC article.
References
-
- Angus DC, van der Poll T. Severe sepsis and septic shock. N Engl J Med. 2013;369(9):840‐851. - PubMed
-
- Leentjens J, Kox M, van der Hoeven JG, Netea MG, Pickkers P. Immunotherapy for the adjunctive treatment of sepsis: from immunosuppression to immunostimulation. Time for a paradigm change? Am J Respir Crit Care Med. 2013;187(12):1287‐1293. - PubMed
-
- Torgersen C, Moser P, Luckner G, et al. Macroscopic postmortem findings in 235 surgical intensive care patients with sepsis. Anesth Analg. 2009;108(6):1841‐1847. - PubMed
Publication types
MeSH terms
Substances
LinkOut - more resources
Full Text Sources
Research Materials
