. 2019 Jun;127(6):67006.
doi: 10.1289/EHP4093. Epub 2019 Jun 6.

Tap Water Contributions to Plasma Concentrations of Poly- and Perfluoroalkyl Substances (PFAS) in a Nationwide Prospective Cohort of U.S. Women

Affiliations

Tap Water Contributions to Plasma Concentrations of Poly- and Perfluoroalkyl Substances (PFAS) in a Nationwide Prospective Cohort of U.S. Women

Xindi C Hu et al. Environ Health Perspect. 2019 Jun.

Abstract

Background: Between 2013 and 2015, concentrations of poly- and perfluoroalkyl substances (PFAS) in public drinking water supplies serving at least six million individuals exceeded the level set forth in the health advisory established by the U.S. Environmental Protection Agency. Other than data reported for contaminated sites, no systematic or prospective data exist on the relative source contribution (RSC) of drinking water to human PFAS exposures.

Objectives: This study estimates the RSC of tap water to overall PFAS exposure among members of the general U.S.

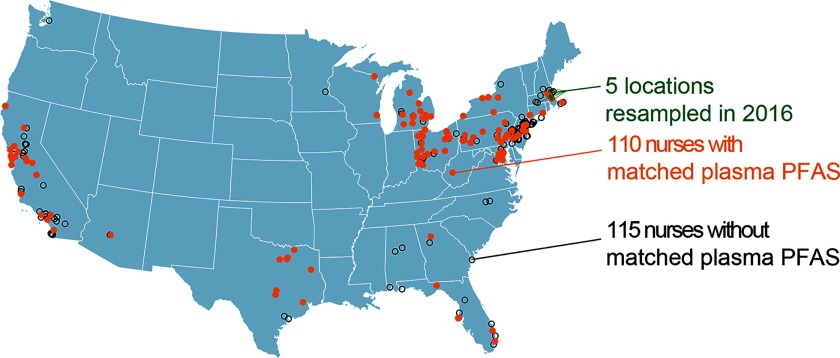
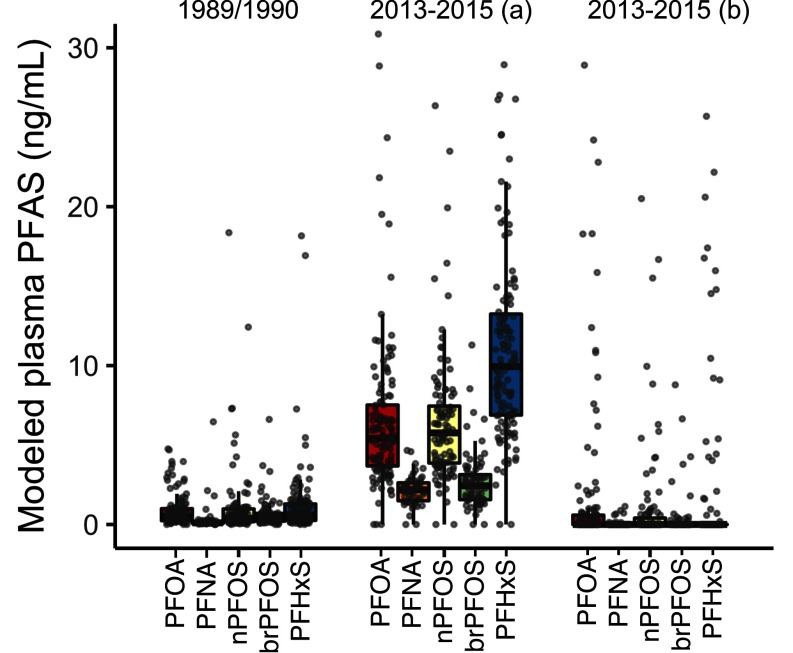
Methods: We measured concentrations of 15 PFAS in home tap water samples collected in 1989-1990 from 225 participants in a nationwide prospective cohort of U.S. women: the Nurses' Health Study (NHS). We used a one-compartment toxicokinetic model to estimate plasma concentrations corresponding to tap water intake of PFAS. We compared modeled results with measured plasma PFAS concentrations among a subset of 110 NHS participants.

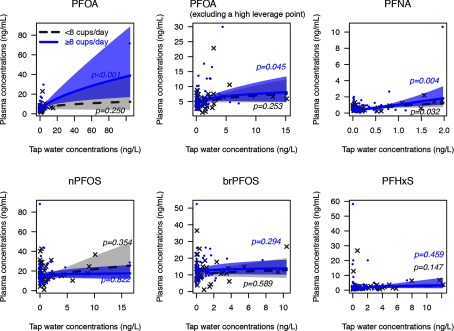
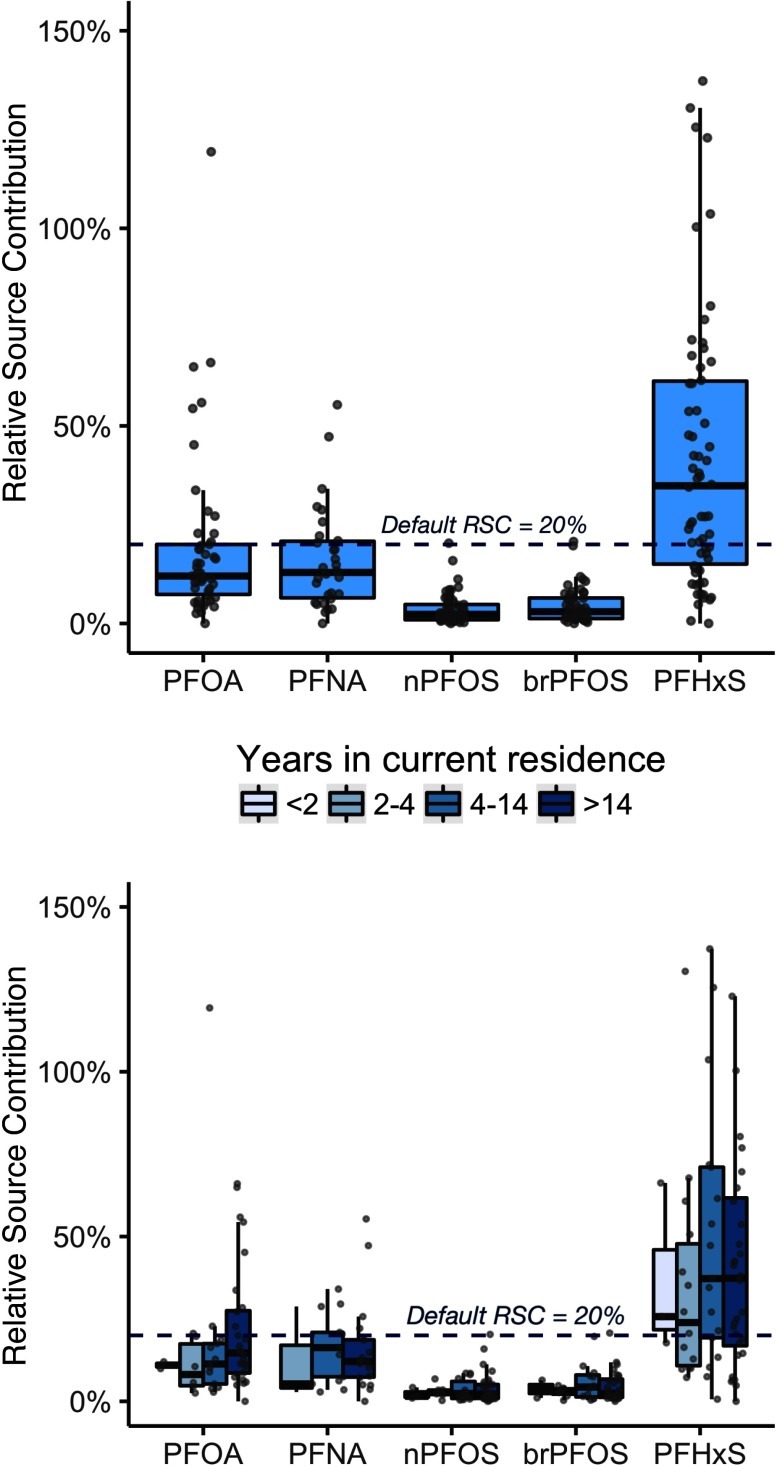
Results: Tap water perfluorooctanoic acid (PFOA) and perfluorononanoic acid (PFNA) were statistically significant predictors of plasma concentrations among individuals who consumed [Formula: see text] cups of tap water per day. Modeled median contributions of tap water to measured plasma concentrations were: PFOA 12% (95% probability interval 11%-14%), PFNA 13% (8.7%-21%), linear perfluorooctanesulfonic acid (nPFOS) 2.2% (2.0%-2.5%), branched perfluorooctanesulfonic acid (brPFOS) 3.0% (2.5%-3.2%), and perfluorohexanesulfonic acid (PFHxS) 34% (29%-39%). In five locations, comparisons of PFASs in community tap water collected in the period 2013-2016 with samples from 1989-1990 indicated increases in quantifiable PFAS and extractable organic fluorine (a proxy for unquantified PFAS).

Conclusions: Our results for 1989-1990 compare well with the default RSC of 20% used in risk assessments for legacy PFAS by many agencies. Future evaluation of drinking water exposures should incorporate emerging PFAS. https://doi.org/10.1289/EHP4093.


Figures

A map of USA marks 5 locations resampled in 2016, 110 nurses with matched plasma PFASs, and 115 nurses without matched plasma PFASs.
Figure 1.
Locations of 225 home tap water samples obtained in 1989–1990.
Figure 2 shows six graphs plotting plasma concentrations in tap water for both participants consuming less than 8 cups of tap water per day and more than 8 cups of tap water per day, using PFOA, PFOA excluding a high leverage point, PFNA, nPFOS, brPFOS, and PFHxS (ranging from 0 to 80 nanograms per milliliter in increments of 20; from 5 to 30 in increments of 5; from 0 to 10 in increments of 2, from 0 to 80 in increments of 20, from 0 to 50 in increments of 10, and from 0 to 60 in increments of 10) (y-axis), respectively, across tap water concentrations (ranging from 0 to 80 nanograms per liter in increments of 20; from 0 to 15 in increments of 5; from 0.0 to 2.0 in increments of 0.5; from 0 to 15 in increments of 5; from 0 to 10 in increments of 2; and from 0 to 10 in increments of 2), (x-axis) respectively. For those consuming less than 8 cups of tap water, p equals 0.250 for PFOA; p equals 0.253 for PFOA excluding a high leverage point; p equals 0.032 for PFNA; p equals 0.354 for nPFOS; p equals 0.589 for brPFOS; and p equals 0.147 for PFHxS. For those consuming more than 8 cups of tap water, p less than 0.001 for PFOA; p equals 0.045 for PFOA excluding a high leverage point; p equals 0.004 for PFNA; p equals 0.822 for nPFOS; p equals 0.294 for brPFOS; and p equals 0.459 for PFHxS.
Figure 2.
Associations between tap water and plasma PFAS concentrations among NHS participants in 1989–1990, estimated with a Generalized Additive Model (GAM) with a cubic spline smoothing function. Model estimates were not adjusted for covariates. Shaded area showed 95% confidence interval (CI). Participants who consume <8 cups of tap water per day (n0=44) are shown in light gray and participants who consume 8 cups of tap water per day (n1=66) are shown in blue. The PFOA model was run twice after removing one individual with high leverage. For a description of the models, see Table 4.
Figure 3 is a box and whisker plot, plotting relative source contribution of tap water(ranging from 0 to 150 percent at increments of 50) (y-axis) for PFOA, PFNA, nPFOS, brPFOS, and PFHxS (x-axis). Years in current residence are: less than 2, 2 to 4, 4 to 14, and greater than 14.
Figure 3.
Estimated relative source contribution (RSC) of tap water to overall PFAS exposure using a one-compartment toxicokinetic model. The dashed line represents the default RSC (20%) used in risk assessment to derive drinking water advisory levels. The upper panel shows the RSC among 110 Nurses’ Health Study (NHS) participants in 1989–1990. The lower-panel shows the RSC stratified by number of years at the same residential location. Box and whisker plots show the fifth, 25th, 50th, 75th and 95th percentiles among each group. Individual estimates are denoted by gray dots with small random variation added to their horizontal position for better separation. All data used to generate this figure are provided in Tables S8 and S9.
Figure 4 is a box and whisker plot plotting modeled plasma PFAS in tap water (ranging from 0 to 30 nanograms per milliliter at increments of 10) (y-axis) across PFOA, PFNA, nPFOS, brPFOS, and PFHxS (x-axis) for 1989 or 1990, 2013 to 2015 (a), and 2013 to 2015 (b).
Figure 4.
Estimated plasma PFAS concentrations for 225 individuals using a one-compartment toxicokinetic model and paired recent (2013–2015) measurements of PFASs in tap water with those from 1989–1990. Data under “2013–2015(a)” show nondetects replaced by the method reporting limit/2; Data under “2013–2015(b)” show nondetects replaced by zero. Box and whisker plots indicate fifth, 25th, 50th, 75th and 95th percentiles among each group. Individual estimates are shown as gray dots with small random variation added to their horizontal position for better separation.

References

    1. Barzen-Hanson KA, Roberts SC, Choyke S, Oetjen K, McAlees A, Riddell N, et al. . 2017. Discovery of 40 classes of per- and polyfluoroalkyl substances in historical aqueous film-forming foams (AFFFs) and AFFF-impacted groundwater. Environ Sci Technol 51(4):2047–2057, PMID: 28098989, 10.1021/acs.est.6b05843. - DOI - PubMed
    1. Belanger CF, Hennekens CH, Rosner B, Speizer FE. 1978. The Nurses' Health Study. Am J Nurs 78(6):1039–1040, PMID: 248266. - PubMed
    1. Blum A, Balan SA, Scheringer M, Trier X, Goldenman G, Cousins IT, et al. . 2015. The Madrid statement on poly-and perfluoroalkyl substances (PFASs). Environ Health Perspect 123(5):A107, PMID: 25932614, 10.1289/ehp.1509934. - DOI - PMC - PubMed
    1. Calafat AM, Kuklenyik Z, Reidy JA, Caudill SP, Tully JS, Needham LL. 2007. Serum concentrations of 11 polyfluoroalkyl compounds in the U.S. population: data from the National Health and Nutrition Examination Survey (NHANES). Environ Sci Technol 41(7):2237–2242, PMID: 17438769. - PubMed
    1. Dassuncao C, Hu XC, Nielsen F, Weihe P, Grandjean P, Sunderland EM. 2018. Shifting global exposures to poly- and perfluoroalkyl substances (PFASs) evident in longitudinal birth cohorts from a seafood-consuming population. Environ Sci Technol 52(6):3738–3747, PMID: 29516726, 10.1021/acs.est.7b06044. - DOI - PMC - PubMed

Publication types