. 2019 Jun 6;15(6):e1008085.
doi: 10.1371/journal.pgen.1008085. eCollection 2019 Jun.

Mitochondrial fusion is required for regulation of mitochondrial DNA replication

Affiliations

Mitochondrial fusion is required for regulation of mitochondrial DNA replication

Eduardo Silva Ramos et al. PLoS Genet. .

Abstract

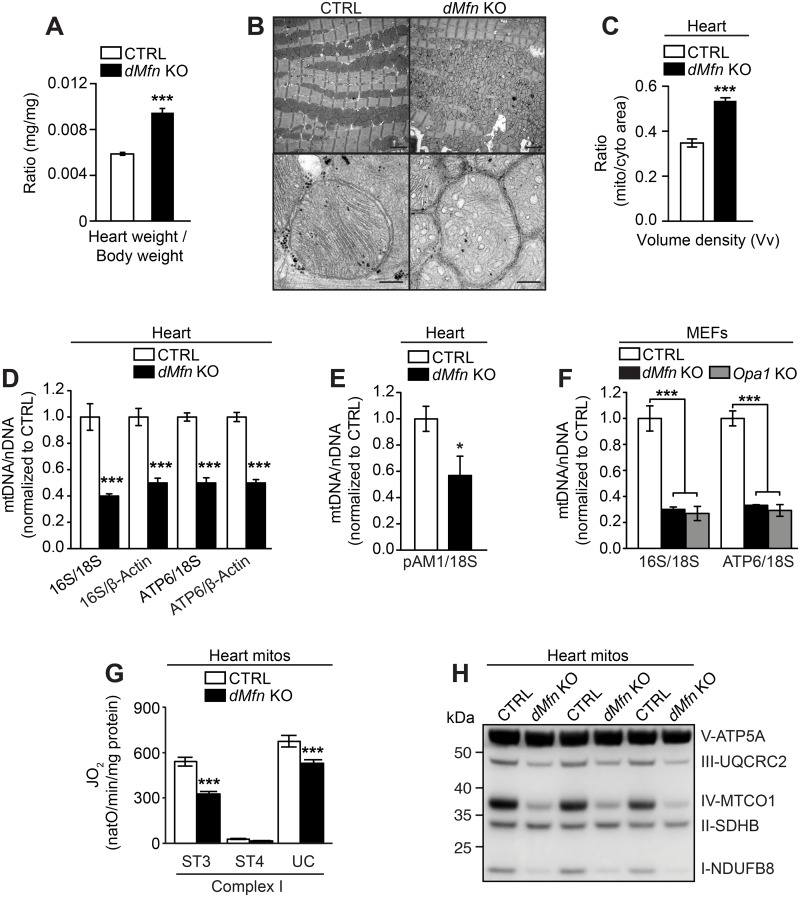
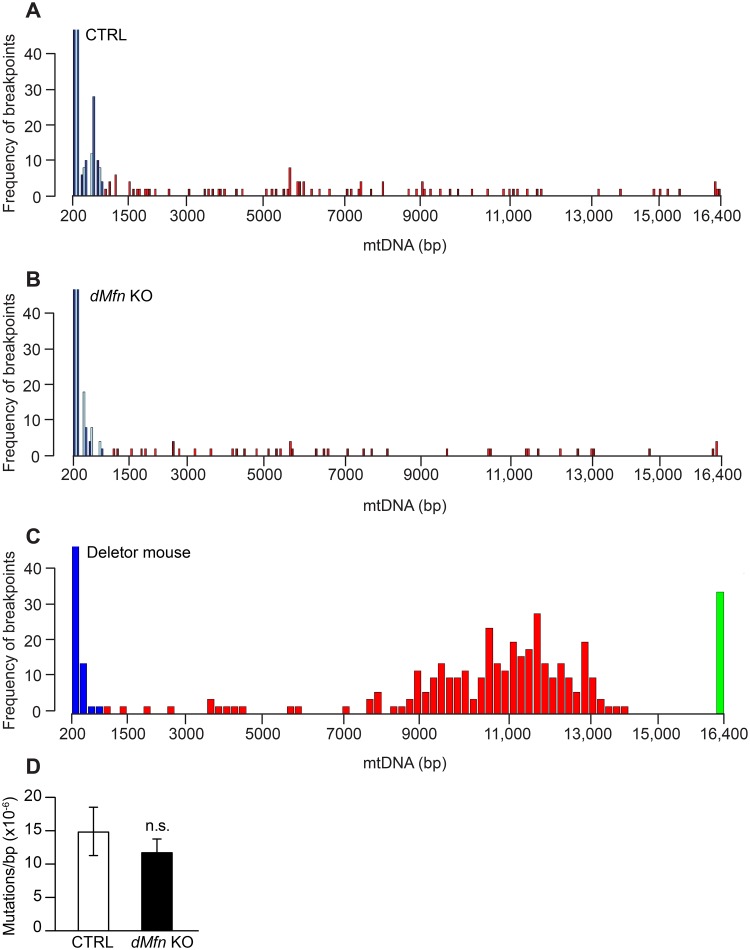
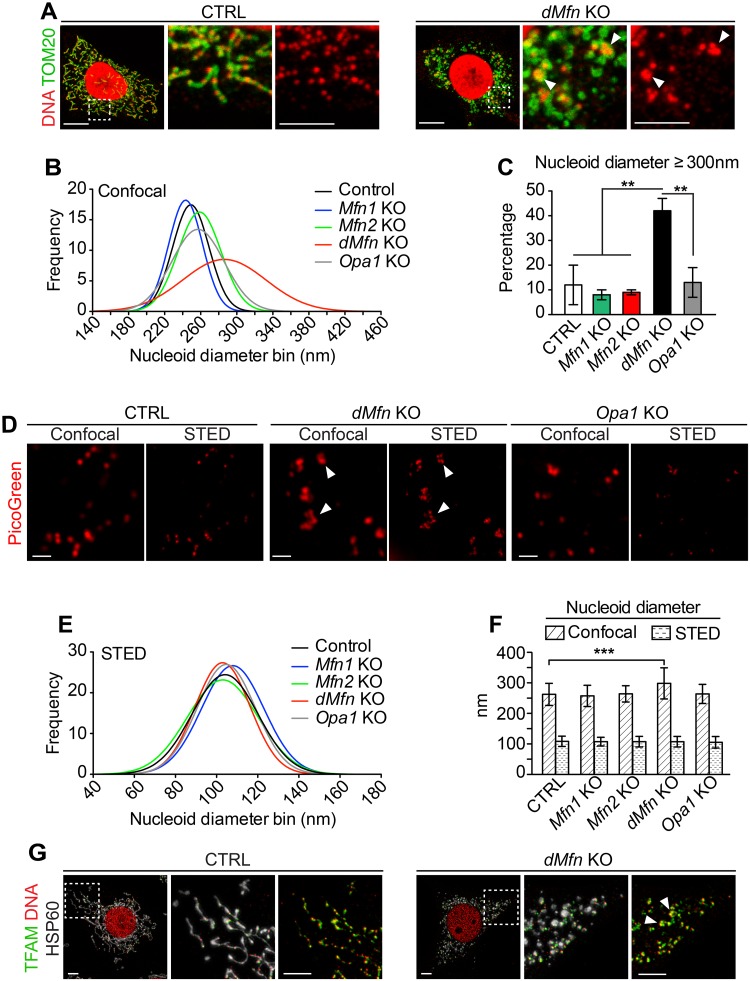
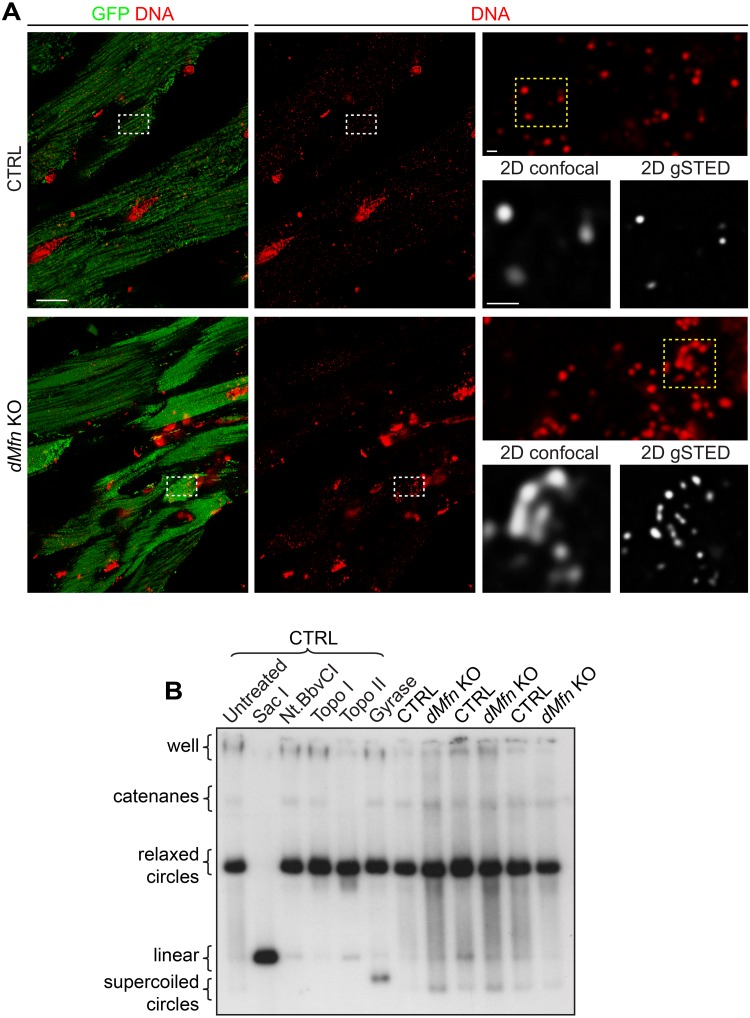
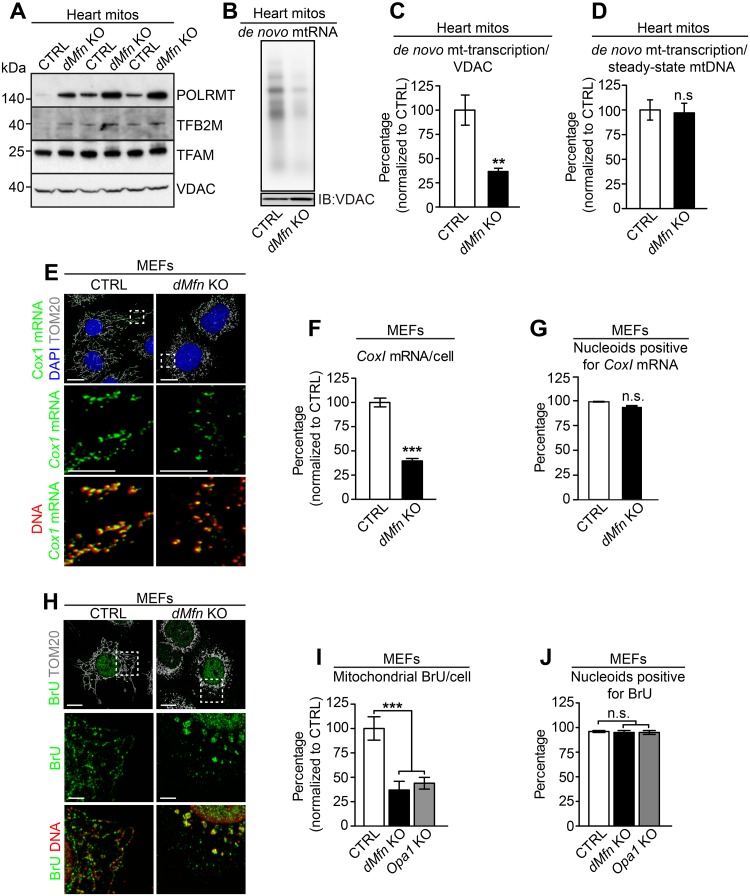
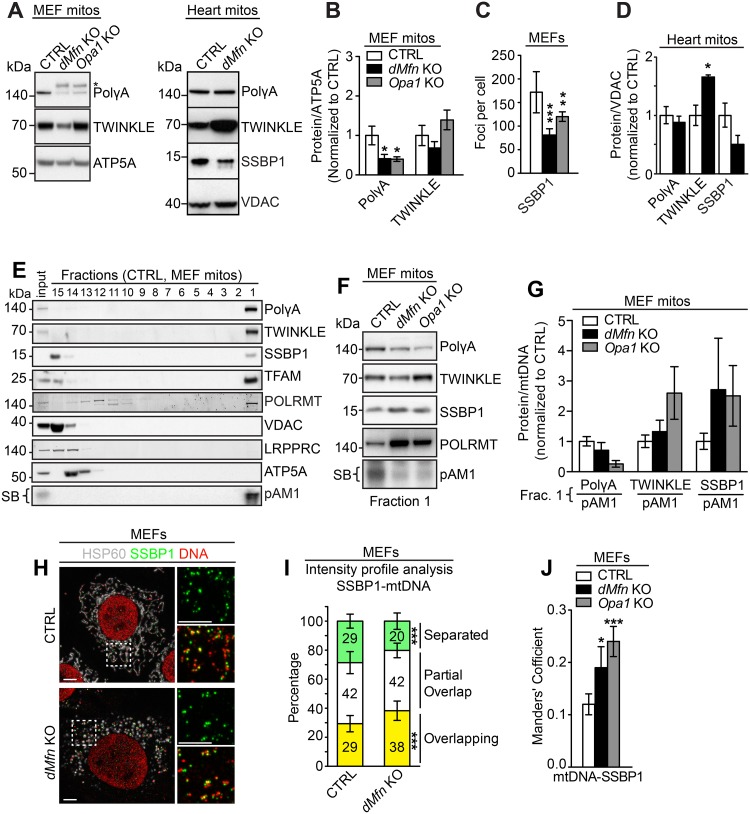
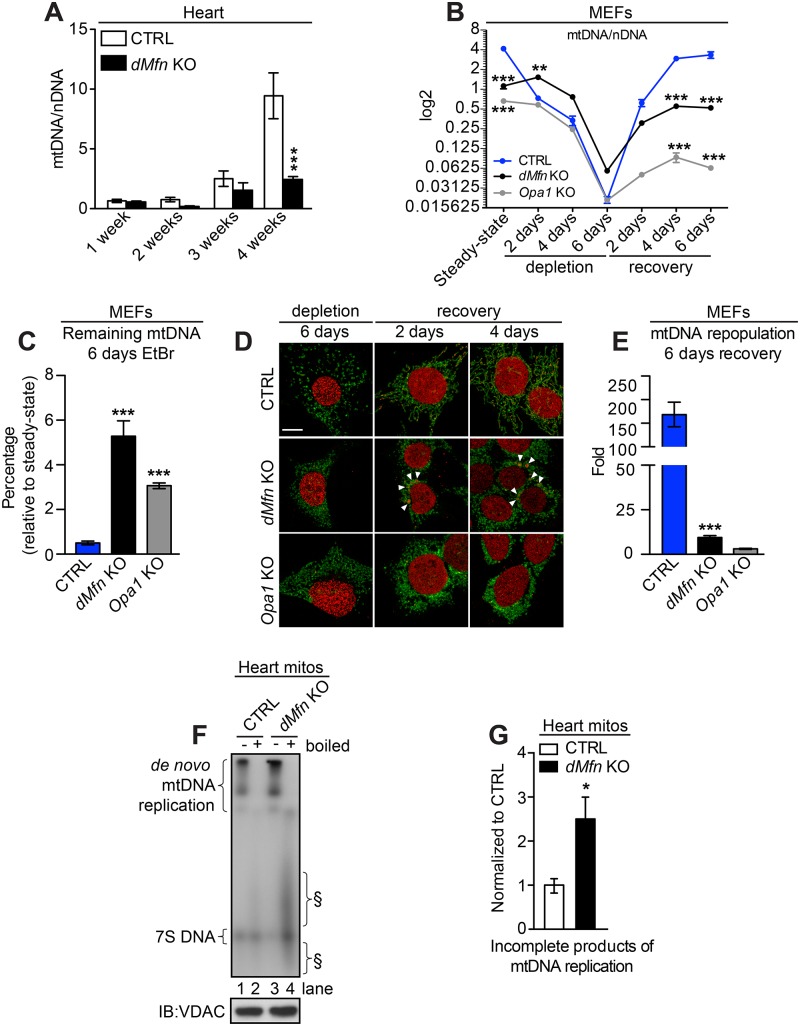
Mitochondrial dynamics is an essential physiological process controlling mitochondrial content mixing and mobility to ensure proper function and localization of mitochondria at intracellular sites of high-energy demand. Intriguingly, for yet unknown reasons, severe impairment of mitochondrial fusion drastically affects mtDNA copy number. To decipher the link between mitochondrial dynamics and mtDNA maintenance, we studied mouse embryonic fibroblasts (MEFs) and mouse cardiomyocytes with disruption of mitochondrial fusion. Super-resolution microscopy revealed that loss of outer mitochondrial membrane (OMM) fusion, but not inner mitochondrial membrane (IMM) fusion, leads to nucleoid clustering. Remarkably, fluorescence in situ hybridization (FISH), bromouridine labeling in MEFs and assessment of mitochondrial transcription in tissue homogenates revealed that abolished OMM fusion does not affect transcription. Furthermore, the profound mtDNA depletion in mouse hearts lacking OMM fusion is not caused by defective integrity or increased mutagenesis of mtDNA, but instead we show that mitochondrial fusion is necessary to maintain the stoichiometry of the protein components of the mtDNA replisome. OMM fusion is necessary for proliferating MEFs to recover from mtDNA depletion and for the marked increase of mtDNA copy number during postnatal heart development. Our findings thus link OMM fusion to replication and distribution of mtDNA.


Conflict of interest statement

The authors have declared that no competing interests exist.

Figures

Fig 1
Fig 1. Loss of outer membrane fusion results in mtDNA depletion and OXPHOS dysfunction.
(A) Heart weight to body weight ratio of male and female control (n = 19) and dMfn KO (n = 13) mice at 5 weeks of age. (B) Representative images of fixed heart tissue from control and dMfn KO animals at 5 weeks of age analyzed by electron microscopy. For each genotype 3–5 biological replicates were analyzed. Scale bars represent 2 μm for overview image and 0.2 μm for zoom-in image. (C) Volume density (Vv) analysis in heart of control (n = 5) and dMfn KO (n = 3) animals at 5 weeks of age as determined by ratio of mitochondria to cytoplasmic area from electron microscopy images. (D) Quantitative PCR analysis of mtDNA copy number (16S and ATP6) normalized to nuclear DNA (β-Actin and 18S) from heart samples of control (white bar) and dMfn KO (black bar) at 5 weeks of age (n = 5 of for each genotype). (E) Quantification of mtDNA levels by Southern blot analyses of control and dMfn heart KO samples (n = 3 for each genotype) at 5 weeks. The mtDNA levels (pAM1) were normalized to nuclear DNA (18S). (F) Quantitative PCR analysis of mtDNA copy number (16S and ATP6) normalized to nuclear DNA (β-Actin and 18S) from control (white bars), dMfn KO (black bars), Opa1 KO (gray bars) MEFs (n = 4 of each genotype). (G) Oxygen consumption rates of heart mitochondria isolated from control and dMfn KO animals at 5 weeks of age, n = 10 for both genotypes. Mitochondrial respiration was assessed under phosphorylating (ST3), non-phosphorylating (ST4), and uncoupled (UC) conditions using complex I substrates. (H) Western blot of OXPHOS proteins from heart mitochondria from control and dMfn KO animals at 5 weeks of age (n = 3 for each genotype). Error bars indicate ± SEM. For (A, C, and G), Student T-test; *, P < 0.05; ***, P < 0.001. For (F), one-way ANOVA using Turkey’s multiple comparison test; ***, P < 0.001.
Fig 2
Fig 2. Integrity of mtDNA is unaffected upon loss of mitochondrial fusion.
Analysis of mitochondrial DNA rearrangement frequency from hearts of control (A), dMfn KO (B), and Deletor (C) animals at 5 weeks of age as determined by Illumina sequencing (control n = 3; dMfn KO n = 3 and Deletor mouse n = 1). The graphs depict paired-end sequencing reads from individual animals with an abnormally long or short insert size plotted as bins along the x-axis. The frequency of unique rearrangement breakpoints is plotted on the y-axis. Blue bins represent variations in the fragment size and not rearrangement breakpoints; red bins denote rearrangements larger than 600 bases. In the deletor mice, a green bin at position 16,400 kb signifies rearrangement breakpoints encompassing the first and last positions of the reference sequence, leading to difficulties in assessing the true size of the rearrangement. Shades of blue and red indicate different individual animals within a group. (D) Mitochondrial DNA mutation load analysis in heart from control and dMfn KO animals at 5–6 weeks of age, n = 3 for both genotypes. n.s., no statistical significance based on Student T-test.
Fig 3
Fig 3. Loss of outer membrane fusion results in mitochondrial nucleoid clustering.
(A) Confocal microscopy images of control and dMfn KO MEFs immunostained to detect TOM20 protein or DNA. Dashed boxes specify the areas of magnification shown in the panels to the right. Scale bars, main image 10 μm, zoom-in 5 μm. Three independent experiments were performed per genotype. (B) Gaussian distribution of diameters of PicoGreen-labeled nucleoids as determined by confocal microscopy of control, Mfn1 KO, Mfn2 KO, dMfn KO, and Opa1 KO MEFs. (C) Quantification of PicoGreen-labeled nucleoids with a diameter ≥ 300 nm as determined by confocal microscopy. For each cell type (n = 3–6) up to 35 nucleoids were analyzed per cell. (D) Images of PicoGreen-labeled nucleoids from control, dMfn KO, Opa1 KO MEFs. Scale bar 500 nm. (E) Gaussian distribution diameters of PicoGreen-labeled nucleoids from STED-acquired images in control, Mfn1 KO, Mfn2 KO, dMfn KO, Opa1 KO MEFs. (F) Average diameters of PicoGreen-labeled nucleoids in control, Mfn1 KO, Mfn2 KO and dMfn KO MEFs from confocal and STED-acquired images. The nucleoid diameters were measured at full width at half maximum on 100 nucleoids from each genotype. Error bars indicate standard deviation of the mean. For each genotype, nucleoid diameters were determined from n = 3–6 cells. (G) Representative images from 3 independent experiments of control and dMfn KO MEFs stained with anti-TFAM, anti-DNA and anti-HSP60 antibodies. Scale bar is 5 μm. Error bars indicate ± SEM. For (C and F), one-way ANOVA using Turkey’s multiple comparison test; **, P < 0.01; ***, P < 0.001. Arrows indicate clustered mtDNA.
Fig 4
Fig 4. Loss of outer membrane fusion does not affect mtDNA topology.
(A) Representative deconvoluted confocal and STED images of mtDNA from heart sections of control and dMfn KO animals at 4 weeks of age. Tissue samples were stained with anti-GFP and anti-DNA antibodies. Left panels show maximal projection of heart sections for mitochondria (GFP), nuclear and mitochondrial DNA (red). White dashed boxes specify areas of magnification shown in top right panel. Bottom right panels show 2D (single stack) images of mitochondrial nucleoids obtained by dual confocal and gated STED (gSTED) microscopy corresponding to the yellow dashed boxed. Scale bars represent 10 μm for overview image, and 500 nm in both zoom-in panels. Staining patterns were determined in three independent animals per genotype. (B) Topology of mtDNA obtained by using total DNA from heart tissue of control (n = 3) and dMfn KO (n = 3) mice at 3 weeks of age. The high molecular weight portion of the gel is shown. Control mtDNA was either untreated or treated with SacI, NtBbvCI, topoisomerase I (Topo I), topoisomerase II (Topo II), or DNA gyrase enzymes. mtDNA was probed with pAM1 (mouse mtDNA).
Fig 5
Fig 5. Loss of mitochondrial fusion does not affect mtDNA transcription.
(A) Western blot analysis of steady-state levels of proteins essential for mitochondrial transcription in heart mitochondria from control and dMfn heart KO animals at 5–6 weeks of age (n = 3 for each genotype). (B) Representative image of a mitochondrial de novo transcription assay with heart mitochondria. Mitochondrial VDAC levels were determined by western blot analysis and used as loading control. Multiple control (n = 6) and dMfn KO (n = 5) heart mitochondrial samples were analyzed at 4 weeks of age. (C) Quantification of mitochondrial de novo transcription related to VDAC protein levels in control (n = 6) and dMfn heart KO (n = 5) mitochondria. (D) Quantification of mitochondrial de novo transcription related to the steady-state levels of mtDNA of control (n = 6) and dMfn KO (n = 5) heart mitochondria. (E) Representative fluorescence in situ hybridization of images visualizing the mitochondrial CoxI mRNA, followed by immunocytochemistry to detect mtDNA and TOM20 protein in control and dMfn KO MEFs. Dashed boxes specify the areas of magnification. Scale bars represent 10 μm for overview image and 5 μm for zoom-in images. Staining patterns were determined in five independent experiments per genotype. (F) Quantification of CoxI mRNA in control (n = 17) and dMfn KO (n = 15) by using stacked confocal images from individual MEFs. (G) Quantification of nucleoids positive for CoxI mRNA by using stacked confocal images from control (n = 15) and dMfn KO (n = 14) MEFs. (H) Representative images of immunocytochemistry to detect BrU labeling of newly synthesized mitochondrial RNA, mtDNA and TOM20 protein in control and dMfn KO MEFs. Dashed boxes specify the areas of magnification. Scale bars represent 10 μm for overview image and 5 μm for zoom-in images. Staining patterns were determined in five independent experiments per genotype. (I) Quantification of BrU-labeled mitochondrial RNAs by using stacked confocal images from control (n = 15), dMfn KO (n = 15), and Opa1 KO (n = 15) MEFs. (J) Quantification of BrU-positive nucleoids by using stacked confocal images from control (n = 15), dMfn KO (n = 18), and Opa1 KO (n = 15) MEFs. Error bars indicate ± SEM. For (C, D, F, and G), Student T-test; **, P < 0.01; ***, P < 0.001. For (I and J), one-way ANOVA using Turkey’s multiple comparison test relative to control; ***, P < 0.001; n.s., non-significant difference.
Fig 6
Fig 6. Loss of mitochondrial fusion affects replisome composition.
(A) Left, representative western blot showing the steady-state levels of mitochondrial replication proteins from isolated MEF mitochondria from control, dMfn KO, Opa1 KO MEFs. Right, representative western blot showing the steady-state levels of mitochondrial replication proteins in isolated heart mitochondria from control and dMfn KO mice at 5–6 weeks of age. (B) Quantification of the steady-state levels of replisome proteins as determined by western blot analysis of mitochondria from control, dMfn KO, and Opa1 KO MEFs. Replisome protein levels were normalized to ATP5A (n = 7 per genotype). (C) Quantification of SSBP1 foci per cell in control, dMfn KO, and Opa1 KO MEFs. Cells were immunostained with anti-SSBP1 and anti-HSP60 antibodies, n = 4 for each genotype, 5–8 cells analyzed per n. (D) Quantification of mitochondrial replication proteins levels in isolated heart mitochondria from control (n = 3) and dMfn KO (n = 3) mice at 5–6 weeks of age, normalized to VDAC. (E) Representative western blot analysis of glycerol gradient fractions from mitochondria isolated from control MEFs. Upper panel corresponds to western blotting and lower panel shows Southern blot (SB) analysis to detect mtDNA by using the pAM1 probe. (F) Representative western blot analysis of fraction 1 from the glycerol density gradient. In total, 4 independent biological samples were used for all genotypes. (G) Quantification of the western blot analysis of fraction 1 from the glycerol density gradient related to (F), n = 4 for all genotypes. (H) Representative confocal image of control and dMfn KO MEFs immunostained with anti-SSBP1 and anti-dsDNA antibodies, n = 3 for each genotype. Scale bars represent 5 μm. (I) Line scan analysis based on intensity profiles of SSBP1 and mtDNA of control and dMfn KO MEFs, n = 3 for each genotype, 7–10 cells analyzed per n. Line scans generated intensity profiles that were separated into three categories, no overlap of intensities between SSBP1-mtDNA (free SSBP1), partial overlap between SSBP1-mtDNA intensities, and complete overlap of intensities between SSBP1-mtDNA. (J) Mander’s Coefficient, related to H, expressing the degree of mtDNA foci colocalizing with SSBP1 foci from confocal acquired images in control (n = 4 independent experiments, 23 cells analyzed per n) and dMfn KO (n = 3 independent experiments, 16 cells analyzed per n), Opa1 KO MEFs (n = 3 independent experiments, 22 cells analyzed per n). For all, error bars indicate ± SEM. (For D and I) Student T-test; *, P < 0.05; **, P < 0.01; ***, P < 0.001. For (B, C, G, and J), one-way ANOVA using Turkey’s multiple comparison test relative to control; *, P < 0.05; **, P < 0.01; ***, P < 0.001.
Fig 7
Fig 7. Loss of mitochondrial fusion impairs mtDNA replication.
(A) Quantitative PCR analysis of mtDNA copy number (ATP6) normalized to nuclear DNA (18S) in heart samples from control and dMfn KO between 1–4 weeks of age (n = 3–10 per genotype). (B) Quantitative PCR analysis of mtDNA copy number (ATP6) normalized to nuclear DNA (18S) from control, dMfn KO, and Opa1 KO MEFs after treatment with 100 ng/ml ethidium bromide (EtBr), n = 4–8 replicates per genotype. (C) Quantification of mtDNA levels in control, dMfn KO, and Opa1 KO MEFs after 6 days of treatment with 100 ng/ml EtBr, n = 4 for all genotypes. (D) Representative confocal images of control, dMfn KO, and Opa1 KO MEFs during and after EtBr treatment. Cells were immunostained with anti-dsDNA and anti-TOM20 antibodies, n = 3 for each genotype. Scale bars represent 10 μm. White arrows point to clustered nucleoids. (E) Quantification of the fold change of mtDNA after 6 days of recovery from treatment with 100 ng/ml EtBr in control, dMfn KO, and Opa1 KO MEFs (n = 4 for all genotypes). (F) Mitochondrial de novo replication assay in heart mitochondria from control (n = 12) and dMfn KO (n = 8) animals at 3–4 weeks of age, normalized to VDAC protein levels (bottom panel). Incomplete mtDNA replication products (§) are indicated. Numbers mark the different mtDNA lanes (G) Quantification of the abundance of incomplete mtDNA replication products produced de novo in control (n = 6) and dMfn KO (n = 7) heart mitochondria at 3–4 weeks of age. For all, error bars indicate ± SEM. (A) and (B), two-way ANOVA using Bonferroni multiple comparison test; **, P < 0.01; ***, P < 0.001. (C) and (D), one-way ANOVA using Turkey’s multiple comparison test; ***, P < 0.001. (G) Student T-test; *, P < 0.05.

Comment in

  • Reshaping membranes to build mitochondrial DNA.
    Pla-Martin D, Wiesner RJ. Pla-Martin D, et al. PLoS Genet. 2019 Jun 6;15(6):e1008140. doi: 10.1371/journal.pgen.1008140. eCollection 2019 Jun. PLoS Genet. 2019. PMID: 31170157 Free PMC article. No abstract available.

References

    1. Bereiter-Hahn J, Vöth M. Dynamics of mitochondria in living cells: Shape changes, dislocations, fusion, and fission of mitochondria. Microsc Res Tech. 1994;27: 198–219. 10.1002/jemt.1070270303 - DOI - PubMed
    1. Chen H, Detmer SA, Ewald AJ, Griffin EE, Fraser SE, Chan DC. Mitofusins Mfn1 and Mfn2 coordinately regulate mitochondrial fusion and are essential for embryonic development. J Cell Biol. 2003;160: 189–200. 10.1083/jcb.200211046 - DOI - PMC - PubMed
    1. Alexander C, Votruba M, Pesch UEA, Thiselton DL, Mayer S, Moore A, et al. OPA1, encoding a dynamin-related GTPase, is mutated in autosomal dominant optic atrophy linked to chromosome 3q28. Nat Genet. 2000;26: 211–215. 10.1038/79944 - DOI - PubMed
    1. Wong ED, Wagner JA, Gorsich SW, McCaffery JM, Shaw JM, Nunnari J. The Dynamin-Related Gtpase, Mgm1p, Is an Intermembrane Space Protein Required for Maintenance of Fusion Competent Mitochondria. J Cell Biol. 2000;151: 341–352. 10.1083/jcb.151.2.341 - DOI - PMC - PubMed
    1. Santel A, Fuller MT. Control of mitochondrial morphology by a human mitofusin. J Cell Sci. 2001;114: 867–874. - PubMed

Publication types