. 2019 Aug 15:377:114605.
doi: 10.1016/j.taap.2019.114605. Epub 2019 Jun 3.

Non-monotonic dose-response effects of arsenic on glucose metabolism

Affiliations

Non-monotonic dose-response effects of arsenic on glucose metabolism

Yingyun Gong et al. Toxicol Appl Pharmacol. .

Abstract

Background: Inorganic arsenic (iAs) is a widespread environmental toxin. In addition to being a human carcinogen, its effect on diabetes has started to gain recognition recently. Insulin is the key hormone regulating systemic glucose metabolism. The in vivo effect of iAs on insulin sensitivity has not been directly addressed.

Objectives: Here we use mouse models to dissect the dose-dependent effects of iAs on glucose metabolism in vivo.

Methods: We performed hyperinsulinemic-euglycemic clamp, the gold standard analysis of systemic insulin sensitivity. We also performed dynamic metabolic testings and RNA-seq analysis.

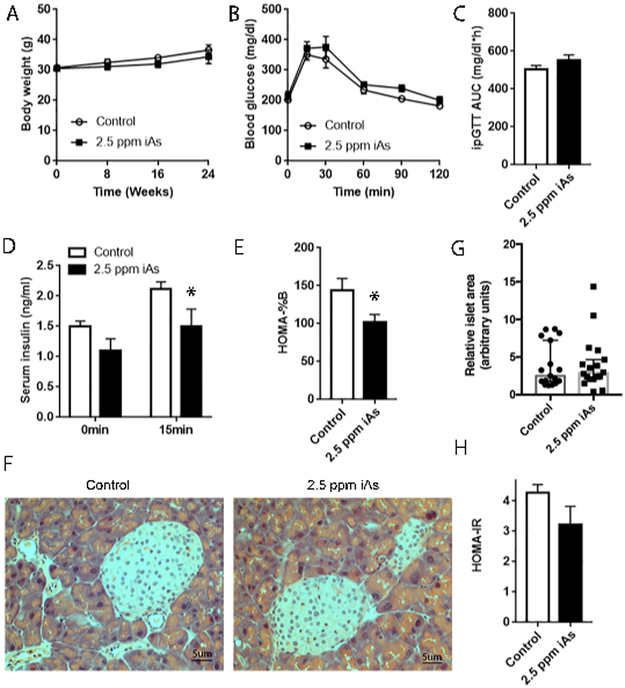
Results: We found that a low-dose exposure (0.25 ppm iAs in drinking water) caused glucose intolerance in adult male C57BL/6 mice, likely by disrupting glucose-induced insulin secretion without affecting peripheral insulin sensitivity. However, a higher-dose exposure (2.5 ppm iAs) had diminished effects on glucose tolerance despite disrupted pancreatic insulin secretion. Insulin Clamp analysis showed that 2.5 ppm iAs actually enhanced systemic insulin sensitivity by simultaneously enhancing insulin-stimulated glucose uptake in skeletal muscles and improved insulin-mediated suppression of endogenous glucose production. RNA-seq analysis of skeletal muscles revealed that 2.5 ppm iAs regulated expression of many genes involved in the metabolism of fatty acids, pyruvate, and amino acids.

Conclusion: These findings suggest that iAs has opposite glycemic effects on distinct metabolic tissues at different dose thresholds. Such non-monotonic dose-response effects of iAs on glucose tolerance shed light on the complex interactions between iAs and the systemic glucose metabolism, which could potentially help reconcile some of the conflicting results in human epidemiological studies.

Keywords: Arsenic; Dose Effect; Glucose Metabolism; Insulin Sensitivity.


Conflict of interest statement

Competing financial interests statement

The authors disclose no competing financial conflict of interest.

Figures

Fig. 1.
Fig. 1.
Effects of 0.25 ppm iAs on glucose metabolism. (A) Body weight of adult C57BL/6 male mice exposed to 0.25 ppm iAs (sodium arsenite) in drinking water for 15 weeks. n = 5 for control and n = 8 for 0.25 ppm iAs treatment. (B) Glucose tolerance test (GTT) after 0.25 ppm iAs treatment for 8 weeks. Mice were fasted for 6 h followed by i.p. glucose injection (2 g/kg). n = 5 for control and n = 8 for 0.25 ppm iAs treatment. (C) Area under the curve (AUC) during the GTT. (D) HOMA index for β cell function index (HOMA-%B) calculated from the fasting glucose and insulin levels after treating for 10 weeks. (E) Serum insulin levels at the baseline and 15 min after 2 g/kg glucose i.p. injection after treating for 10 weeks. (F) H&E staining of pancreas harvested after treatment for 15 weeks. (G) HOMA index for insulin resistance (HOMA-IR) calculated from the fasting glucose and insulin levels after treating for 10 weeks. (H) Insulin tolerance test. Mice were fasted for 4 h followed by i.p. insulin injection (0.75 mIU/kg) after treating 0.25 ppm iAs for 12 weeks. n = 5 for control and n = 8 for 0.25 ppm iAs treatment. Data are average ± S.E.M. Asterisks indicate significant difference by two-tail student's t-test. *p < 0.05.
Fig. 2.
Fig. 2.
2.5 ppm iAs has diminished effects on glucose tolerance than 0.25 ppm iAs. (A) Body weight in adult C57BL/6 male mice exposed to 2.5 ppm iAs (sodium arsenite) in drinking water for the indicated time period. n = 8 for control and n = 5 for 2.5 ppm iAs treatment group. (B) Glucose tolerance test (GTT) after 2.5 ppm iAs treatment for 8 weeks. (C) Area under the curve (AUC) during the GTT. (D) Serum insulin levels at the base line and 15 min after 2 g/kg glucose i.p. injection after treating for 12 weeks. (E) HOMA index for β cell function index (HOMA-%B). (F) H&E staining of pancreas harvested after treatment for 24 weeks. (G) Quantification of pancreatic islet area on the HE-stained slides (n = 13 sections for control and n = 17 sections for iAs treatment, expressed as median with 95% CI). (H) HOMA index for insulin resistance (HOMA-IR) after treating for 12 weeks. Data are average ± S.E.M except otherwise indicated. Asterisks indicate significant difference by two-tail student's t-test. *p < 0.05.
Fig. 3.
Fig. 3.
2.5 ppm iAs increases insulin sensitivity. (A) Blood glucose levels during the clamp analysis. (B) Glucose infusion rate (GIR) during the clamp experiment. (C) Final GIR during the steady state. The average GIR was calculated from 60 min until the end of clamp experiment. (D) Endogenous glucose production rate (EndoRa) at the baseline after 5 h fasting and during the clamp. (E) Hepatic glycogen contents after clamp. (F) Glucose disappearance rate (Rd) during the clamp. (G) Tissue-specific glucose uptake rate (Rg) in skeletal muscle, white adipose tissue (WAT), and brown adipose tissue (BAT). n = 3 per group. The clamp study was done after iAs exposure in drinking water for 18 weeks. Data are average ± S.E.M. Asterisks indicate significant difference by two-tail student's t-test. *p < 0.05, **p < 0.01, ***p < 0.001. (For interpretation of the references to colour in this figure legend, the reader is referred to the web version of this article.)
Fig. 4.
Fig. 4.
2.5 ppm iAs alters metabolic gene expression in skeletal muscles. (A) Western blot analysis of insulin signaling in muscles from mice treated with 2.5 ppm iAs for 24 weeks. Muscles were harvested immediately after the clamp study. (B–C) Quantification of the western blot analysis in A. (D) RNA-seq analysis heat map. (E) Gene ontology (GO) analysis of differentially expressed genes. Data are average ± S.E.M.
Fig. 5.
Fig. 5.
2.5 ppm iAs alters lipid metabolism in skeletal muscles. (A) GSEA analysis of the RNA-seq data. (B) RT-qPCR analysis of muscles from mice treated with 2.5 ppm iAs for 24 weeks. Muscles were harvested after the clamp study, n = 3. (C-D) Serum and muscle triglyceride (TG) and cholesterol levels from mice treated with 2.5 ppm iAs for 24 weeks harvested after 6 h fasting, n = 5. (E) Muscle total triglycerides content from mice treated with 2.5 ppm iAs for 24 weeks harvested after 6 h fasting, n = 5. (F-G) Western blot analysis of skeletal muscles for the mitochondrial oxidative phosphorylation (OXPHOS) complexes from mice treated with 2.5 ppm iAs for 24 weeks, n = 5. Data are average ± S.E.M. Asterisks indicate significant difference by student's t-test p < 0.05.

References

    1. Agency for Toxic Substances and Disease Registry, 2018. Available at. https://www.atsdr.cdc.gov/ (Accessed: 10th September 2018).
    1. Ahangarpour A, et al., 2018. Evaluation of Diabetogenic mechanism of high fat diet in combination with arsenic exposure in male mice. Iran. J. Pharm. Res. IJPR 17, 164–183. - PMC - PubMed
    1. Ambrosio F, et al., 2014. Arsenic induces sustained impairment of skeletal muscle and muscle progenitor cell ultrastructure and bioenergetics. Free Radic. Biol. Med. 74, 64–73. - PMC - PubMed
    1. Anders S, Huber W, 2010. Differential expression analysis for sequence count data. Genome Biol. 11, R106. - PMC - PubMed
    1. Anders S, Pyl PT, Huber W, 2015. HTSeq-a Python framework to work with high-throughput sequencing data. Bioinforma. Oxf. Engl. 31, 166–169. - PMC - PubMed

Publication types