. 2019 Jun:24:101213.
doi: 10.1016/j.redox.2019.101213. Epub 2019 May 8.

Redox properties and human serum albumin binding of nitro-oleic acid

Affiliations

Redox properties and human serum albumin binding of nitro-oleic acid

Martina Zatloukalova et al. Redox Biol. 2019 Jun.

Abstract

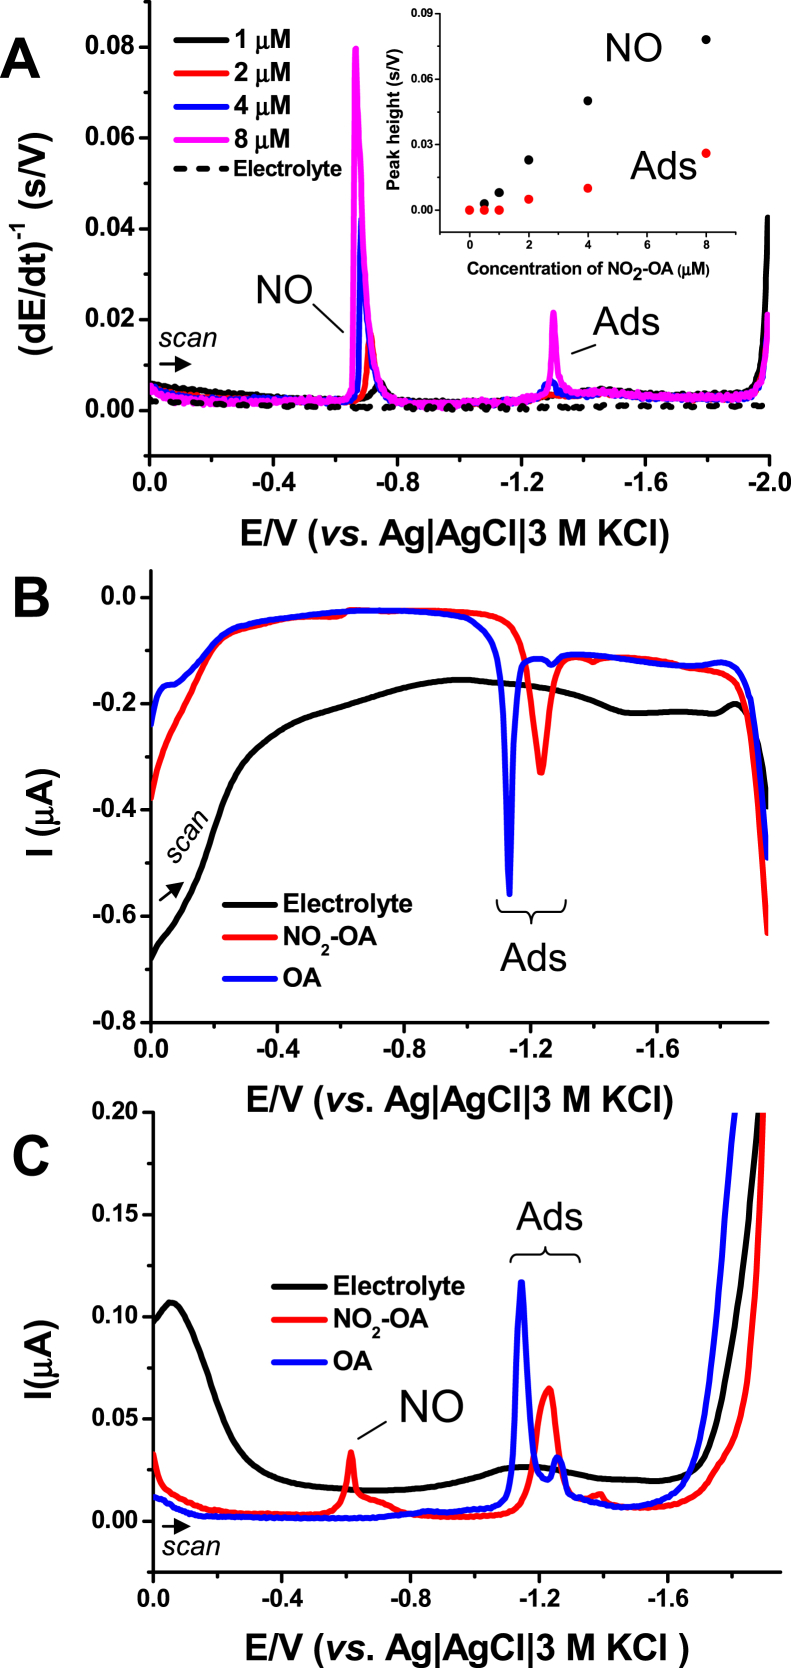
Nitro-fatty acids modulate inflammatory and metabolic stress responses, thus displaying potential as new drug candidates. Herein, we evaluate the redox behavior of nitro-oleic acid (NO2-OA) and its ability to bind to the fatty acid transporter human serum albumin (HSA). The nitro group of NO2-OA underwent electrochemical reduction at -0.75 V at pH 7.4 in an aqueous milieu. Based on observations of the R-NO2 reduction process, the stability and reactivity of NO2-OA was measured in comparison to oleic acid (OA) as the negative control. These electrochemically-based results were reinforced by computational quantum mechanical modeling. DFT calculations indicated that both the C9-NO2 and C10-NO2 positional isomers of NO2-OA occurred in two conformers with different internal angles (69° and 110°) between the methyl- and carboxylate termini. Both NO2-OA positional isomers have LUMO energies of around -0.7 eV, affirming the electrophilic properties of fatty acid nitroalkenes. In addition, the binding of NO2-OA and OA with HSA revealed a molar ratio of ~7:1 [NO2-OA]:[HSA]. These binding experiments were performed using both an electrocatalytic approach and electron paramagnetic resonance (EPR) spectroscopy using 16-doxyl stearic acid. Using a Fe(DTCS)2 spin-trap, EPR studies also showed that the release of the nitro moiety of NO2-OA resulted in the formation of nitric oxide radical. Finally, the interaction of NO2-OA with HSA was monitored via Tyr and Trp residue electro-oxidation. The results indicate that not only non-covalent binding but also NO2-OA-HSA adduction mechanisms should be taken into consideration. This study of the redox properties of NO2-OA is applicable to the characterization of other electrophilic mediators of biological and pharmacological relevance.

Keywords: Electrophiles; NO; Nitrated fatty acids; Oleic acid; Proteins; Serum albumin binding.


Figures

Image 1
Graphical abstract
Fig. 1
Fig. 1
(A) Structure of nitro-oleic acid, NO2-OA. Electrochemistry of NO2-OA on pyrolytic graphite electrode: (B) Cyclic voltammograms of 20 μM NO2-OA and oleic acid (OA) in 0.1 M phosphate buffer at pH 7.4. CV conditions: start potential −0.25 V, vertex potential −1.25 V, step potential 5 mV, scan rate 1 V/s. (C) Dependence of SWV peak NO (Ep = −0.75 V) on concentration of NO2-OA in Britton-Robinson buffer at pH 7.4. SWV parameters: initial potential 0 V, end potential −1.5 V, step potential 5 mV, amplitude 25 mV, frequency 200 Hz. Inset: Selected SWV records related to panel C.
Fig. 2
Fig. 2
Electrochemistry of NO2-OA on mercury electrode, HMDE. (A) CPS records of NO2-OA at various concentrations in 0.1 M phosphate buffer at pH 7.4; Istr = −35 μA. Inset: Dependence of both CPS peaks NO and Ads on NO2-OA concentration. Out-of-phase (B) and in-phase (C) AC voltammograms of 30 μM NO2-OA (red lines) and OA (blue lines) in 0.1 M phosphate buffer (pH 7.4); initial (0 V) and end (−1.95 V) potentials, frequency: 66.2 Hz, amplitude: 5 mM, phase angle: 90° (for B) and 0° (for C). (For interpretation of the references to colour in this figure legend, the reader is referred to the Web version of this article.)
Fig. 3
Fig. 3
(A) Structures with highlighted LUMO for 9-nitrooleic (left) and 10-nitrooleic acid (right) in ‘open’ (top) and ‘closed’ (down) conformations. (B) Electrostatic potential visualization for oleic, 9-nitrooleic and 10-nitrooleic acid (from left to right) in ‘open’ (upper) and ‘closed’ (lower) conformations.
Fig. 4
Fig. 4
(A) CPS records of NO2-OA and OA in presence of human serum albumin (HSA). (B) Dependence of peak H and NO heights on concentration of NO2-OA or OA after their incubation with HSA; Istr = −95 μA (three independent experiments, n = 3). The incubation of HSA with the fatty acids (FAs) was performed for 30 min at 37 °C in 0.1 M phosphate buffer, pH 7.4. Concentration of HSA in incubation mixture was 6.25 μM, and FAs were added in the molar rations: 1:1, 2:1, 4:1, 8:1, 16:1, 32:1, 64:1 [FA]:[HSA]. For CPS analyses, the incubation mixtures were diluted directly in the supporting electrolyte (0.1 M phosphate buffer, pH 6.5) to a final concentration of 500 nM HSA. (C) Denaturing SDS and (D) native electrophoretograms of HSA in absence or presence of the FAs after 24 h incubation. The samples are in the following order, from left to right: marker (M), HSA, [NO2-OA]:[HSA] in molar ratio 4:1, 16:1 and 64:1, HSA, [OA]:[HSA] (4:1, 16:1, 64:1). (E) Native electrophoresis of HSA after its 24 h incubation with NO2-OA, final [NO2-OA]:[HSA] ratio was 4:1, 8:1, 16:1, 32:1, 64:1, from left to right.
Fig. 5
Fig. 5
Surface models of HSA (PDB code: 1GNI) with electroactive amino acid residues highlighted. (A) Cys – red, His – blue, Arg – yellow, Lys – magenta. (B) Tyr – cyan, Trp – brown, oleic acid (OA) – black. The left and right images are mutually rotated by 180° along the vertical axis for each panel. For ribbon models, see Fig. S5 in Supporting Information. (For interpretation of the references to colour in this figure legend, the reader is referred to the Web version of this article.)
Fig. 6
Fig. 6
(A)Ex situ SW voltammograms of HSA in absence or presence of nitro-oleic (NO2-OA) and oleic (OA) acid in acetate buffer (pH 5) in molar ratio 16:1 [FA]:[HSA] after 24 h of incubation. (B) Dependence of peak YW heights of HSA in absence or presence of fatty acids (FAs) in different molar ratios as indicated. HSA incubation with FAs was performed in 0.1 M phosphate buffer, pH 7.4, at 37 °C; the concentration of HSA in incubation mixtures was 6.25 μM and the FAs were added in the molar ratios: 2:1, 8:1, 16:1 [FA]:[HSA]. The incubation was performed for three different lengths of time: 0 h = the samples were analyzed immediately after HSA-FA mixing. SWV parameters: working electrode was PGE, accumulation time 30 s, initial potential: 0 V, end potential: +1.2 V, step potential: 5 mV, amplitude: 25 mV, frequency: 200 Hz. Ex situ analysis was performed as described in Experimental section.
Fig. 7
Fig. 7
(A) Chemical structure of spin-probe 16-doxyl-stearic acid – a paramagnetic derivative of stearic acid containing an unpaired electron between the nitrogen and oxygen atom of the doxyl group. (B) EPR spectrum of HSA incubated with 16-DS at [16-DS]:[HSA] molar ratio 6:1. This spectrum consists of two main components: the broad anisotropic spectrum of 16-DS bound to HSA characterized by the spectrum width, 2Amax, and the designated sharp triplet which corresponds to the unbound, freely tumbling 16-DS. The sample contained 0.1 mM HSA dissolved in 0.1 M phosphate buffer at pH 7.4.
Fig. 8
Fig. 8
(A) EPR spectra of 16-DS/HSA complex in presence and absence of oleic (OA) and NO2-OA. The [FA]:[HSA] molar ratio in these samples was 4:1. (B) Dependence of Ihigh-fieldpeak/Ilow-field peak ratio measured from EPR spectra of 16-DS bound to HSA on [FAs]:[HSA] molar ratio. All samples used for obtaining data presented in panels A and B contained 0.1 mM HSA (dissolved in 0.1 M phosphate buffer, pH 7.4) and 0.6 mM 16-DS. Unlabeled fatty acids were incubated with 16-DS/HSA complex at 37 °C for 30 min. Afterwards, the samples were cooled down to room temperature, and subsequently EPR spectra were acquired.
Fig. 9
Fig. 9
EPR spectra of NO radicals trapped by Fe(DTCS)2. The NO radical was released from: (A) NO2-OA dissolved in 0.1 M phosphate buffer, pH 7.4, (B) NO2-OA dissolved in deionized water and (C) chemical NO-generator, sodium-nitroprusside (SNP).
Fig. 10
Fig. 10
Time stability of 8 μM NO2-OA monitored via a decrease in CPS peak NO. CPS analysis of NO2-OA stability was performed directly in supporting electrolyte at (A) pH 5, (B) 7.4 and (C) 9; time of accumulation 30 s at open current circuit was used, Istr −35 μA. Black dots = control = newly prepared (fresh) NO2-OA solution at concentration of 8 μM. For more details, see Fig. 2A.

References

    1. Egea J., Fabregat I., Frapart Y.M., et al. European contribution to the study of ROS: a summary of the findings and prospects for the future from the COST action BM1203 (EU-ROS) Redox Biol. 2017;13:94–162. - PMC - PubMed
    1. Groeger A.L., Freeman B.A. Signaling actions of electrophiles: anti-inflammatory therapeutic candidates. Mol. Interv. 2010;10:39–50. - PMC - PubMed
    1. Liebler D.C. Protein damage by reactive electrophiles: targets and consequences. Chem. Res. Toxicol. 2008;21:117–128. - PMC - PubMed
    1. Tornqvist M., Fred C., Haglund J., Helleberg H., Paulsson B., Rydberg P. Protein adducts: quantitative and qualitative aspects of their formation, analysis and applications. J. Chromatogr. B. 2002;778:279–308. - PubMed
    1. Turell L., Vitturi D.A., Coitino E.L., Lebrato L., Moller M.N., Sagasti C., Salvatore S.R., Woodcock S.R., Alvarez B., Schopfer F.J. The chemical basis of thiol addition to nitro-conjugated linoleic acid, a protective cell-signaling lipid. J. Biol. Chem. 2017;292:1145–1159. - PMC - PubMed

Publication types