. 2019 Jun;12(6):e005407.
doi: 10.1161/CIRCHEARTFAILURE.118.005407. Epub 2019 Jun 7.

Epidemiology of Cardiac Amyloidosis-Associated Heart Failure Hospitalizations Among Fee-for-Service Medicare Beneficiaries in the United States

Affiliations

Epidemiology of Cardiac Amyloidosis-Associated Heart Failure Hospitalizations Among Fee-for-Service Medicare Beneficiaries in the United States

Lauren G Gilstrap et al. Circ Heart Fail. 2019 Jun.

Abstract

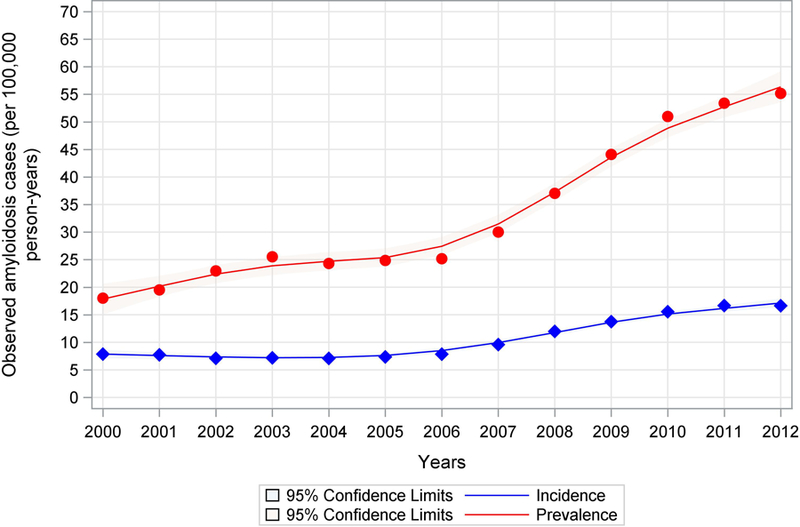
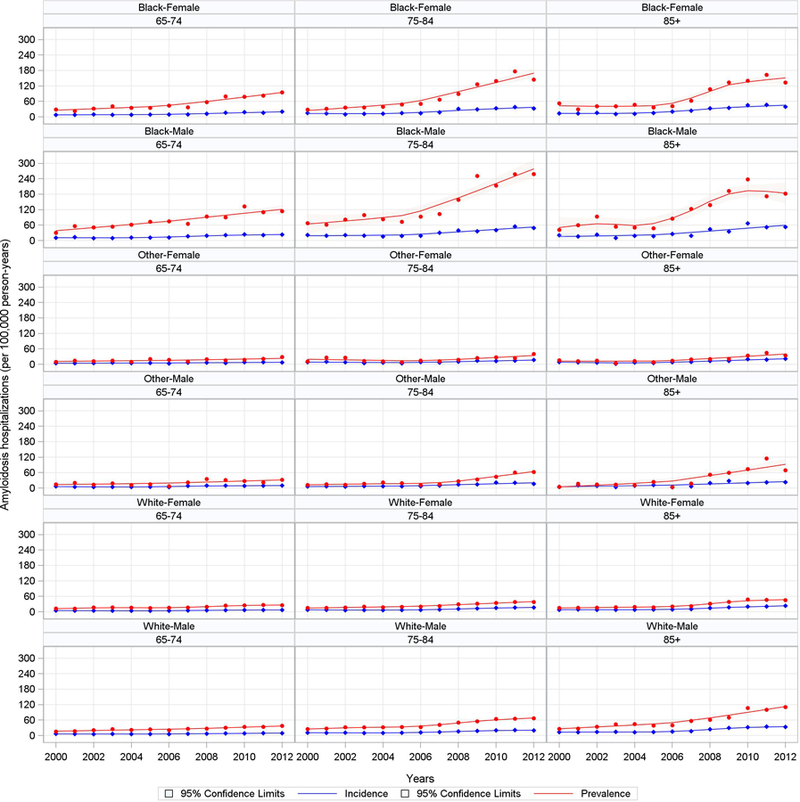
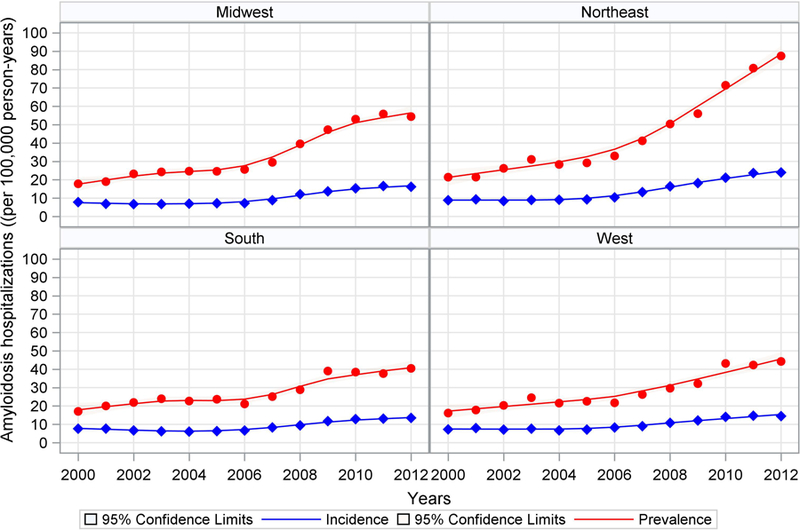
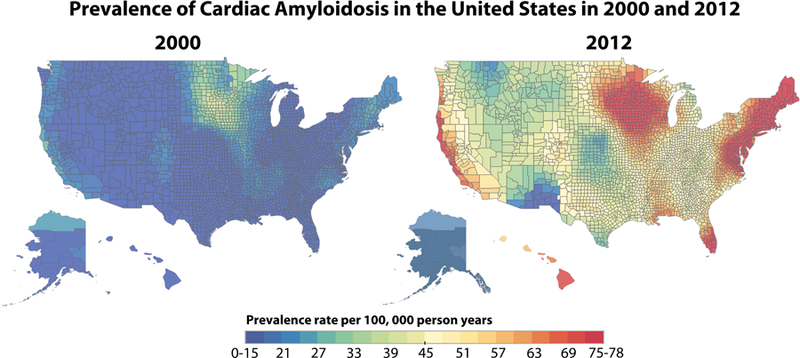
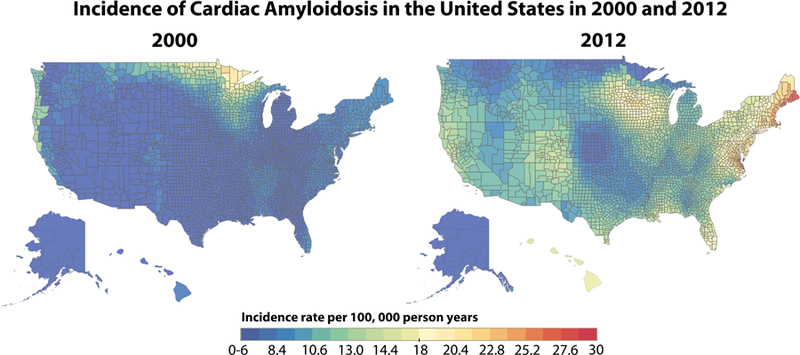
Background Cardiac amyloidosis is a substantially underdiagnosed disease, and contemporary estimates of the epidemiology of amyloidosis are lacking. This study aims to determine the incidence and prevalence of cardiac amyloidosis among Medicare beneficiaries from 2000 to 2012. Methods and Results Medicare beneficiaries were counted in the prevalence cohort in each year they had (1) ≥1 principal or secondary International Classification of Diseases, Ninth Revision code for amyloidosis and (2) ≥1 principal or secondary International Classification of Diseases, Ninth Revision code for heart failure or cardiomyopathy within 2 years after the systemic amyloidosis code. A beneficiary was counted in the incidence cohort only during the first year in which they met criteria. Primary outcomes included the prevalence and incidence of hospitalizations for cardiac amyloidosis. There were 4746 incident cases of cardiac amyloidosis in 2012 and 15 737 prevalent cases in 2012. There was also a significant increase in the prevalence rate (8 to 17 per 100 000 person-years) and incidence rate (18 to 55 per 100 000 person-years) from 2000 to 2012, most notable after 2006. Incidence and prevalence increased substantially more among men, the elderly, and in blacks. Conclusions The incidence and prevalence rates of cardiac amyloidosis are higher than previously thought. The incidence and prevalence rates of cardiac amyloidosis among hospitalized patients have increased since 2000, particularly among specific patient subgroups and after 2006, suggesting improved amyloidosis awareness and higher diagnostic rates with noninvasive imaging. In light of these trends, cardiac amyloidosis should be considered during the initial work up of patients ≥65 years old hospitalized with heart failure.

Keywords: Medicare; amyloidosis; heart failure; incidence; prevalence.


Figures

Figure 1
Figure 1. Incidence and Prevalence Trends of Hospitalization for Cardiac Amyloidosis, 2000–2012
This figure shows the increasing prevalence and incidence rates of hospitalization per 100,000 person years for cardiac amyloidosis between 2000 and 2012. The most notable rate of increase can be observed after 2006–2007. The red line represents the annual prevalence of hospitalization and the blue line represents the annual incidence of hospitalization. The shaded areas represent the 95% confidence intervals.
Figure 2
Figure 2. Variation in the Annual Number of Cardiac Amyloidosis-related Hospitalizations by Age, Sex and Race, 2000–2012
This figure shows the increasing frequency of all hospitalizations (prevalence) and first hospitalizations (incidence) of cardiac amyloidosis among predeteremined age and racial subgroups between 2000 and 2012. The most notable increases are observed among elderly black men and women. The red line shows the annual rate of all hospitalizations (prevalence) and the blue line shows the annual rate of first hospitalizations (incidence) for cardiac amyloidosis. The shaded areas represent the 95% confidence intervals.
Figure 3
Figure 3. Variation in the Annual Number of Cardiac Amyloidosis-related Hospitalizations by Geographic Region, 2000–2012
This figure shows the increasing frequency of all hospitalizaations (prevalence) and first hospitalizations (incidence) for cardiac amyloidosis by geographic regions between 2000 and 2012. The frequency of all hospitalizations increases in all geographic regions after 2006–2007. The steepest icnreases can be observed in the Midwest and Northeast. The red line shows the annual rate of all hospitalizations (prevalence) and the blue line shows the annual rate of first hospitalizations (incidence). The shaded areas represent the 95% confidence intervals.
Figure 4
Figure 4. Geographic Distribution of Cardiac Amyloidosis Prevalence, Incidence and Temporal Changes between 2000 and 2012
A: Geographic distribution of cardiac amyloidosis prevalence and temporal changes between 2000 and 2012. This figure shows the prevalence of hospitalization for cardiac amyloidosis between 2000 and 2012. The lower limit of prevalence on these maps (blue) is 0–15 cases per 100,000 person-years and the upper limit (red) is 75–78 cases per 100,000 person-years. B. Geographic distribution of cardiac amyloidosis incidence and temporal changes between 2000 and 2012. This figure shows the incidence of hospitalization for cardiac amyloidosis between 2000 and 2012. The lower limit of incidence on these maps (blue) is 0–6 cases per 100,000 person-years and the upper limit (red) is 30 cases per 100,000 person-years.

Comment in

References

    1. Maurer MS, Elliott P, Comenzo R, Semigran M and Rapezzi C. Addressing Common Questions Encountered in the Diagnosis and Management of Cardiac Amyloidosis. Circulation 2017;135:1357–1377. - PMC - PubMed
    1. Mohammed SF, Mirzoyev SA, Edwards WD, Dogan A, Grogan DR, Dunlay SM, Roger VL, Gertz MA, Dispenzieri A, Zeldenrust SR and Redfield MM. Left ventricular amyloid deposition in patients with heart failure and preserved ejection fraction. JACC Heart Fail 2014;2:113–22. - PMC - PubMed
    1. Dubrey SW, Cha K, Anderson J, Chamarthi B, Reisinger J, Skinner M and Falk RH. The clinical features of immunoglobulin light-chain (AL) amyloidosis with heart involvement. QJM : monthly journal of the Association of Physicians 1998;91:141–57. - PubMed
    1. Dharmarajan K and Maurer MS. Transthyretin cardiac amyloidoses in older North Americans. J Am Geriatr Soc 2012;60:765–74. - PMC - PubMed
    1. Muchtar E, Gertz MA, Kumar SK, Lacy MQ, Dingli D, Buadi FK, Grogan M, Hayman SR, Kapoor P, Leung N, Fonder A, Hobbs M, Hwa YL, Gonsalves W, Warsame R, Kourelis TV, Russell S, Lust JA, Lin Y, Go RS, Zeldenrust S, Kyle RA, Rajkumar SV and Dispenzieri A. Improved outcomes for newly diagnosed AL amyloidosis between 2000 and 2014: cracking the glass ceiling of early death. Blood 2017;129:2111–2119. - PMC - PubMed

Publication types