. 2019 Jul 17;103(2):217-234.e4.
doi: 10.1016/j.neuron.2019.05.002. Epub 2019 Jun 3.

SynGO: An Evidence-Based, Expert-Curated Knowledge Base for the Synapse

Frank Koopmans  1 Pim van Nierop  2 Maria Andres-Alonso  3 Andrea Byrnes  4 Tony Cijsouw  5 Marcelo P Coba  6 L Niels Cornelisse  7 Ryan J Farrell  8 Hana L Goldschmidt  9 Daniel P Howrigan  4 Natasha K Hussain  10 Cordelia Imig  11 Arthur P H de Jong  12 Hwajin Jung  13 Mahdokht Kohansalnodehi  14 Barbara Kramarz  15 Noa Lipstein  11 Ruth C Lovering  15 Harold MacGillavry  16 Vittoria Mariano  17 Huaiyu Mi  18 Momchil Ninov  14 David Osumi-Sutherland  19 Rainer Pielot  20 Karl-Heinz Smalla  20 Haiming Tang  18 Katherine Tashman  4 Ruud F G Toonen  7 Chiara Verpelli  21 Rita Reig-Viader  22 Kyoko Watanabe  23 Jan van Weering  7 Tilmann Achsel  17 Ghazaleh Ashrafi  8 Nimra Asi  4 Tyler C Brown  4 Pietro De Camilli  24 Marc Feuermann  25 Rebecca E Foulger  15 Pascale Gaudet  25 Anoushka Joglekar  26 Alexandros Kanellopoulos  17 Robert Malenka  27 Roger A Nicoll  28 Camila Pulido  8 Jaime de Juan-Sanz  8 Morgan Sheng  29 Thomas C Südhof  30 Hagen U Tilgner  26 Claudia Bagni  17 Àlex Bayés  22 Thomas Biederer  5 Nils Brose  11 John Jia En Chua  31 Daniela C Dieterich  20 Eckart D Gundelfinger  20 Casper Hoogenraad  16 Richard L Huganir  10 Reinhard Jahn  14 Pascal S Kaeser  12 Eunjoon Kim  13 Michael R Kreutz  3 Peter S McPherson  32 Ben M Neale  4 Vincent O'Connor  33 Danielle Posthuma  23 Timothy A Ryan  8 Carlo Sala  21 Guoping Feng  4 Steven E Hyman  4 Paul D Thomas  18 August B Smit  34 Matthijs Verhage  35
Affiliations

SynGO: An Evidence-Based, Expert-Curated Knowledge Base for the Synapse

Frank Koopmans et al. Neuron. .

Abstract

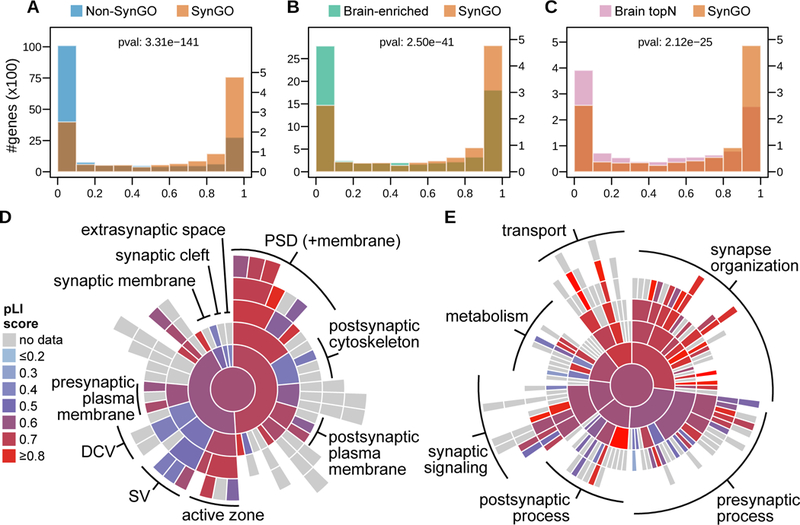
Synapses are fundamental information-processing units of the brain, and synaptic dysregulation is central to many brain disorders ("synaptopathies"). However, systematic annotation of synaptic genes and ontology of synaptic processes are currently lacking. We established SynGO, an interactive knowledge base that accumulates available research about synapse biology using Gene Ontology (GO) annotations to novel ontology terms: 87 synaptic locations and 179 synaptic processes. SynGO annotations are exclusively based on published, expert-curated evidence. Using 2,922 annotations for 1,112 genes, we show that synaptic genes are exceptionally well conserved and less tolerant to mutations than other genes. Many SynGO terms are significantly overrepresented among gene variations associated with intelligence, educational attainment, ADHD, autism, and bipolar disorder and among de novo variants associated with neurodevelopmental disorders, including schizophrenia. SynGO is a public, universal reference for synapse research and an online analysis platform for interpretation of large-scale -omics data (https://syngoportal.org and http://geneontology.org).

Keywords: Gene Ontology; enrichment study; gene annotation; gene set analysis; synapse; synaptic plasticity; synaptic proteome network; synaptome; synaptopathies.


Figures

Figure 1.
Figure 1.. Conceptual framework of synapse ontology in SynGO.
The top-level Cellular Component (location, shown in green) and Biological Process (function, shown in blue) terms are depicted in a schematic representation of a synapse. For the full set of ontology terms, which also include all subclassifiers that further specialize terms shown here, see Figure 2 and Supplementary Table 2. *The mitochondrion is depicted for completeness, but is not part of SynGO ontology (see text).
Figure 2.
Figure 2.. Increased resolution in synaptic ontology terms.
Comparison between new terms in SynGO (orange) and pre-existing synapse ontology terms in GO (green and purple) for A) Cellular Components (CC, locations) and B) Biological Processes (BP, functions). SynGO adds resolution by creating increasingly detailed terms in a consistent systematic for Cellular Component (129 new terms) and Biological Process (212 new terms). Some existing GO terms identical to SynGO ontologies were re-used (green nodes, 13 for CC and 44 for BP) and some existing GO synapse-related terms that did not overlap with the SynGO ontologies were discarded or replaced (purple nodes, 18 for CC and 22 for BP). Supplementary Table 1 contains a complete list of pre-existing GO terms indicated in green and purple. SynGO ontology terms shown in panels A and B (in orange or green) that were populated with at least one gene annotation in SynGO v1.0 were visualized as ‘sunburst plots’, an alternative representation of tree structures, for C) Cellular Components and D) Biological Processes. The top-level terms in these CC and BP ontology trees, ‘synapse’ and ‘process in the synapse’ respectively, are represented by a white circle in the center of the sunburst. Terms on the second level of the ontology term tree, previously highlighted in A and B, are color coded as indicated in the legend. Subclassifiers in outer circles are shown in progressive darker colors. Supplementary Table 2 contains the complete list of SynGO ontology terms matching the sunburst plots.
Figure 3.
Figure 3.. Gene features compared between synaptic genes and the rest of the genome.
A) Total gene length, B) cDNA length, C) number of known protein coding splice variants, D) total length of protein coding transcripts, E) number of introns in protein coding transcripts and F) mean length of introns in protein coding transcripts. Vertical lines indicate median values for respective data distributions, which were also used to compute the percentage increase for synaptic genes. Two-sample student’s t-test were applied to log transformed data to confirm overall distributions are significantly distinct, a Wilcoxon rank-sum test was used for the count data in panels C and E, “pval” in each panel denotes the resulting p-values. Analogous comparison between SynGO and brain-enriched or brain most-expressed genes is shown in Supplementary Figure S4.
Figure 4.
Figure 4.. Synaptic genes are exceptionally well conserved.
(A) Cumulative distribution of synaptic genes (orange) and all human genes (blue), by gene age. Highlighted areas (grey) show periods of rapid gain of synaptic genes. Ages (time in Million Years Ago) are obtained from dating of gene duplication events (relative to speciation events) in PANTHER gene trees (Mi et al., 2018). Clades are shown on the y-axis, their names on the left and estimated speciation times on the right. LCA: Last Common Ancestor. LUCA: Last Universal Common Ancestor. Eras; CE: Cenozoic, ME: Mesozoic, PA: Paleozoic, NPR: Neo-Proterozoic, MPR: Meso-Proterozoic, EO: Eoarchean. Periods; NE: Neogene, PA: Paleogene, CRE: Cretaceous, JU: Jurassic, PE: Pennsylvanian, MI: Mississipian, DE: Devonian, CRY: Cryogenian, TO: Tonian, ST: Stenian, CA: Calymmian. Note that unlike the phylostratigraphic approach (Domazet-Lošo et al., 2007), ages reflect not simply the oldest traceable gene age, but explicitly consider gene duplication, by adding a fractional count for each duplication event along the evolutionary path to a modern gene (see Methods for details). This is critical due to the prevalence of gene duplication in the evolution of eukaryotic genomes. (B) Evolution of the family of genes containing CPT1C (highlighted in grey), a synaptic gene annotated in SynGO. There are three tissue-specific isoforms in this family; CPT1A (liver), CPT1B (muscle) and CPT1C (brain). The latter is only found in placental mammals. C) Orthology relations between human genes and their counterparts in Caenorhabditis elegans and Drosophila melanogaster were classified by the number of paralogs matching respective organisms. For example, the many-to-one group contains all human genes that have undergone gene duplication from their ancestral gene while the given model organism has not.
Figure 5.
Figure 5.. Gene pLI scores, indicating probability of intolerance to Loss of Function (LoF) mutation.
pLI scores compared between synaptic genes and A) rest of the genome, B) brain enriched genes and C) 1112 genes most highly expressed in brain. Two-sample Wilcoxon signed-rank test p-values indicate that overall distributions are significantly different (denoted as “pval” in panels A-C). Mean pLI scores for respective synaptic genes annotated against D) SynGO Cellular Component terms and E) Biological Process terms are visualized in a sunburst plot, for terms with at least 5 unique annotated genes with a pLI score. Terms where annotated genes are typically LoF tolerant are shown in blue, while terms with mostly LoF intolerant genes are shown in red. Note that the CC and BP sunburst plots are aligned with Figures 2C and 2D, respectively.
Figure 6.
Figure 6.. Representation of SynGO proteins in large scale proteomic analyses of synaptic (sub-)fractions.
Proteins identified in a selection of published proteomic analyses of biochemically purified synaptic fractions (synaptosomes, postsynaptic densities (PSD) and active zone) were analyzed for SynGO annotated proteins. A) The number of unique proteins detected in the selected studies, blue: synaptosomes; green: PSD; pink: active zone, orange: subset of proteins that are CC annotated in SynGO. B) overlap among SynGO CC annotated proteins (orange) and ‘consensus sets’ for synaptosome (blue), PSD (green) or active zone (pink), defined as proteins identified in at least three datasets described in panel A (matching respective compartments). Supplementary Table 4 details the selected proteomics studies and their identified proteins.
Figure 7.
Figure 7.. Enrichment study of SynGO genesets in GWAS.
A) Magma analysis of Autism Spectrum Disorder revealed enrichment of SynGO Cellular Components (light blue) and Biological Processes (light green). Conditioning by gene expression values (GTEx) typically reduced the signal, except for postsynaptic ribosome, as visualized in dark blue and dark green. Only SynGO ontology terms significant after Bonferroni correction at α 0.05 (Pbon=0.05/154, vertical dashed line) in the latter analysis are shown. B) Overview of significantly enriched SynGO ontology terms in various GWAS. P-values from Magma analysis, with conditioning by gene expression values, were color-coded from blue to red for all ontology terms significant after Bonferroni correction at α 0.05. Additional studies are available in Supplementary Figure S10 and Supplementary Table 6.
Figure 8.
Figure 8.. Enrichment for protein truncating (PTV) and missense mutations in SynGO genes.
A) synaptic genes are more enriched for PTV and missense mutations among patients with brain disorders compared to the control set of GTEx brain expressed genes of equal size and compared to pre-existing synaptic annotations in GO. For each comparison the p-values from a binomial test against mutation model expectation are shown as text, their median fold-enrichment as a circle (color coded by gene set) and the 10~90% quantile of fold-enrichment as a horizontal line. Patient populations with brain disorders: Developmental Delay (DD), Intellectual Disability (ID), Autism (ASD) and Schizophrenia (SCZ). As a control group we included patient populations with non-syndromic Coronary Heart Disease (CHD-NS) or unaffected siblings (UNAFF-SIB). B) Group-level effects were tested for the patient populations described in panel A. The median disease p-value per ontology term (with at least 5 unique annotated genes) was visualized for C) Cellular Components and D) Biological Processes. Note that the CC and BP sunburst plots are aligned with Figures 2C and 2D, respectively.

References

    1. Abdou K, Shehata M, Choko K, Nishizono H, Matsuo M, Muramatsu SI, and Inokuchi K (2018). Synapse-specific representation of the identity of overlapping memory engrams. Science 360, 1227–1231. - PubMed
    1. Abul-Husn NS, Bushlin I, Moron JA, Jenkins SL, Dolios G, Wang R, Iyengar R, Ma’ayan A, and Devi LA (2009). Systems approach to explore components and interactions in the presynapse. Proteomics 9, 3303–3315. - PMC - PubMed
    1. Arnsten AF, Wang MJ, and Paspalas CD (2012). Neuromodulation of thought: flexibilities and vulnerabilities in prefrontal cortical network synapses. Neuron 76, 223–239. - PMC - PubMed
    1. Ashburner M, Ball CA, Blake JA, Botstein D, Butler H, Cherry JM, Davis AP, Dolinski K, Dwight SS, Eppig JT, et al. (2000). Gene ontology: tool for the unification of biology. The Gene Ontology Consortium. Nature genetics 25, 25–29. - PMC - PubMed
    1. Bayes A, Collins MO, Croning MD, van de Lagemaat LN, Choudhary JS, and Grant SG (2012). Comparative study of human and mouse postsynaptic proteomes finds high compositional conservation and abundance differences for key synaptic proteins. PLoS One 7, e46683. - PMC - PubMed

Publication types