. 2019 Jul 17;103(2):292-308.e4.
doi: 10.1016/j.neuron.2019.05.003. Epub 2019 Jun 3.

Accurate Estimation of Neural Population Dynamics without Spike Sorting

Affiliations

Accurate Estimation of Neural Population Dynamics without Spike Sorting

Eric M Trautmann et al. Neuron. .

Abstract

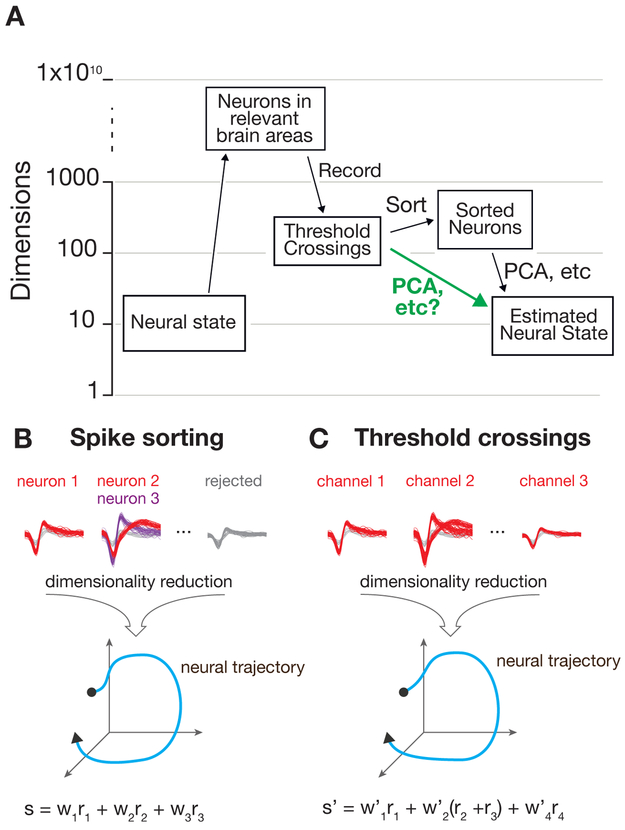
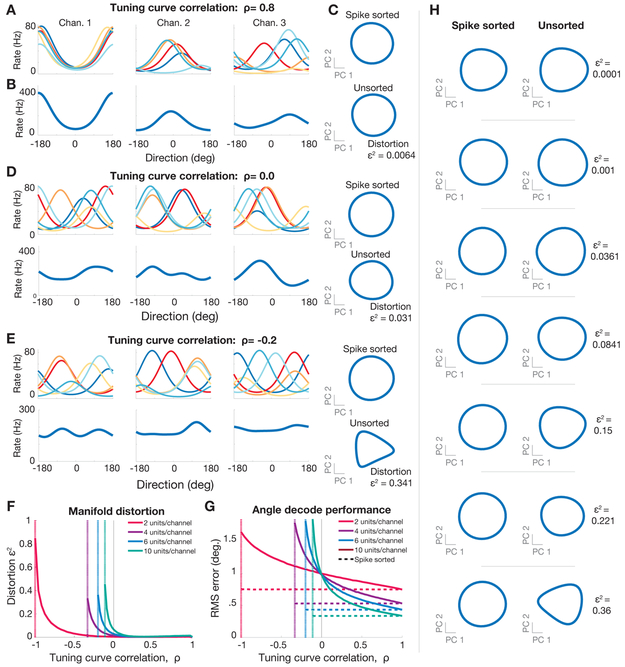
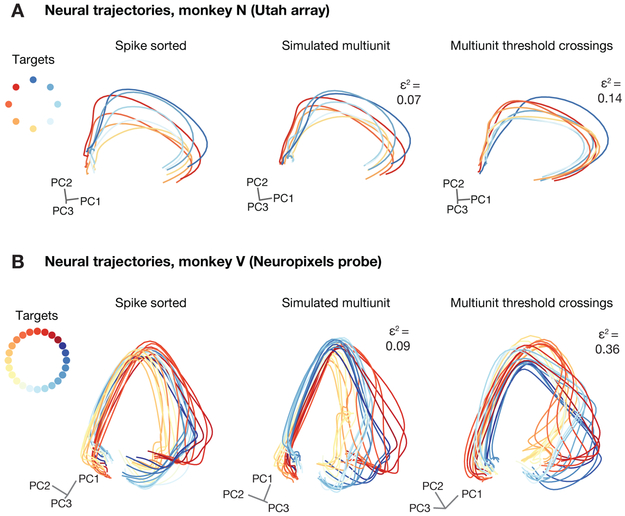
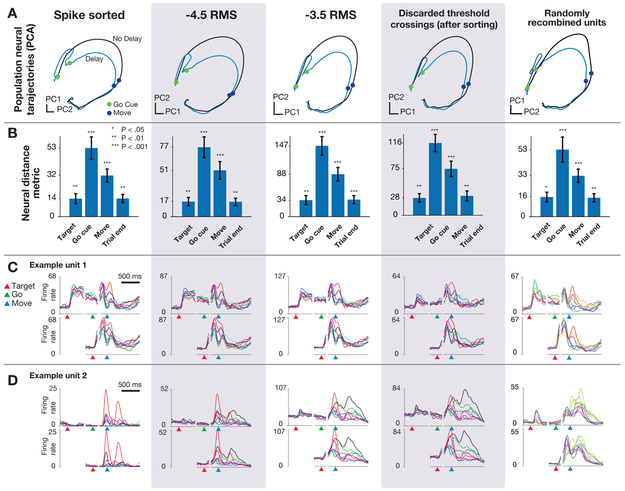
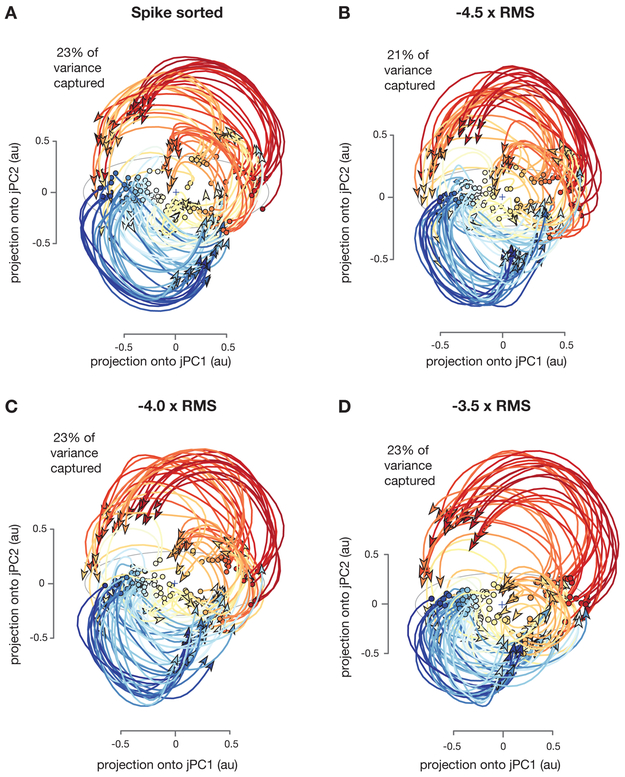
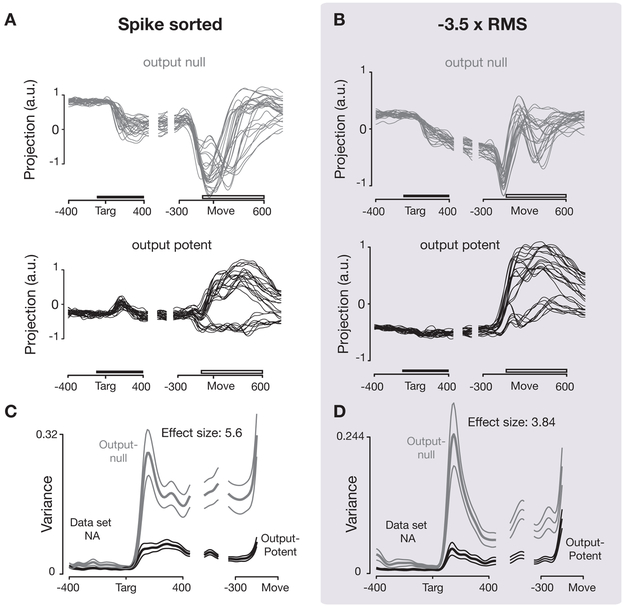
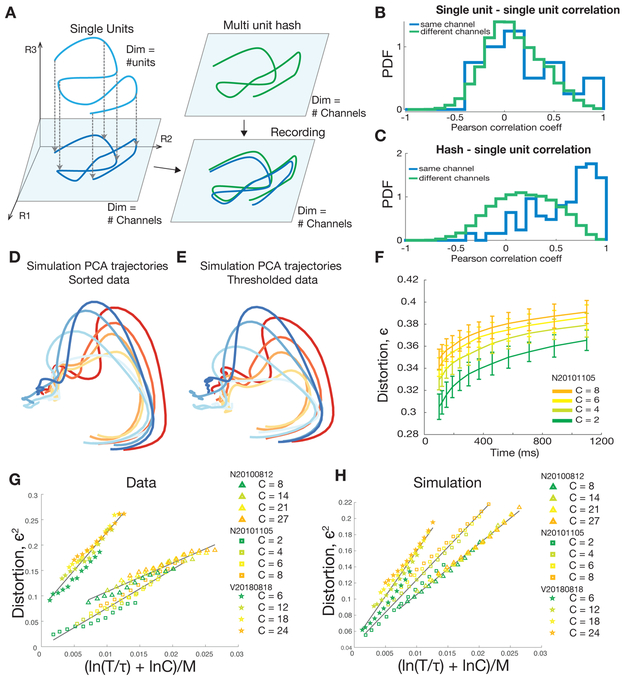
A central goal of systems neuroscience is to relate an organism's neural activity to behavior. Neural population analyses often reduce the data dimensionality to focus on relevant activity patterns. A major hurdle to data analysis is spike sorting, and this problem is growing as the number of recorded neurons increases. Here, we investigate whether spike sorting is necessary to estimate neural population dynamics. The theory of random projections suggests that we can accurately estimate the geometry of low-dimensional manifolds from a small number of linear projections of the data. We recorded data using Neuropixels probes in motor cortex of nonhuman primates and reanalyzed data from three previous studies and found that neural dynamics and scientific conclusions are quite similar using multiunit threshold crossings rather than sorted neurons. This finding unlocks existing data for new analyses and informs the design and use of new electrode arrays for laboratory and clinical use.

Keywords: brain computer interface; dimensionality reduction; neural dynamics; neural implant; neural signal processing; neural trajectories; neurophysiology; random projections; spike sorting.


Conflict of interest statement

Declaration of Interests

K.V.S. is a consultant to CTRL-Labs and Neuralink Inc. and on the Scientific Advisory Boards of Cognescent and Heal; these entities in no way influenced or supported this work.

Figures

Figure 1:
Figure 1:. Estimation of neural dynamics using multi-unit threshold crossings.
A) Data acquisition and pre-processing steps. The experimentally measured dimensionality of neural activity in the motor system suggests that a small number of latent factors (typically 8-12 in the primate motor system for simple behavioral tasks) captures the majority of task-relevant neural variability. In most experiments, neural recordings are sparsely sampled from up to a few hundred or thousand neurons in systems containing many millions of neurons. B,C) Standard practice is to sort spikes from individual neurons using action potential waveforms and perform dimensionality reduction on the smoothed firing rates of the isolated units. Here, we propose that for certain specific classes of analyses, it’s theoretically and pragmatically sensible to bypass the sorting step and perform dimensionality reduction or population-level analyses on voltage threshold crossings directly.
Figure 2:
Figure 2:. Simulation of neural manifold estimation without spike sorting for a simple 1D system
200 channels of simulated neural activity using simulated neurons with randomly generated tuning to a 1D parameter (e.g.: reach angle). Neurons tuning curves on each channel exhibit correlation ρ (see methods) and neurons on different channels are uncorrelated. (A) Tuning curves for three example channels with six units per channel with strongly correlated tuning (ρ = 0.8). (B) Multiunit tuning curves for each channel shown above. (C) (top) PCA-projected firing rate manifold, projected onto the first two principal components, estimated using simulated single units depicted in (A). (bottom) PCA-projected firing rate manifolds, estimated using multiunit channels depicted in (B). (D) As in (A,B,C), but with uncorrelated tuning curves (ρ = 0). (E) As in (A,B,C), but with anticorrelated tuning curves (ρ = −0.2). (F) Distortion of manifolds resulting from combining units for different single unit correlation strengths (see equation (2) in methods). Vertical dotted lines indicate the worst case anticorrelation. (G) Root mean square (RMS) error in estimating 1D parameter (direction) for different tuning correlation strengths. Dashed horizontal lines show the RMS error using spikes from separate units. Solid lines show the RMS error using multiunit channels. (H) Examples firing rate manifolds for spike sorted units (first column) and multiunit channels (second column) for various levels of distortion.
Figure 3:
Figure 3:. Neural trajectories from primate motor cortex during reaches are similar with and without spike sorting.
(A) Neural trajectories for delayed reaches to one of eight radial targets using manually sorted neurons (left) or unsorted multi-unit spikes (right) obtained by thresholding the voltage time-series at −4.5 × the root mean square (RMS) of the voltage time series. Trajectories display little distortion in the low-dimensional projections using PCA. Data collected using chronically implanted Utah microelectrode arrays. (B) Same as (A), for data collected using acute Neuropixels probes. Simulated multi-unit activity was generated by randomly combining the activity of between 1-4 sorted neurons per channel (without replacement).
Figure 4:
Figure 4:. Replication of “Neural population dynamics during reaching (Ames et al., 2014)”.
(A) Neural trajectories calculated using PCA on trial-averaged neural activity for reaches with and without delay period using hand sorted units, a more conservative threshold set at −4.5 × RMS, a more permissive threshold set at −3.5 × RMS, using only threshold crossings that were discarded after sorting, and when sorted units were randomly combined to simulate multi-unit channels. (B) The key results from (Ames et al., 2014): distance in full-dimensional neural space between trial-averaged neural trajectories of reaches when the monkey was or was not presented with a delay period. Note that the vertical axis is scaled between columns, illustrating that although ensemble firing rates are higher with more permissive thresholds, the key qualitative and quantitative features of the population neural response are conserved. (C) Example unit 1: PSTHs for center-out reaches to eight radially spaced targets. In this example, firing rates scale higher with a more permissive threshold, but the overall shape of the PSTHs are similar regardless of sorting or thresholding. (D) Example unit 2: Features of the PSTHs for this unit do change as a more permissive threshold is used. Despite this variation, the estimated neural state from the population response, as shown in A is largely invariant to the choice of threshold.
Figure 5:
Figure 5:. Replication of “Neural population dynamics during reaching” (Churchland, Cunningham et al., 2012
Neural trajectories from 108 conditions including straight and curved reaches using (A) Hand sorted units. (B-D) Unsorted multi-unit activity using a voltage threshold of −4.5, −4.0 and −3.5 × RMS. The total amount of variance captured in the top rotational plane and the qualitative features of neural population state space trajectories are similar across sorted units and all three threshold crossing levels.
Figure 6:
Figure 6:. Replication of “Cortical activity in the null space: permitting preparation without movement” (Kaufman et al., 2014).
Comparison of output-null and output-potent neural activity during preparing and then executing movements using the original sorted and newly re-analyzed thresholded data. (A) Neural activity in one output-null and output-potent dimension for one data set (NA), as in Figure 4A,B in (Kaufman et al., 2014). Activity is trial-averaged, and each trace presents the neural activity for one condition. The horizontal bars indicate the epoch in which the ratio of output-null and output-potent activities reported in panels C and D was calculated (left) and the epoch from which the dimensions were identified (right). (B) Same as (A), computed using activity thresholded at −3.5 × RMS. (C) Tuning depth at each time point in output null and output potent dimensions, as in Figure 4C in (Kaufman et al., 2014). (D) Same ac (C), computed using activity thresholded at −3.5 × RMS.
Figure 7:
Figure 7:. Random projection theory suggests spike sorting is often not necessary for population analyses.
(A) Schematic depiction of a projection of a trajectory through high-D firing rate space defined by single units, projected onto a subspace defined by the number of recording channels. A small amount of information is lost by combining units on each channel. Adding the contribution of multi-unit hash may introduced additional distortion to the estimated neural trajectories, though in practice this appears to be small. (B) Pearson correlation coefficient between single units on the same recording channel (blue) and different channels (green) for dataset N20101105. (C) Hash has a larger Pearson correlation coefficient (p < 0.05) with single units on the same channel (blue) than from other channels (green). Same dataset as (B). (D) PCA trajectories sampled from simulated random Gaussian manifolds were measured from (simulated) single neuron activities. Manifold mean and covariance were matched to those of neural activity from dataset N20101105 spike sorted data. (E) the same as (D) for threshold crossings data. (F) The maximum distortion of random one-dimensional manifolds under random projections of N = 125 neurons. The length of the manifolds, T (sec), and the number of manifolds, C, are varied with fixed correlation length, τ = 14.1. The 95th percentile of the distortions under 100 random projections is plotted (mean ± standard deviation for 50 repetitions). This collapses into a simple linear relationship when viewed as a function of ln (CT / τ), plotted for data (G) and for simulated random Gaussian manifolds (H).

Comment in

References

    1. Advani M, Lahiri S, & Ganguli S (2013). Statistical mechanics of complex neural systems and high dimensional data. J. Stat. Mech, 2013, P03014.
    1. Ajiboye AB, Willett FR, Young DR, Memberg WD, Murphy BA, Miller JP, Walter BL, Sweet JA, Hoyen HA, Keith MW, Peckham PH, Simeral JD, Donoghue JP, Hochberg LR, & Kirsch RF (2017). Restoration of reaching and grasping movements through brain-controlled muscle stimulation in a person with tetraplegia: a proof-of-concept demonstration. Lancet, 389, 1821–1830. - PMC - PubMed
    1. Ames KC, Ryu SI, & Shenoy KV (2014). Neural dynamics of reaching following incorrect or absent motor preparation. Neuron, 81, 438–451. - PMC - PubMed
    1. Baraniuk RG & Wakin MB (2009). Random projections of smooth manifolds. Foundations of Computational Mathematics, 9, 51–77.
    1. Bargmann C, Newsome W, Anderson A, Brown E, Deisseroth K, Donoghue J, MacLeish P, Marder E, Normann R, Sanes J, & Others (2014). BRAIN 2025: a scientific vision. Brain Research Through Advancing Innovative Neurotechnologies (BRAIN) Working Group Report to the Advisory Committee to the Director, NIH. Available online at: http://www.nih.gov/science/brain/2025/(US National Institutes of Health, 2014).

Publication types