. 2019 Dec;68(12):2214-2227.
doi: 10.1136/gutjnl-2018-317872. Epub 2019 Jun 6.

Glial cell line-derived neurotrophic factor (GDNF) mediates hepatic stellate cell activation via ALK5/Smad signalling

Affiliations

Glial cell line-derived neurotrophic factor (GDNF) mediates hepatic stellate cell activation via ALK5/Smad signalling

Le Tao et al. Gut. 2019 Dec.

Abstract

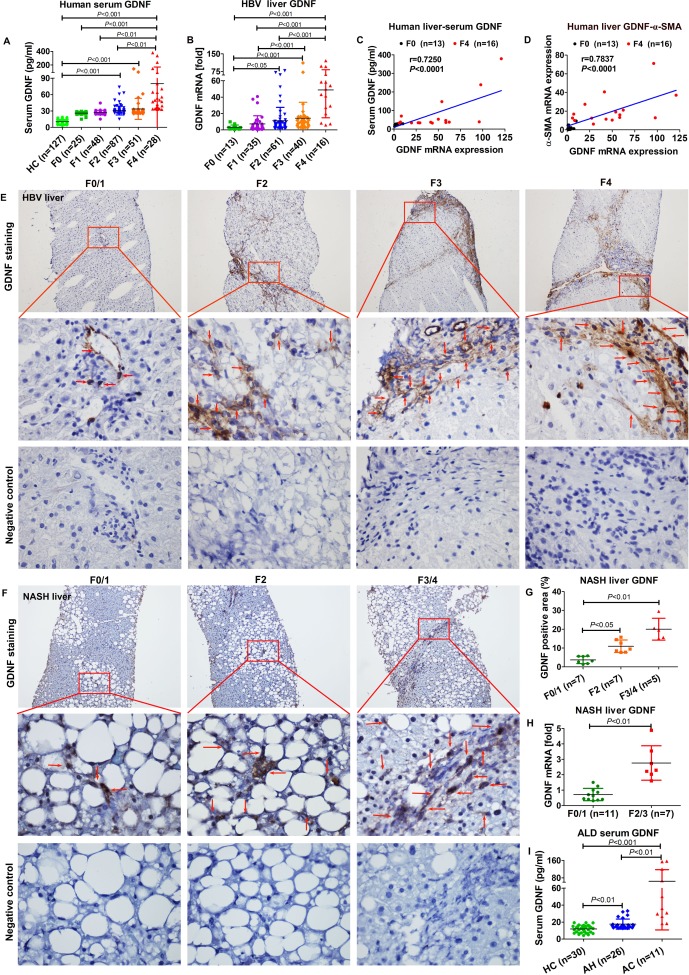
Objective: Although glial cell line-derived neurotrophic factor (GDNF) is a member of the transforming growth factor-β superfamily, its function in liver fibrosis has rarely been studied. Here, we investigated the role of GDNF in hepatic stellate cell (HSC) activation and liver fibrosis in humans and mice.

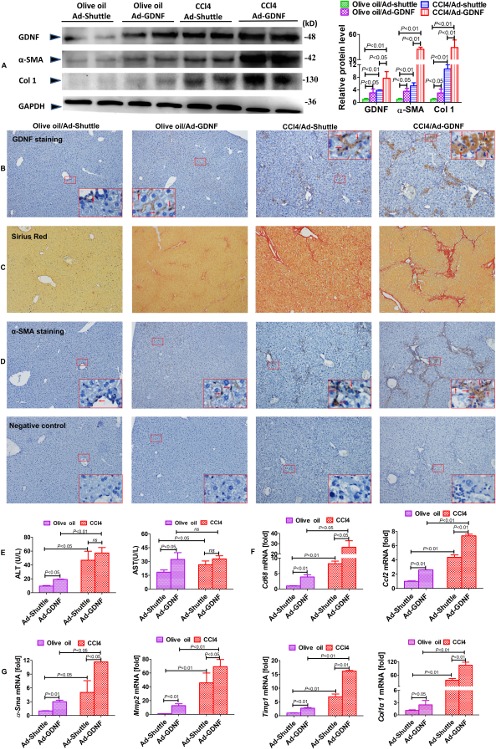
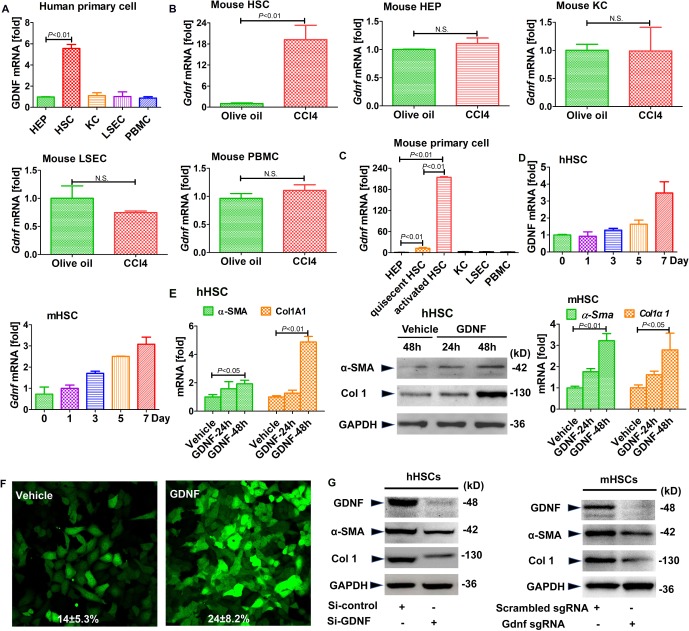
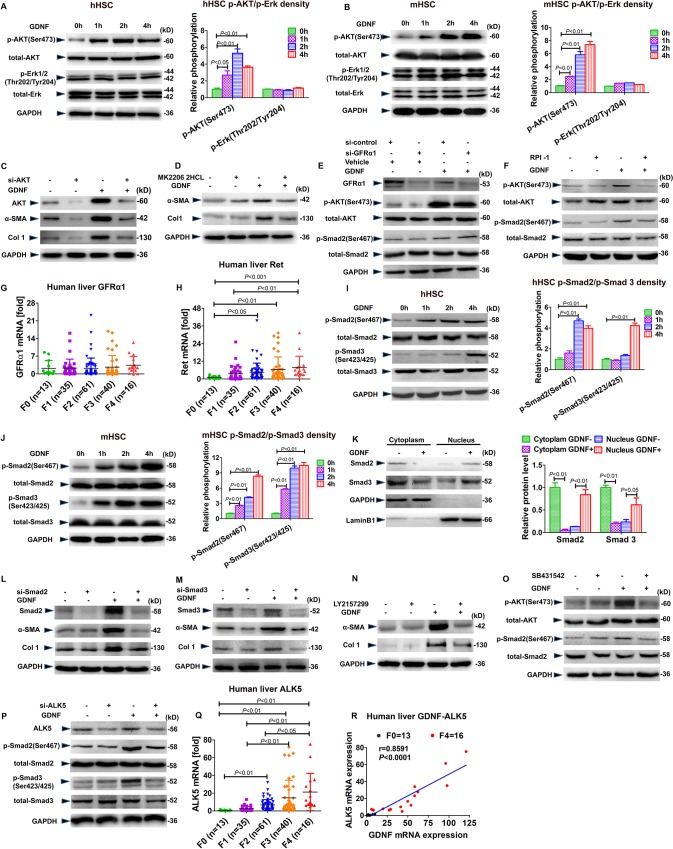
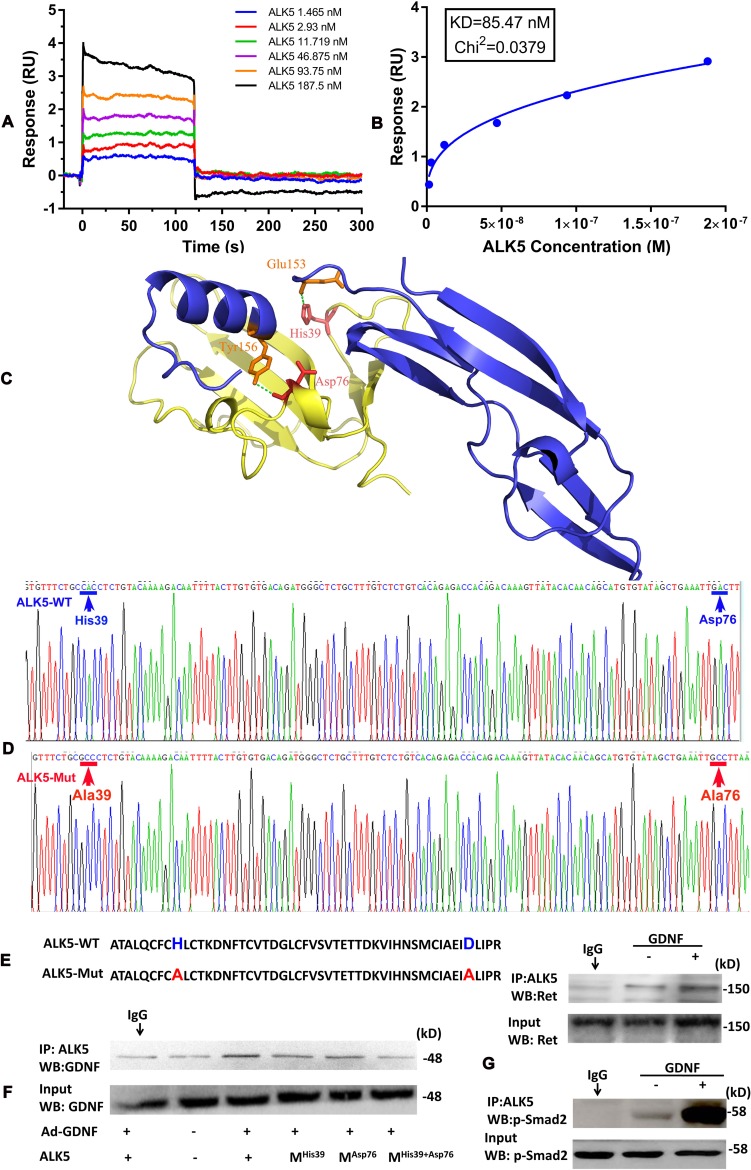
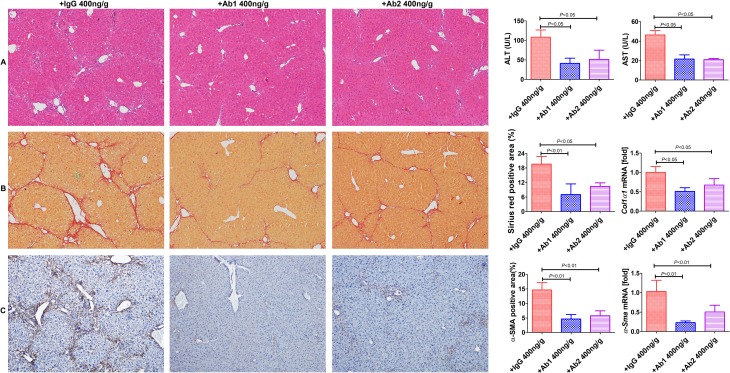
Design: GDNF expression was examined in liver biopsies and sera from patients with liver fibrosis. The functional role of GDNF in liver fibrosis was examined in mice with adenoviral delivery of the GDNF gene, GDNF sgRNA CRISPR/Cas9 and the administration of GDNF-blocking antibodies. GDNF was examined on HSC activation using human and mouse primary HSCs. The binding of activin receptor-like kinase 5 (ALK5) to GDNF was determined using surface plasmon resonance (SPR), molecular docking, mutagenesis and co-immunoprecipitation.

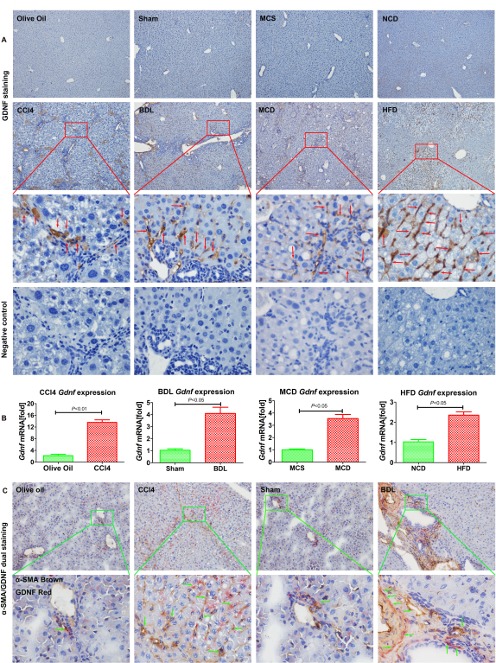
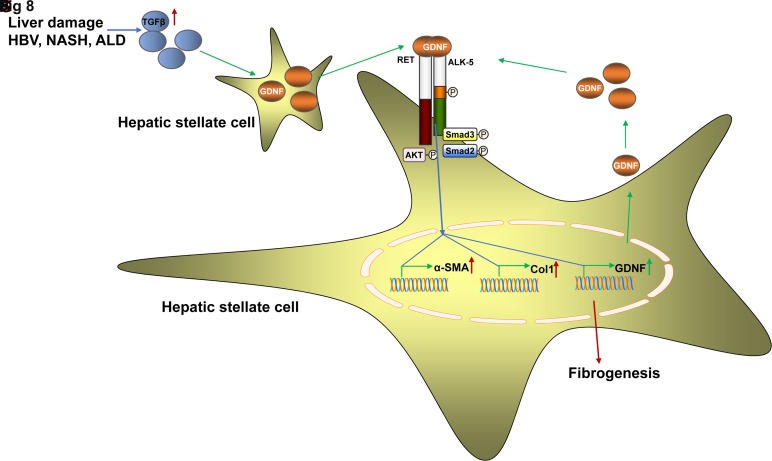
Results: GDNF mRNA and protein levels are significantly upregulated in patients with stage F4 fibrosis. Serum GDNF content correlates positively with α-smooth muscle actin (α-SMA) and Col1A1 mRNA in human fibrotic livers. Mice with overexpressed GDNF display aggravated liver fibrosis, while mice with silenced GDNF expression or signalling inhibition by GDNF-blocking antibodies have reduced fibrosis and HSC activation. GDNF is confined mainly to HSCs and contributes to HSC activation through ALK5 at His39 and Asp76 and through downstream signalling via Smad2/3, but not through GDNF family receptor alpha-1 (GFRα1). GDNF, ALK5 and α-SMA colocalise in human and mouse HSCs, as demonstrated by confocal microscopy.

Conclusions: GDNF promotes HSC activation and liver fibrosis through ALK5/Smad signalling. Inhibition of GDNF could be a novel therapeutic strategy to combat liver fibrosis.

Keywords: chronic liver disease; hepatic fibrosis; hepatic stellate cell.


Conflict of interest statement

Competing interests: None declared.

Figures

Figure 1
Figure 1
Glial cell line-derived neurotrophic factor (GDNF) expression in liver fibrosis. (A) GDNF concentrations in 366 human serum samples measured by ELISA (healthy control (HC)=127; F0=25; F1=48; F2=87; F3=51; F4=28). (B) GDNF mRNA in 165 human liver specimens examined by real-time PCR. The levels of target mRNAs were normalised to that of 18S rRNA (F0=13; F1=35; F2=61; F3=40; F4=16). (C) Correlation analysis between GDNF concentrations in the serum and GDNF mRNA expression. Spearman’s correlation coefficients (r), p values and the number of patients are indicated. (D) Correlation analysis between GDNF and α-SMA mRNA expression. Spearman’s correlation coefficients (r), p values and the number of patients are indicated. (E) Immunohistochemistry of GDNF in frozen liver sections of 40 HBV patient samples (F0/1=10; F2=10; F3=10; F4=10). Upper original magnification x100, middle x600, lower x600, negative control; the red arrow indicates GDNF-positive staining. (F) Immunohistochemistry of GDNF in liver paraffin sections of non-alcoholic steatohepatitis (NASH) patient samples (F0/1=7; F2=7; F3/4=5). Upper original magnification x100, middle x600, lower x600, negative control; the red arrow indicates GDNF-positive staining. (G) Semiquantification of GDNF from figure 1F. (H) Hepatic GDNF mRNA expression in patients with NASH. (I) GDNF concentrations in serum samples from 30 HCs and 37 patients with alcoholic liver disease (ALD), as measured by ELISA (HC=30; alcoholic hepatitis (AH)=26; alcoholic cirrhosis (AC)=11). Bars indicate the mean±SD of three independent experiments; one-way analysis of variance with the non-parametric Kruskal-Wallis test was used in A, B, G–I. A non-parametric correlation (Spearman’s) two-tailed test was used in C and D.
Figure 2
Figure 2
Glial cell line-derived neurotrophic factor (GDNF) is upregulated in mouse liver fibrosis. (A) Representative images of GDNF staining in mouse liver fibrosis from carbon tetrachloride (CCl4), BDL, methionine-choline-sufficient (MCS), methionine-choline-deficient (MCD), normal chow diet (NCD), high fat diet (HFD) samples. Original magnification x100, the third line is x600, fourth line is the negative control showing a serial section of the third line x600, the red arrow indicates GDNF-positive staining, n=5 per group. (B) Gdnf mRNA expression in whole liver of CCl4, BDL, MCD and HFD mice. Bars indicate the mean±SD of three independent experiments; n=5 per group; the t-test with the non-parametric Mann-Whiney U test was used. (C) Frozen mouse liver sections on dual α-SMA and GDNF immunohistochemistry (original magnification x100), the lower part represents the boxed area with x600 magnification, the green arrow indicates α-SMA and GDNF dual positive staining, n=5 per group.
Figure 3
Figure 3
Glial cell line-derived neurotrophic factor (GDNF) overexpression exacerbates carbon tetrachloride (CCl4)-induced liver fibrosis in mice. (A) GDNF, α-SMA and Col1 expression examined by immunoblotting and semiquantitative analysis. Liver samples were collected from CCl4-treated mice treated with Ad-GDNF or Ad-shuttle vectors (n=5 per group). Representative images of GDNF (B), Sirius red (C) and α-SMA staining and the negative control with the same location (D), with the red arrow denoting the α-SMA-positive staining (original magnification, x100). The larger box shows a x600 magnification of the small box (n=5 for each group). (E) Alanine aminotransferase (ALT) and aspartate aminotransferase (AST) levels in mouse serum samples (n=5 per group). mRNA expression of pro-inflammatory cytokines and chemokines (F), as well as fibrogenic parameters (G), examined by real-time PCR (n=5 per group). Bars indicate the mean±SD of three independent experiments; n=5 per group; one-way analysis of variance with the non-parametric Kruskal-Wallis test was used in parts A, E–G.
Figure 4
Figure 4
Glial cell line-derived neurotrophic factor (GDNF) induces hepatic stellate cell (HSC) activation in human HSCs. Gdnf mRNA expression as determined by real-time PCR. (A) The different types of liver cells were extracted from human liver samples. (B) Gdnf mRNA expression in primary HSCs, hepatocyte (HEPs), KCs and liver sinusoidal endothelial cell (LSECs) isolated from olive oil or carbon tetrachloride (CCl4)-treated mice aged 6 weeks. N.S., not significant. (C) Gdnf mRNA expression in 7-day-culture-activated mouse HSC compared with HEPs, KCs, LSECs and peripheral blood mononuclear cells (PBMC) (n=3 per group). (D) Gdnf mRNA expression in cultured human and mouse HSCs at the indicated time points. (E) Real-time PCR and western blot analysis for α-SMA and Col1A1. Human and mouse primary HSCs were treated with GDNF (10 ng/mL) for the indicated time intervals. (F) Effect of GDNF on fully activated HSCs. GFP-Col-HSCs were plated and cultured in 6-well plates for 2 hours and then treated with GDNF (10 ng/mL) for an additional 48 hours; the cells were analysed by fluorescence microscopy (original magnification, x200, n=3) and positive cells were counted (%). (G) Western blot analysis for α-SMA and Col1A1. Primary human and mouse HSCs were plated and cultured in 6-well plates overnight, followed by si-GDNF or sgGdnf RNA (2 multiple of infection (MOI)) for 48 hours. Bars indicate the mean±SD of three independent experiments; n=3 per group; one-way analysis of variance with the non-parametric Kruskal-Wallis test was used in parts A, C and E, and the t-test with the non-parametric Mann-Whiney U test was used in part B.
Figure 5
Figure 5
Glial cell line-derived neurotrophic factor (GDNF) induces hepatic stellate cell (HSC) activation via the activin receptor-like kinase 5 (ALK5)/Smad pathway. Western blot analysis for (p-)AKT and (p-)Erk and semiquantification. Human (A) and mouse (B) HSCs were treated with GDNF (10 ng/mL) for the indicated time. (C) Western blot analysis for α-SMA and Col1A1. AKT small interfering RNA (siRNA) was transfected into human HSCs for 12 hours and then the cells were treated with 10 ng/mL GDNF for an additional 48 hours. (D) Western blot analysis for α-SMA and Col1A1. Human HSCs were treated with MK2206 2HCL (0.5 µM) for 1 hour, followed by 10 ng/mL GDNF for an additional 48 hours. (E) Western blot analysis for (p-)AKT and (p-)Smad2. Human HSCs were transfected with GFRα1 siRNA for 48 hours and subsequently treated with 10 ng/mL GDNF for an additional 2 hours. (F) Western blot analysis for (p-)AKT and (p-)Smad2. Human HSCs were treated with RPI-1 (60 µM) for 1 hour, followed by treatment with 10 ng/mL GDNF for additional 2 hours. (G, H) GFRα1 and Ret mRNA expression in 165 human liver specimens. The levels of target mRNAs were normalised to that of 18S rRNA (F0=13; F1=35; F2=61; F3=40; F4=16). (I, J) Western blot analysis for (p-)Smad2 and (p-)Smad3 and semiquantification. Human (I) and mouse (J) HSCs were treated with GDNF (10 ng/mL) as indicated. (K) Western blot analysis for Smad2 and Smad3. Human HSCs were treated with GDNF (10 ng/mL) for 2 hours, and nuclear and cytoplasmic extracts were tested for Smad2/3 levels. (L, M) Western blot analysis for α-SMA and Col1A1. Human HSCs were transfected with siRNA for Smad2 or Smad3 for 12 hours and then treated with GDNF (10 ng/mL) for additional 48 hours. (N) Western blot analysis for α-SMA and Col1A1. Human HSCs were treated with LY2157299 (0.5 µM) for 1 hour and then GDNF (10 ng/mL) for an additional 48 hours. (O) Western blot analysis for (p-)AKT and (p-)Smad2. Human HSCs were treated with SB431542 (10 µM) for 1 hour and then GDNF (10 ng/mL) for an additional 2 hours. (P) Western blot analysis for (p-)Smad2 and (p-)Smad3. Human HSCs were transfected with ALK5 siRNA for 12 hours and then GDNF (10 ng/mL) for an additional 48 hours. (Q, R) mRNA expression of ALK5 in 165 human liver specimens. The level of ALK mRNAs was normalised to that of 18S rRNA (F0=13; F1=35; F2=61; F3=40; F4=16). Correlation analysis between ALK5 and GDNF mRNA expression in patients with liver fibrosis. Spearman’s correlation coefficients (r), p values and the number of patients are indicated. Bars indicate the mean±SD of three independent experiments; n=3 per group; one-way analysis of variance with the non-parametric Kruskal-Wallis test was used in parts A, B, G–I, J and K, and the non-parametric correlation (Spearman’s) two-tailed test was used in part R.
Figure 6
Figure 6
Determination of two critical sites of activin receptor-like kinase 5 (ALK5) for glial cell line-derived neurotrophic factor (GDNF) binding. (A) The binding affinity of GDNF to ALK5 was determined using surface plasmon resonance (SPR). (B) The dissociation constant (KD) of GDNF and ALK5 was calculated by non-linear regression analysis. GDNF bound to ALK5 with a KD value of 85.47 nM. (C) The complex of ALK5 and GDNF was generated by in silico estimation using a rigid-body docking approach with PatchDock software (http://bioinfo3d.cs.tau.ac.il/PatchDock/). (D) Expression plasmid sequences of ALK5-wt and ALK5-mut were validated. (E) ALK5-wt and ALK5-mut amino acid sequences. (F) co-immunoprecipitation (co-IP) analysis of ALK5/GDNF interaction comparing wt and His39 and Asp76 mutated ALK5. LX2 cells were transfected with pcDNA3-ALK5 plasmids for 12 hours and subsequently treated with Ad-GDNF for an additional 48 hours. (G) Direct interaction of ALK5 with Ret after GDNF stimulation. After IP with an anti-ALK5 antibody, immunoblotting for Ret was performed. (H) Direct interaction of ALK5 with p-Smad2 after GDNF stimulation. After IP with an anti-ALK5 antibody, immunoblotting for p-Smad2 was performed.
Figure 7
Figure 7
Administration of anti-glial cell line-derived neurotrophic factor (anti-GDNF) antibodies reduces liver fibrosis development in mice. (A) Anti-GDNF-blocking antibodies blunted carbon tetrachloride (CCl4)-induced liver injury (intraperitoneal injections; Ab1: 400 ng/g BW; Ab2: 400 ng/g BW administered for 3 weeks (once a week), starting from the second week after CCl4 treatment); controls were treated with IgG (400 ng/g BW). (B, C) Sirius red and α-SMA staining (original magnification, ×100). The positive stained area was calculated as a percentage. Col1α1 and α-Sma mRNA expression levels are shown as the fold downregulation in comparison to untreated animals. Bars indicate the mean±SD of three independent experiments; n=6 per group; one-way analysis of variance with the non-parametric Kruskal-Wallis test was used in parts A–C.
Figure 8
Figure 8
The glial cell line-derived neurotrophic factor (GDNF)/activin receptor-like kinase 5 (ALK5)/Ret/Smad2/3 circuit promotes hepatic stellate cell (HSC) activation. (A) Real-time PCR Gdnf mRNA detection after transforming growth factor-β (TGFβ) treatment in human and mouse HSCs. (B) Real-time PCR for Tgfβ and Gdnf mRNA in carbon tetrachloride (CCl4)-induced liver fibrosis. (C) GDNF mRNA was not induced in response to TGFβ and GDNF stimulation, when Smad2/3 were depleted using specific small interfering RNAs in LX2 cells. (D) Schematic diagram of the putative Smad2/3 binding site within the human GDNF promoter. LX2 cells were subjected to ChIP assays with anti-Smad2/3 or IgG antibodies. Representative results from three independent experiments are shown. mRNA expression of Smad2 (E) and Smad3 (F) in 165 human liver specimens. The levels of Smad2/3 mRNAs were normalised to that of 18S rRNA (F0=13; F1=35; F2=61; F3=40; F4=16). Correlation analysis between Smad2/3 and GDNF mRNA expression in patients with liver fibrosis. Spearman’s correlation coefficients (r), p values and the number of patients are indicated. Bars indicate the mean±SD of three independent experiments; n=3 per group; the t-test with the non-parametric Mann-Whiney U test was used in part A, one-way analysis of variance with the non-parametric Kruskal-Wallis test was used in parts C and E, and the non-parametric correlation (Spearman’s) two-tailed test was used in parts E and F. (G) Graphical summary of GDNF fibrogenic signalling in HSCs. HSCs express the GDNF receptors GFRα1 and Ret, whereas only Ret is upregulated in patients with liver fibrosis. GDNF induces AKT and Smad2/3 phosphorylation as a short-term response. As downstream events, GDNF induces GDNF transcription as an autocrine feedback stimulation and fibrogenic gene expression, as exemplified by α-SMA and Col1. ALK5 and Ret, but not GFRα1, are required for AKT/Smad2/3 activation and subsequent GDNF and α-SMA/Col1 expression. ALD, alcoholic liver disease; NASH, non-alcoholic steatohepatitis.

Similar articles

Cited by

References

    1. Le Guilcher C, Garcin I, Dellis O, et al. . The P2X4 purinergic receptor regulates hepatic myofibroblast activation during liver fibrogenesis. J Hepatol 2018;69:644–53. 10.1016/j.jhep.2018.05.020 - DOI - PubMed
    1. Kuntzen C, Schwabe RF. Gut microbiota and Toll-like receptors set the stage for cytokine-mediated failure of antibacterial responses in the fibrotic liver. Gut 2017;66:396–8. 10.1136/gutjnl-2016-312486 - DOI - PubMed
    1. Seki E, De Minicis S, Osterreicher CH, et al. . TLR4 enhances TGF-beta signaling and hepatic fibrosis. Nat Med 2007;13:1324–32. 10.1038/nm1663 - DOI - PubMed
    1. Lai KKY, Kweon SM, Chi F, et al. . Stearoyl-CoA desaturase promotes liver fibrosis and tumor development in mice via a wnt positive-signaling loop by stabilization of low-density lipoprotein-receptor-related proteins 5 and 6. Gastroenterology 2017;152:1477–91. 10.1053/j.gastro.2017.01.021 - DOI - PMC - PubMed
    1. Lua I, Li Y, Zagory JA, et al. . Characterization of hepatic stellate cells, portal fibroblasts, and mesothelial cells in normal and fibrotic livers. J Hepatol 2016;64:1137–46. 10.1016/j.jhep.2016.01.010 - DOI - PMC - PubMed

Publication types

MeSH terms

Substances