

Comment
doi: 10.1083/jcb.201801214.
Epub 2019 Jun 6.
Phosphorylation of G3BP1-S149 does not influence stress granule assembly
Affiliations
- PMID: 31171631
- PMCID: PMC6605800
- DOI: 10.1083/jcb.201801214
Item in Clipboard
Comment
Phosphorylation of G3BP1-S149 does not influence stress granule assembly
J Cell Biol.
.
Abstract
Tourrière et al. (2013. J. Cell Biol. https://doi.org/10.1083/jcb.200212128) reported that G3BP1-S149 dephosphorylation promotes stress granule formation. We show that constructs used to establish this conclusion contain additional mutations causing these phenotypes, and that S149 phosphorylation status does not change upon stress.
© 2019 Panas et al.
Figures
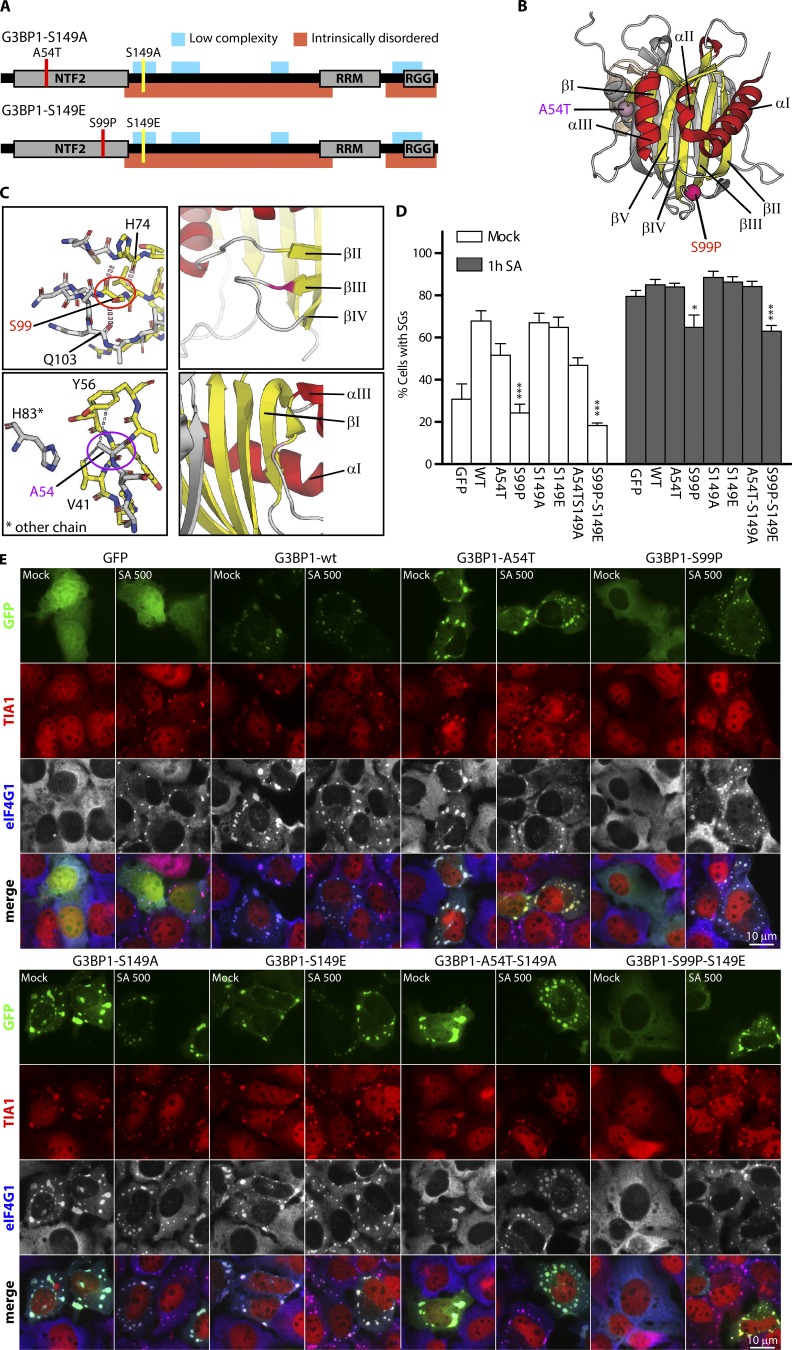
G3BP1-S99P and G3BP1-S99P-S149E mutants exhibit both impaired SG nucleation and recruitment to SGs in U2OS cells. (A) Schematic showing additional mutations A54 to T (red) or S99 to P (red). S149 appears yellow. Gray represents structured domains; red indicates intrinsically disordered/intrinsically unstructured regions; aqua represents LC regions. (B) NTF2-like domain crystal structure. The Cα atoms of A54T and S99P are highlighted in purple and red spheres. Strands, helices, and loop regions appear yellow, red, and light gray. (C) Close-up view. Oxygen (red) and amino groups (blue). Carbons colored as in B. Hydrogen bonds and hydrophobic contacts appear as red and gray dashes. Right: Different orientation (color code: B). (D) Quantification of SG data in E (mean ± SEM, n = 5). (E) GFP-G3BP1s (green) transfected U2OS cells untreated (Mock) or treated (500 µM SA, 1 h), stained for TIA1 (red) or eIF4G1 (blue in merged view, gray). Bars, 10 µm. *, P < 0.05; ***, P < 0.001.
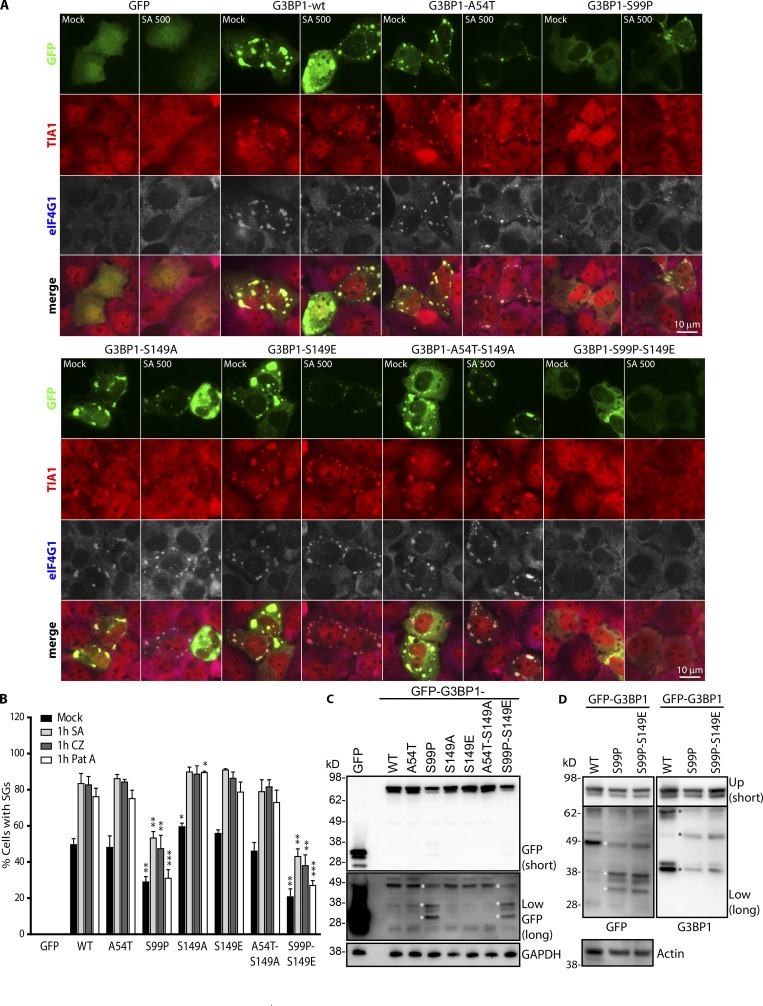
G3BP1-S99P displays impaired SG rescue in ΔΔG3BP1/2 cells. (A) Transfected cells were treated (500 µM SA, 1 h) or untreated (Mock) and stained for TIA1 (red) and eIF4G1 (blue in merged view, gray). Bars, 10 µm. (B) Quantification of SGs from A (mean ± SEM, n = 4). (C) Western blot of transfectants in A. Long exposure (Low). Asterisk marks altered GFP products. (D) Transfectants as in A, blotted as indicated. Short exposure (Up); long exposure (Low). *, P < 0.05; **, P < 0.01; ***, P < 0.001.
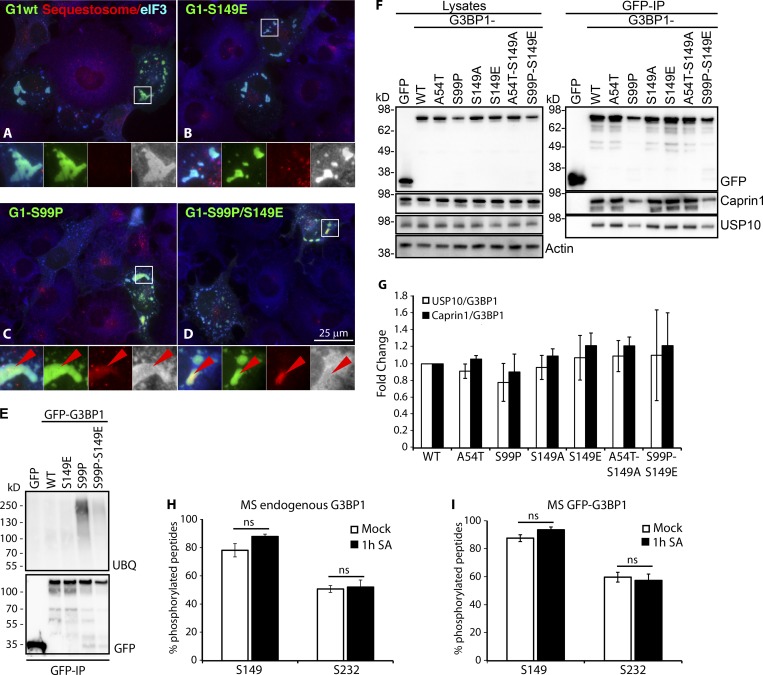
G3BP1-S99P exhibits reduced expression and increased ubiquitination, and recruits sequestosome into SGs. (A–D) COS7 cells expressing GFP-G3BPs (green), stained for sequestosome-1 (red) and eIF3b (blue). Zooms 2.75× below each panel, with colors separated (gray presents blue). Bar, 25 µm. (E) GFP-G3BPs transfected into COS7 cells, immunoprecipitated with GFP-TRAP, and blotted. (F) GFP-G3BP1s expressed in ΔΔG3BP1/2 U2OS cells, immunoprecipitated with GFP-TRAP, and blotted. (G) Quantification of Caprin1, USP10, and G3BP1 from F, showing fold change relative to G3BP1-WT (mean ± SEM, n = 8). (H) MS analysis of endogenous G3BP1-S149 and G3BP1-S232 phosphorylation following mock or 1-h SA (500 µM) treatment (mean ± SEM, n = 4). (I) MS analysis of stably expressed GFP-G3BP1-S149 and GFP-G3BP1-S232 phosphorylation in ΔΔG3BP1/2 U2OS cells during mock or 1-h SA (500 µM) treatment (mean ± SEM, n = 6).
Comment in
-
Reply to "Phosphorylation of G3BP1-S149 does not influence stress granule assembly".J Cell Biol. 2019 Jul 1;218(7):2433-2434. doi: 10.1083/jcb.201905105. Epub 2019 Jun 6. J Cell Biol. 2019. PMID: 31171633 Free PMC article.
Comment on
-
The RasGAP-associated endoribonuclease G3BP assembles stress granules.J Cell Biol. 2003 Mar 17;160(6):823-31. doi: 10.1083/jcb.200212128. J Cell Biol. 2003. Retraction in: J Cell Biol. 2023 Nov 6;222(11):e20021212808022023r. doi: 10.1083/jcb.20021212808022023r. PMID: 12642610 Free PMC article. Retracted.
References
-
- Adams P.D., Grosse-Kunstleve R.W., Hung L.W., Ioerger T.R., McCoy A.J., Moriarty N.W., Read R.J., Sacchettini J.C., Sauter N.K., and Terwilliger T.C.. 2002. PHENIX: building new software for automated crystallographic structure determination. Acta Crystallogr. D Biol. Crystallogr. 58:1948–1954. 10.1107/S0907444902016657 - DOI - PubMed
-
- Davis I.W., Leaver-Fay A., Chen V.B., Block J.N., Kapral G.J., Wang X., Murray L.W., Arendall W.B. III, Snoeyink J., Richardson J.S., and Richardson D.C.. 2007. MolProbity: all-atom contacts and structure validation for proteins and nucleic acids. Nucleic Acids Res. 35:W375–W383 10.1093/nar/gkm216 - DOI - PMC - PubMed
Publication types
MeSH terms
Substances
Grants and funding
LinkOut - more resources
Full Text Sources
Miscellaneous
