. 2019 Jun 6;10(1):2474.
doi: 10.1038/s41467-019-10189-x.

Diabetes causes marked inhibition of mitochondrial metabolism in pancreatic β-cells

Affiliations

Diabetes causes marked inhibition of mitochondrial metabolism in pancreatic β-cells

Elizabeth Haythorne et al. Nat Commun. .

Abstract

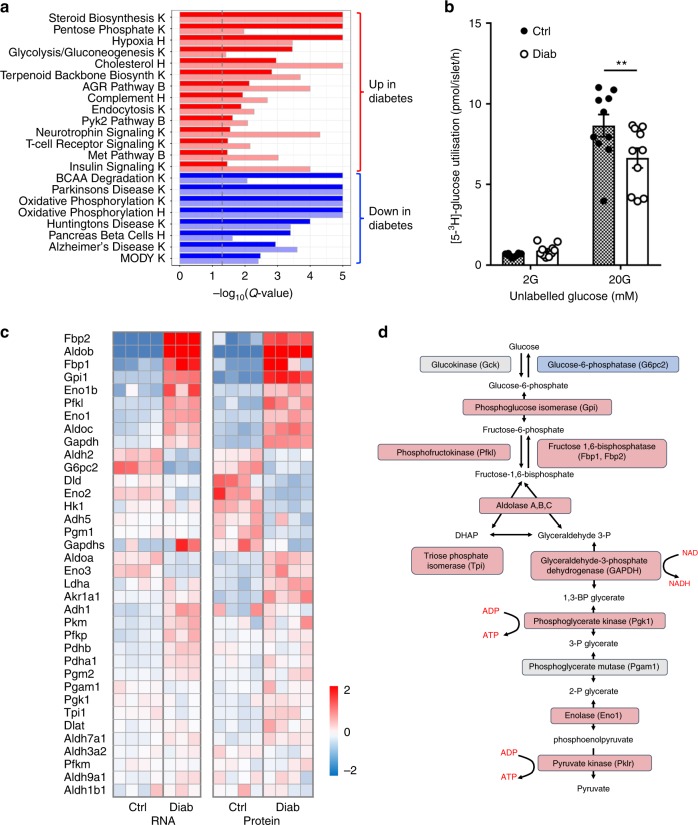
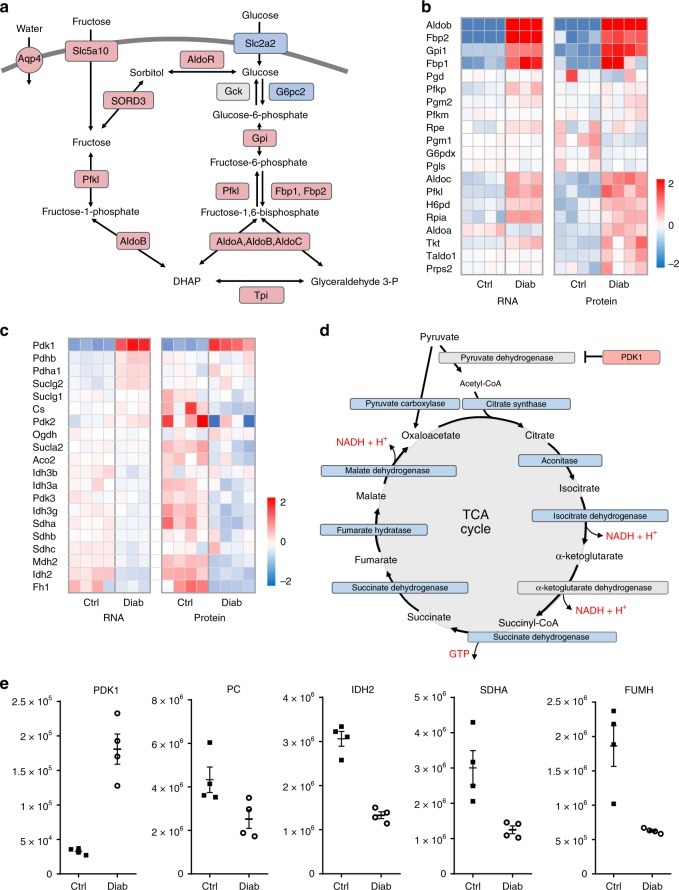
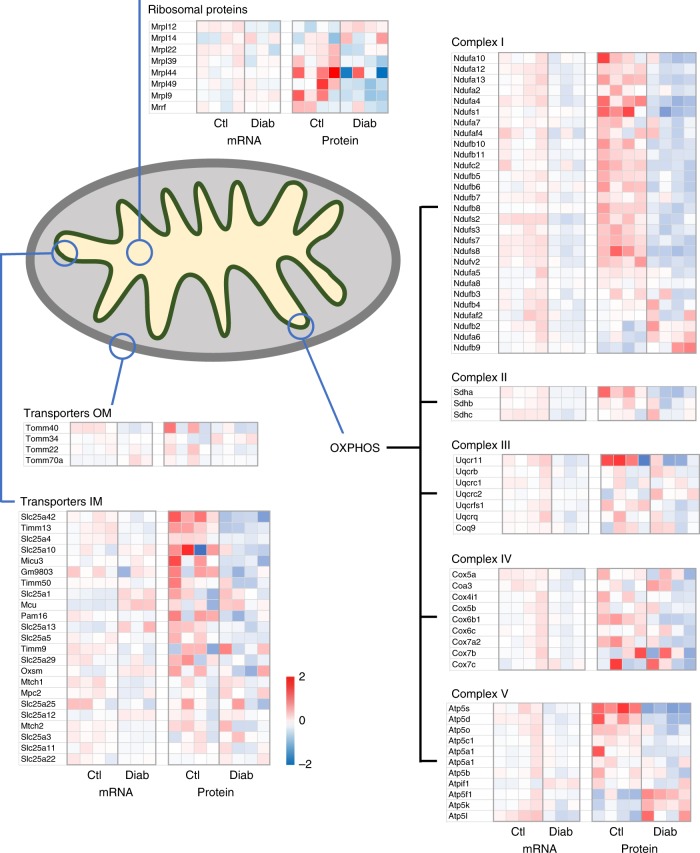
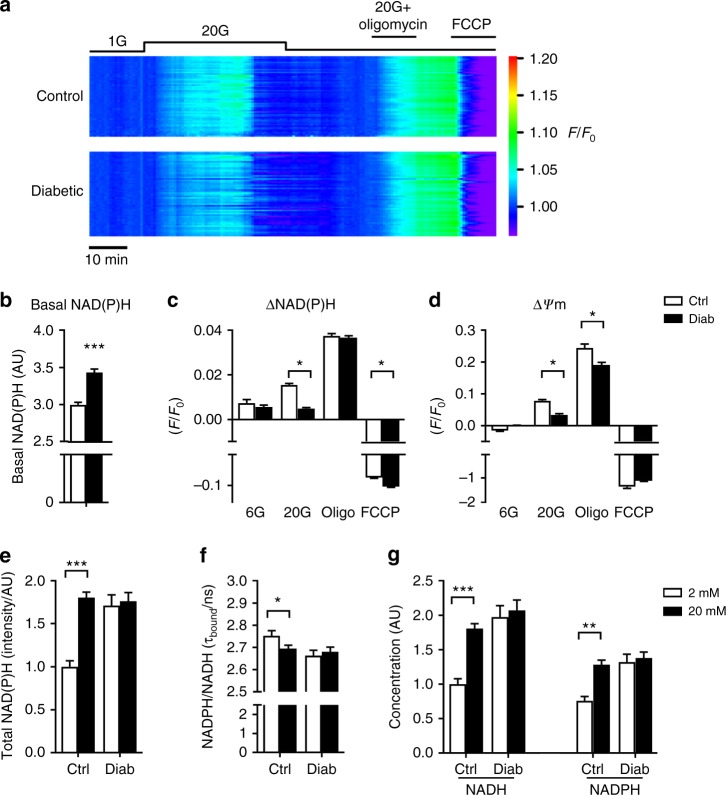
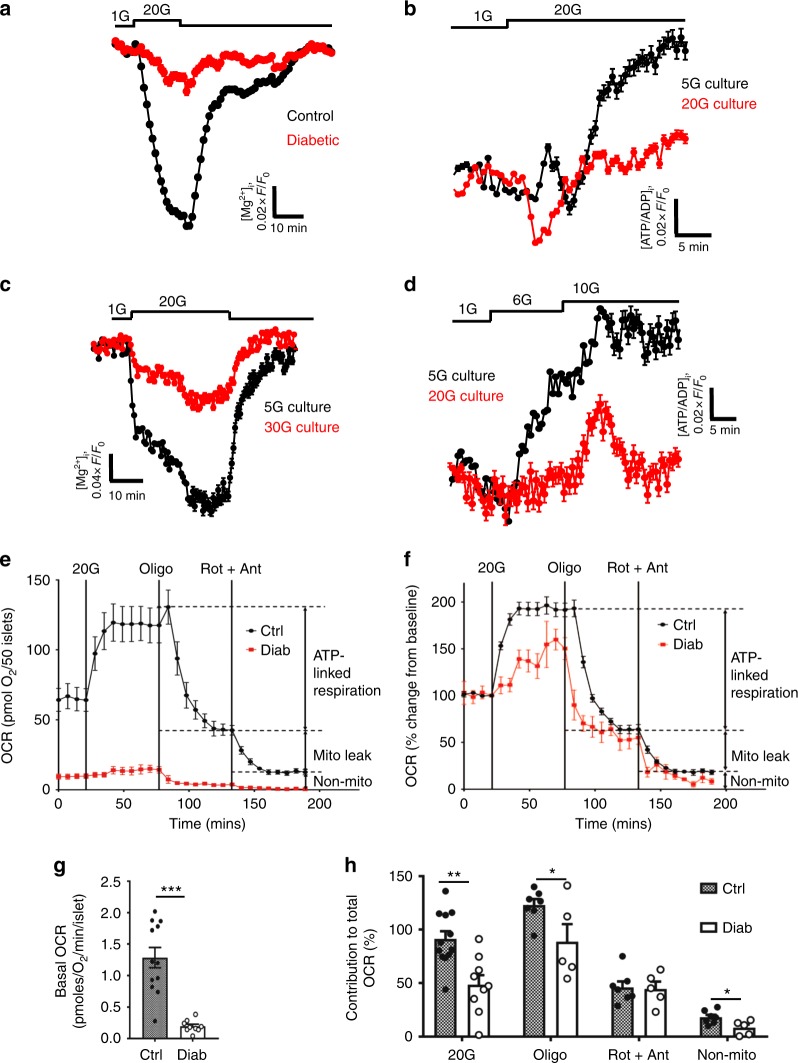
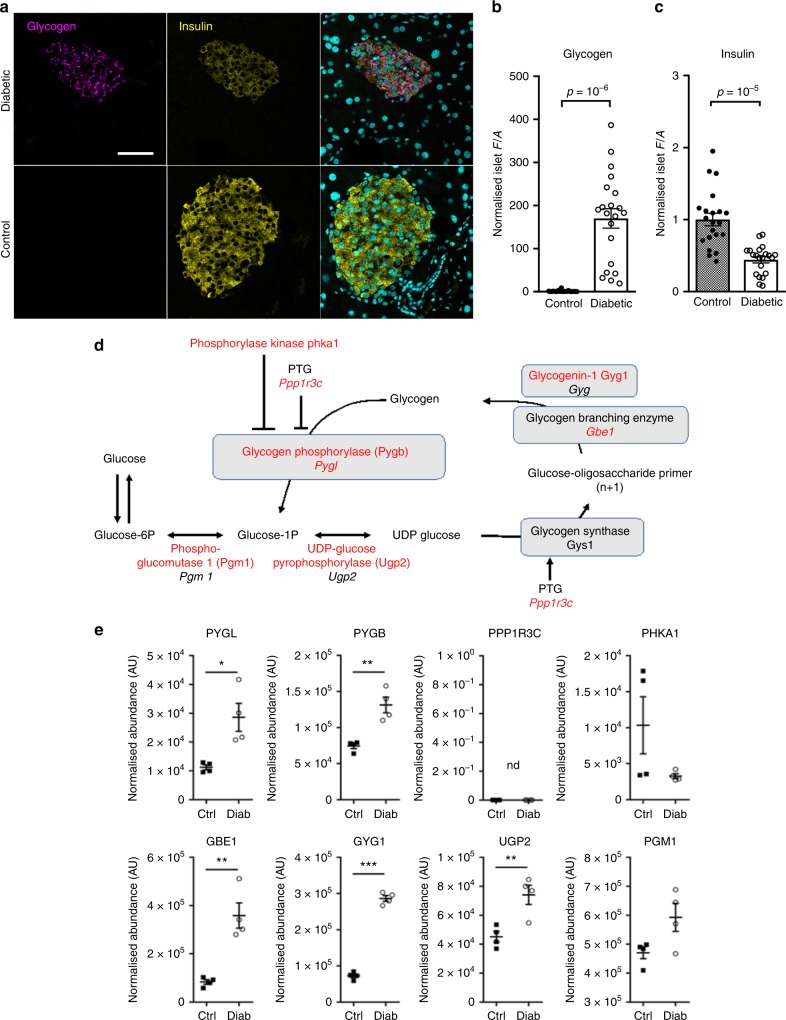
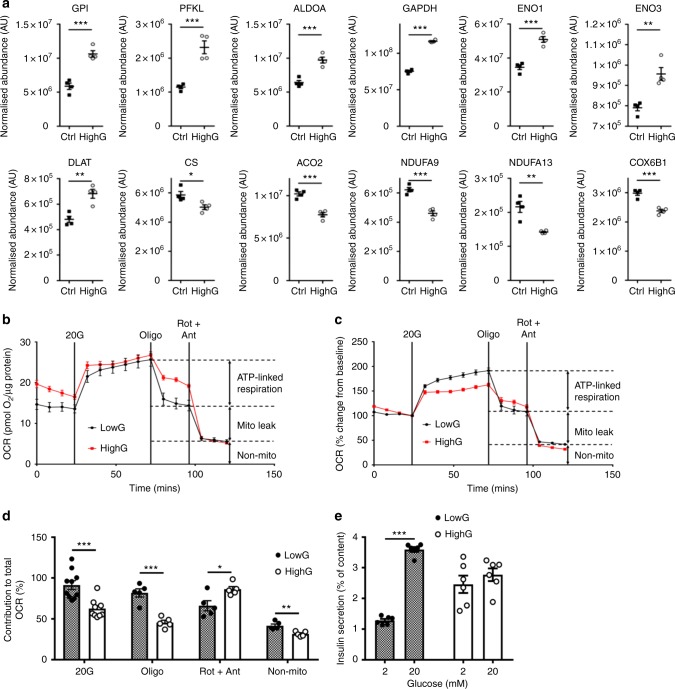
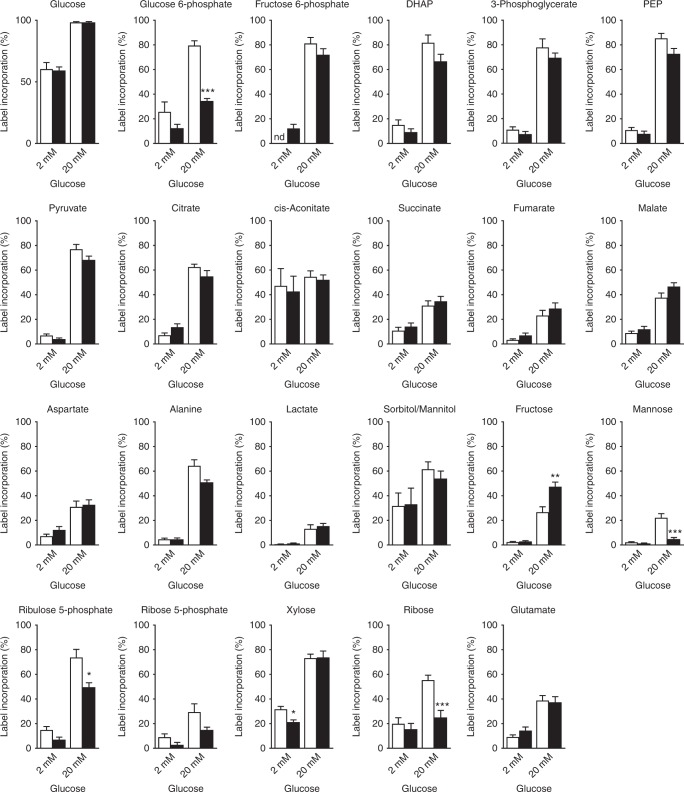
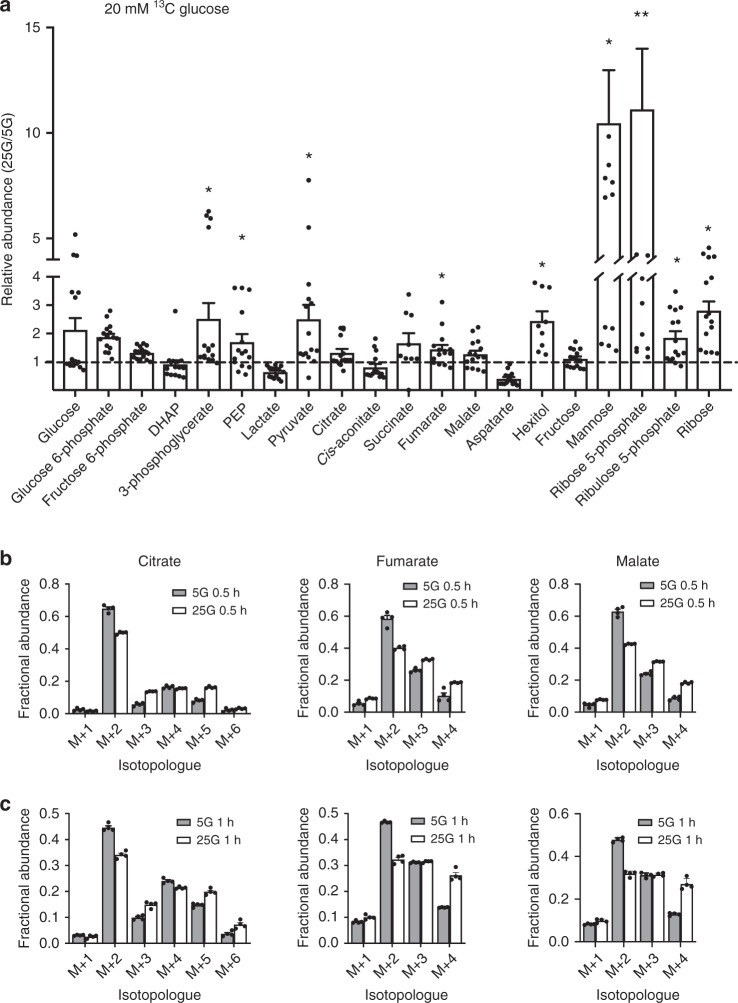
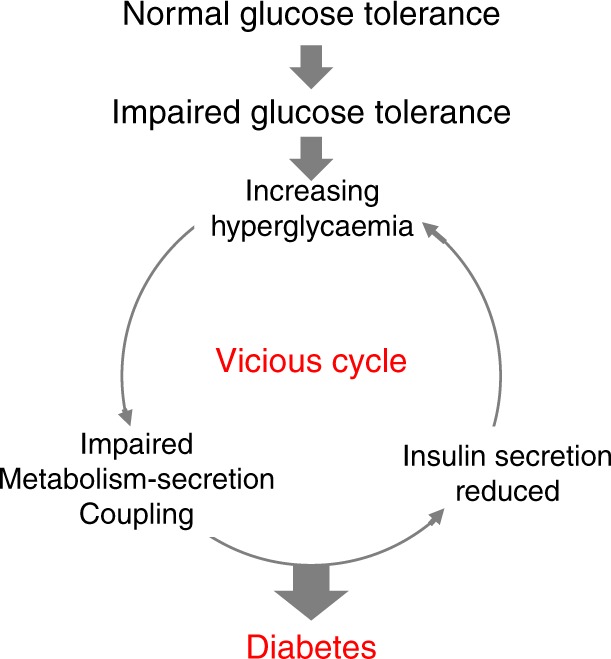
Diabetes is a global health problem caused primarily by the inability of pancreatic β-cells to secrete adequate levels of insulin. The molecular mechanisms underlying the progressive failure of β-cells to respond to glucose in type-2 diabetes remain unresolved. Using a combination of transcriptomics and proteomics, we find significant dysregulation of major metabolic pathways in islets of diabetic βV59M mice, a non-obese, eulipidaemic diabetes model. Multiple genes/proteins involved in glycolysis/gluconeogenesis are upregulated, whereas those involved in oxidative phosphorylation are downregulated. In isolated islets, glucose-induced increases in NADH and ATP are impaired and both oxidative and glycolytic glucose metabolism are reduced. INS-1 β-cells cultured chronically at high glucose show similar changes in protein expression and reduced glucose-stimulated oxygen consumption: targeted metabolomics reveals impaired metabolism. These data indicate hyperglycaemia induces metabolic changes in β-cells that markedly reduce mitochondrial metabolism and ATP synthesis. We propose this underlies the progressive failure of β-cells in diabetes.


Conflict of interest statement

The authors declare no competing interests.

Figures

Fig. 1
Fig. 1
Diabetes alters metabolic pathways. a Heat map of pathway enrichment, obtained by simultaneous analysis of transcriptome and proteome data sets using KEGG (K), Hallmark (H) or Biocarta (B). Red, pathways upregulated in diabetic islets. Blue, pathways downregulated in diabetic islets. Dark colours indicate proteomics, pale colours transcriptomics. The dashed vertical line indicates the level of significant change (false discovery rate-adjusted p value). PYK2, proline-rich tyrosine kinase 2. MET, tyrosine kinase MET. BCAA, branched chain amino acids. MODY, maturity onset diabetes of the young. b Glucose utilisation measured as the production of 3H2O from [3H]-glucose in control islets (hatched, n = 10 replicates, islets from 4 mice) and 2-week diabetic βV59M islets (white, n = 10, 6 mice) at 2 mM glucose (2 G) and 20 mM glucose (20 G). **p < 0.01 (two-way analysis of variance). Data are mean ± s.e.m. c Heat maps of relative mRNA and protein expression of the indicated genes in islets isolated from control (Ctrl) and 2-week diabetic (Diab) βV59M mice. Each box indicates a separate animal. Colour indicates log2 fold-change for diabetic vs control islets. d Glycolytic pathway. Elevated protein expression levels shown in red, decreased protein levels in blue. Grey, no change or not detected
Fig. 2
Fig. 2
Diabetes upregulates polyol pathway, pentose phosphate pathway and tricarboxylic acid (TCA) cycle genes and proteins. a Polyol pathway. Red, proteins upregulated in diabetes. Blue, proteins downregulated in diabetes. Grey, no change or not detected. AldoR, aldolase reductase. Slc2a2, glucose transporter 2. SORD3, sorbitol dehydrogenase. Aqp4, aquaporin 4. b Heat maps of mRNA and protein expression of the indicated genes in the pentose phosphate pathway in islets isolated from control (Ctrl) and 2-week diabetic βV59M (Diab) mice. Each box corresponds to a different animal. Colour indicates log2 fold-change. c Heat maps of relative mRNA and protein levels of the indicated genes in islets isolated from control and 2-week diabetic βV59M mice. Each box corresponds to a different animal. Colour indicates log2 fold-change. d TCA cycle. Red, proteins upregulated in diabetes; blue, proteins downregulated in diabetes. Grey, no change or not detected. PDK1, pyruvate dehydrogenase kinase 1. e Abundance of the indicated proteins, quantified by mass spectrometry, in islets isolated from control (black, Ctrl, n = 4) and 2-week diabetic βV59M (white, Diab, n = 4) mice. PDK1, pyruvate dehydrogenase kinase 1. PC, pyruvate carboxylase. IDH2, isocitrate dehydrogenase 2. SDHA, succinate dehydrogenase. FUMH, fumarate hydratase (mitochondrial). Each data point indicates a separate mouse. Mean ± s.e.m. is indicated
Fig. 3
Fig. 3
Mitochondrial signatures in control (Ctl) and diabetic (Diab) islets. Heat maps of mRNA and protein levels of the indicated mitochondrial genes in islets isolated from control and 2-week diabetic βV59M mice. Each box represents a different animal. Colour indicates log2 fold-change
Fig. 4
Fig. 4
Diabetes alters islet NAD(P)H generation. a Relative change in NAD(P)H fluorescence (F/F0) recorded simultaneously in groups of control (above, n = 58) or 2-week diabetic βV59M (below, n = 54) islets. Each trace represents an individual islet. Data are colour coded according to a ‘rainbow’ LUT, i.e. from violet (low value) to red (high value). b Basal NAD(P)H autofluoresence at 2 mM glucose in control (white, n = 396 islets) and 2-week diabetic islets (black, n = 200 islets). Mean ± s.e.m., t test ***p < 0.001. c Change in NAD(P)H autofluoresence in response to glucose (6 or 20 mM), to 20 mM glucose + 10 µM oligomycin and to 20 mM glucose + 4 µM FCCP in control (white, n = 60–257 islets) and 2-week diabetic βV59M islets (black, n = 152–194 islets). d Change in mitochondrial membrane potential, as assessed by TMRE (tetramethylrhodamine ethyl ester) fluorescence, in response to glucose (6 or 20 mM), to 20 mM glucose + 10 µM oligomycin and to 20 mM glucose + 4 µM FCCP in control (black, n = 83–199 islets) and 2-week diabetic islets (red, n = 111–248 islets). c, d Data are normalised to the level in 2 mM glucose. Mean ± s.e.m. Kruskal–Wallis analysis of variance with Dunn post hoc test. *p < 0.05. eg NADH and NADPH autofluorescence measured with fluorescence lifetime imaging microscopy in control (n = 21) and 2-week diabetic islets (n = 30) exposed to 2 (white bars) or 20 mM (black bars) glucose. Mean ± s.e.m. t test *p < 0.05, **p < 0.01, ***p < 0.001. e NAD(P)H autofluorescence. f Fluorescence lifetime of enzyme-bound NADH + NADPH autofluorescence signal. g Relative NADH and NADPH concentrations
Fig. 5
Fig. 5
Hyperglycaemia alters islet ATP production and mitochondrial efficiency. a, c Change in intracellular ATP, as assessed by the reduction in intracellular Mg2+ (measured using Mg-green) in response to 20 mM glucose. Data are mean ± s.e.m. a Control (black, n = 1147 islets) and 2-week diabetic βV59M mouse islets (red, n = 423 islets). c Control mouse islets cultured at 5 mM (black, n = 1228) or 30 mM (red, n = 423) glucose for 48 h. b, d Change in intracellular ATP/ADP ratio (Perceval fluorescence). Data are mean ± s.e.m. b In response to 20 mM glucose in control mouse islets cultured for 48 h at 5 mM glucose (black, n = 288 islets) or 20 mM glucose (red, n = 267 islets). d. In response to 6 and 10 mM glucose in non-diabetic human islets cultured for 72 h at 5 mM (black, n = 157) or 20 mM (red, n = 318) glucose. e Oxygen consumption rate (OCR) of control (black) and 2-week diabetic (red) islets at 2 mM glucose and after sequential addition of 20 mM glucose, 5 μM oligomycin and 5 μM rotentone + 5 μM antimycin A. Data points are mean ± s.e.m. (Control, n = 7–12 replicates (of 50 islets); Diabetic, n = 5–9 replicates (of 50 islets) with 6 animals/genotype). f OCR of control (black) and 2-week diabetic (red) islets normalised to percentage of baseline, at 2 mM glucose and after sequential addition of 20 mM glucose, 5 μM oligomycin and 5 μM rotentone + 5 μM antimycin A. Data points are mean ± s.e.m. Same data as in e (Control, n = 7–12 replicates (of 50 islets); Diabetic, n = 5–9 replicates (of 50 islets) with 6 animals/genotype). g Basal OCR at 2 mM glucose (basal OCR) of control (hatched) and 2-week diabetic (white) islets. Control, n = 12 replicates; diabetic n = 9 replicates; 6 animals/genotype. Data points are mean ± s.e.m. ***p < 0.001. Same data as in e. h Percentage of change in OCR when glucose was raised from 2 to 20 mM (20G), ATP-linked OCR (oligo), OCR required to maintain the mitochondrial leak (rot + ant) and non-mitochondrial OCR (non-mito) in control (hatched) and 2-week diabetic (white) islets. 20 G, 20 mM glucose. Oligo, 5 µM oligomycin. Rot + Ant, 50 µM rotenone + 5 μM antimycin A. Control, n = 12 replicates (20G), n = 7 (other compounds). Diabetic, n = 9 replicates (20 G), n = 5 (other compounds). 6 animals/genotype. Same data as in e. Data are mean ± s.e.m. t test *p < 0.05; **p < 0.01; ***p < 0.001
Fig. 6
Fig. 6
Hyperglycaemia causes profound glycogen accumulation in β-cells. Glycogen and insulin quantification in β-cells of βV59M diabetic animals and controls. Diabetes was induced at 12–13 weeks of age and pancreata were collected 2 weeks after induction, fixed and processed for paraffin embedding and immunohistochemistry. a Glycogen (Alexa647, magenta) and insulin (Alexa488, yellow) were detected by immunofluorescence staining in 5-µm sections from diabetic and control mice. Nuclei were stained with SYTOX blue (cyan). Images are representative of three independent experiments. Identical settings were used for confocal imaging of all pictures analysed. Scale bar = 100 µm. For quantification method details (b, c), see “Methods” section. b Glycogen upregulation, quantified as normalised average fluorescence density (F/A) within the insulin-positive area of the islet. Total number of islets n = 21 from n = 3 animals (n = 7 islets/mouse). Control: 1.0 ± 0.4; Diabetic: 170 ± 23. Error bars show s.e.m., p = 10–6. (Welch’s t test). c Insulin was quantified and normalised as for b. Control: 1.00 ± 0.09; Diabetic: 0.44 ± 0.04; error bars show s.e.m. p = 10–5 (Welch’s t test). d Glycogen pathway. Enzymes or genes indicated in red are increased in diabetic βV59M islets. Enzymes or genes indicated in black are either unchanged in diabetic βV59M islets or were not detected at the protein level. Genes are indicated in italics, proteins in roman type. PTG, protein targeting to glycogen. Phka1, skeletal muscle phosphorylase B kinase alpha subunit. e Abundance of the indicated proteins, quantified by mass spectrometry, in islets isolated from control mice (black, Ctrl, n = 4) and 2-week diabetic βV59M mice (white, Diab, n = 4). Each data point indicates a separate mouse. Mean ± s.e.m. Student’s t test (unpaired, two-sided). *p < 0.05, **p < 0.01, ***p < 0.001. nd not detected. PYGL, glycogen phosphorylase (liver type). PYGB, glycogen phosphorylase (brain type). PPP1R3C, protein phosphatase 1 regulatory subunit 3C (also called protein targeting to glycogen or PTG): this protein was not detected but the mRNA increased 2.6-fold (log2fc; p = 2.7e−9), GBE1, glycogen branching enzyme. GYG1, glycogenin 1. UGP2, UDP-glucose pyrophosphorylase 2. PGM1, phosphoglucomutase-1
Fig. 7
Fig. 7
Hyperglycaemia alters oxidative metabolism in INS-1 832/13 cells. a Abundance of the indicated proteins, quantified by mass spectrometry, in INS-1 cells cultured at 5 mM (black, Ctrl) or 25 mM (white, highG) glucose. Mean ± s.e.m. (n = 4 replicates) and individual data points are indicated. *p < 0.05, **p < 0.01, ***p < 0.001. Student’s t test (unpaired, two-sided). Above, enzymes involved in glycolysis. GPI, glucose 6-phosphate isomerase. PFKL, 6-phosphofructokinase, liver type. ALDOA, aldolase A. GAPDH, Glyceraldehyde 3-phosphate dehydrogenase. ENO1, enolase 1. ENO3, enolase 3. Below, mitochondrial enzymes. DLAT, dihydrolipoyllysine-residue acetyltransferase (a component of the pyruvate dehydrogenase complex). CS, citrate synthase. ACO2, aconitase 2. NDUFA9 and NDUF13, subunits 9 and 13 of NADH dehydrogenase:ubiquinone oxidoreductase (Complex 1). COX6B1, Cytochrome c oxidase subunit 6B1. b, c Oxygen consumption rate (OCR) in INS-1 cells cultured for 48 h at 5 mM (black) or 25 mM (red) glucose, expressed as absolute values (b) and as the percentage of change from the OCR baseline in 2 mM glucose (c). Data are mean ± s.e.m., n = 10 replicates/group (2 and 20 mM Glucose); n = 5, other compounds. d Percentage of change in OCR when glucose was raised from 2 to 20 mM (20G, n = 10 replicates/group), ATP-linked OCR (oligo, n = 5 replicates/group), OCR required to maintain the mitochondrial leak (rot + ant, n = 5 replicates/group) and non-mitochondrial OCR (non-mito, n = 5 replicates/group) in INS-1 832/13 cells cultured for 48 h at 5 mM glucose (hatched, lowG) or 25 mM glucose (white, highG). 20 G, 20 mM glucose. Oligo, 5 µM oligomycine. Rot + Ant, 50 µM rotenone + 5 µM antimycin A. Mean ± s.e.m. Student’s t test (unpaired, two-sided). *p < 0.05; **p < 0.01; ***p < 0.001. e Insulin secretion, expressed as a percentage of insulin content, for INS-1 cells cultured for 48 h at 5 mM (lowG, hatched) or 25 mM (highG, white) glucose and then exposed to 2 or 20 mM glucose. Mean ± s.e.m. (n = 6 experiments). Two-way analysis of variance **p < 0.01
Fig. 8
Fig. 8
Hyperglycaemia causes changes in [U-13C]-glucose labelling. Percentage of label incorporation of the indicated metabolites in INS-1 cells cultured at 5 mM (white) or 25 mM (black) glucose and then challenged with 2 or 20 mM [U-13C]-glucose for 30 min. Label incorporation is defined as the proportion of molecules in a metabolite pool containing one or more 13C atoms. DHAP, dihydroxyacetone phosphate. PEP, phosphenolpyruvate. Data show mean ± s.e.m. (where from left to right for each metabolite, n = 13, 13, 19 and 18). One-way analysis of variance and Bonferroni-corrected Welch’s t test. *p < 0.05, **p < 0.01,***p < 0.001, nd not detected
Fig. 9
Fig. 9
Metabolite abundance and isotopomers in response to hyperglycaemia. a Relative abundance of the indicated metabolites in INS-1 cells cultured at 25 mM expressed as a fraction of that in INS-1 cells cultured at 5 mM glucose. All cells were challenged with 20 mM [U-13C]-glucose for 30 min. DHAP, dihydroxyacetone phosphate. PEP, phosphenolpyruvate. Hexitol (sorbitol/mannitol). Data are mean ± s.e.m. (n = 15 independent samples except for hexitol and succinate where n = 9). One-way analysis of variance with Holm–Sidak’s multiple comparisons test, *p < 0.05, **p < 0.01. b, c Mass isotopomer distributions (MIDs) of the indicated metabolites in INS-1 cells cultured at 5 mM glucose (white bars) or 25 mM glucose (black bars) and then challenged with 20 mM [U-13C]-glucose for 30 min (b) or 60 min (c). Data are derived from a subset of that used in Fig. 8. Mean ± s.e.m.; n = 4 independent samples. ‘M + n’ (where ‘M’ is the m/z of the unlabelled ion) and ‘n’ indicates the number of 13C atoms in that isotopomer. The data for each isotopomer are expressed as a fraction of the total labelled isotopomers for that metabolite. Since pyruvate and acetyl-CoA contain three and two carbons, respectively, MIDs of +3 are indicative of carbon entry into the TCA through carboxylation of pyruvate, +2, +4 and +6 are indicative of entry through acetyl-CoA (multiple cycles), while +5 indicates that it is derived from both pyruvate carboxylation and acetyl-CoA
Fig. 10
Fig. 10
Schematic showing how a small rise in glucose might lead a vicious cycle that progresses to diabetes by progressively impairing β-cell metabolism

References

    1. UKPDS. UK. Prospective diabetes study 16: overview of 6 years’ therapy of type ii diabetes: a progressive disease. Diabetes. 1998;44:1249–1258. - PubMed
    1. Ashcroft FM, Rorsman P. Diabetes and the beta-cell: the last ten years. Cell. 2012;148:1160–1171. doi: 10.1016/j.cell.2012.02.010. - DOI - PMC - PubMed
    1. Brun T, et al. Diabetogenic milieus induce specific changes in mitochondrial transcriptome and differentiation of human pancreatic islets. Hum. Mol. Genet. 2015;24:5270–5284. doi: 10.1093/hmg/ddv247. - DOI - PubMed
    1. Göhring I, et al. Chronic high glucose and pyruvate levels differentially affect mitochondrial bioenergetics and fuel-stimulated insulin secretion from clonal INS-1 832/13 cells. J. Biol. Chem. 2014;289:3786–3798. doi: 10.1074/jbc.M113.507335. - DOI - PMC - PubMed
    1. Fernandez C, et al. Metabolomic and proteomic analysis of a clonal insulin-producing beta-cell line (INS-1 832/13) J. Proteome Res. 2008;7:400–411. doi: 10.1021/pr070547d. - DOI - PubMed

Publication types

MeSH terms