

Biology and Bias in Cell Type-Specific RNAseq of Nucleus Accumbens Medium Spiny Neurons
- PMID: 31171808
- PMCID: PMC6554355
- DOI: 10.1038/s41598-019-44798-9
Biology and Bias in Cell Type-Specific RNAseq of Nucleus Accumbens Medium Spiny Neurons
Abstract
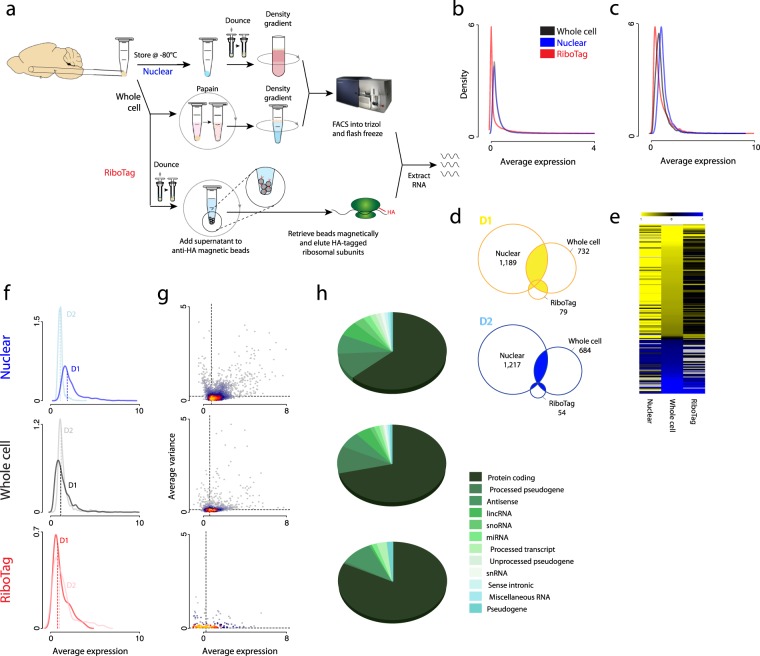
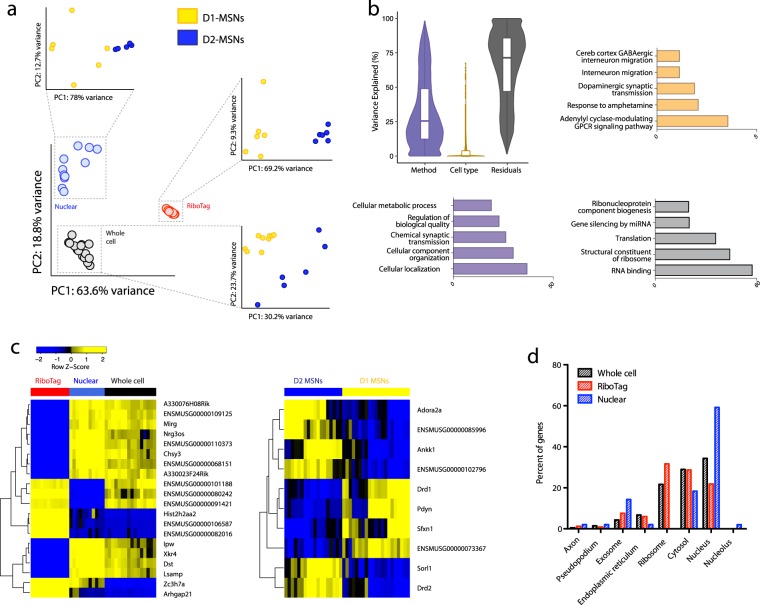
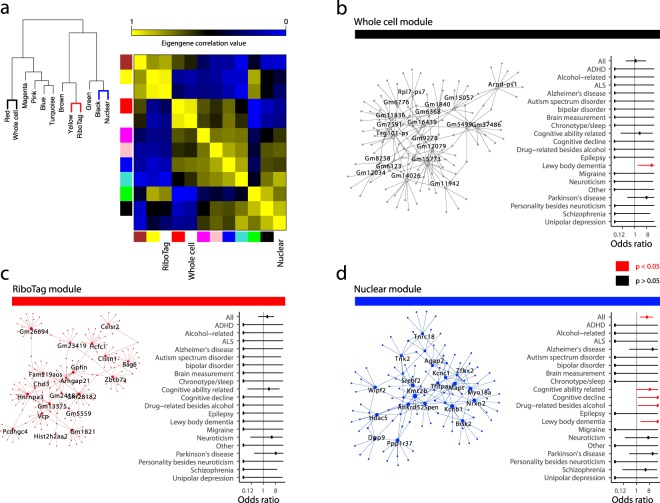
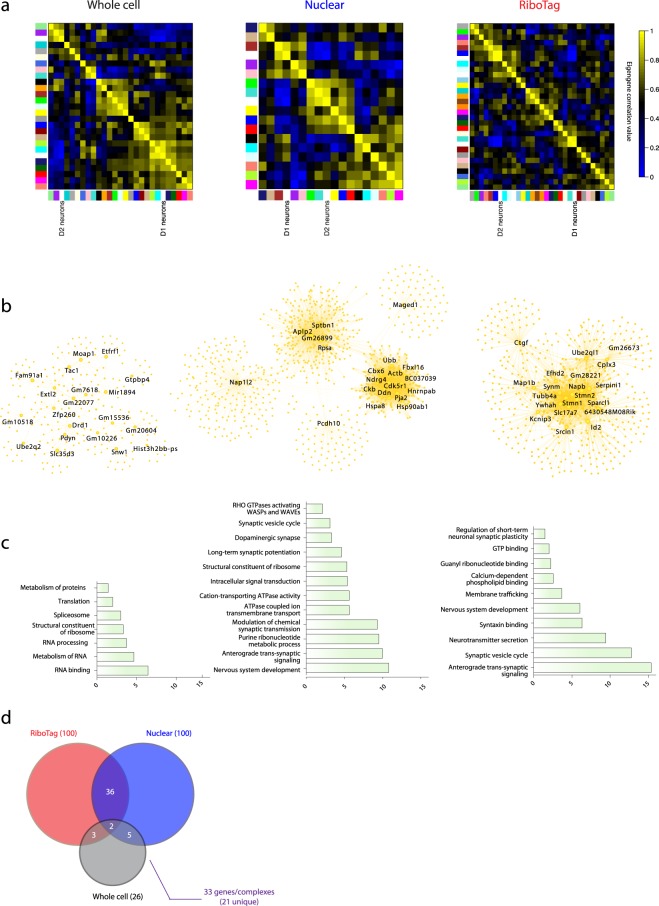
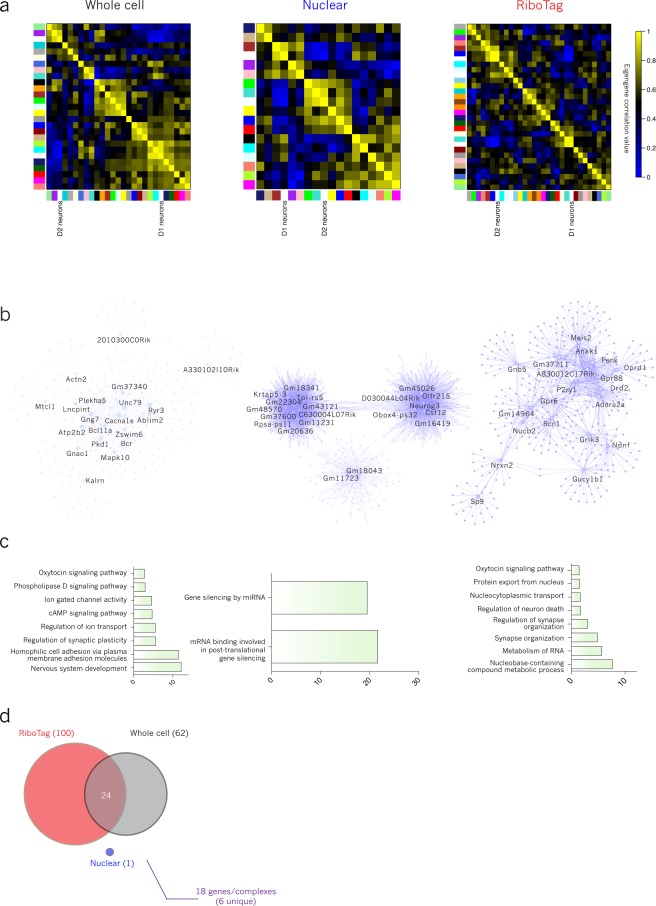
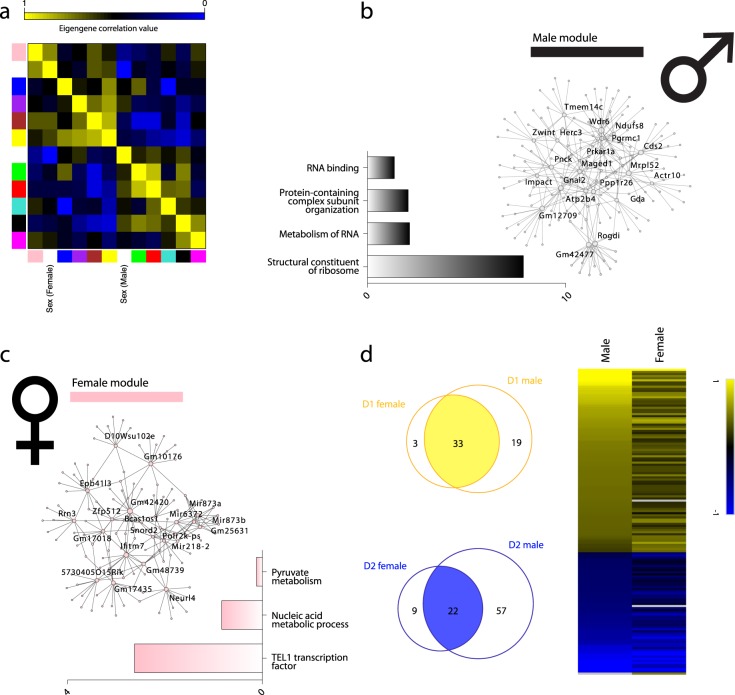
Subcellular RNAseq promises to dissect transcriptional dynamics but is not well characterized. Furthermore, FACS may introduce bias but has not been benchmarked genome-wide. Finally, D1 and D2 dopamine receptor-expressing medium spiny neurons (MSNs) of the nucleus accumbens (NAc) are fundamental to neuropsychiatric traits but have only a short list of canonical surface markers. We address these gaps by systematically comparing nuclear-FACS, whole cell-FACS, and RiboTag affinity purification from D1- and D2-MSNs. Using differential expression, variance partitioning, and co-expression, we identify the following trade-offs for each method. RiboTag-seq best distinguishes D1- and D2-MSNs but has the lowest transcriptome coverage. Nuclear-FACS-seq generates the most differentially expressed genes and overlaps significantly with neuropsychiatric genetic risk loci, but un-annotated genes hamper interpretation. Whole cell-FACS is more similar to nuclear-FACS than RiboTag, but captures aspects of both. Using pan-method approaches, we discover that transcriptional regulation is predominant in D1-MSNs, while D2-MSNs tend towards cytosolic regulation. We are also the first to find evidence for moderate sexual dimorphism in these cell types at baseline. As these results are from 49 mice (nmale = 39, nfemale = 10), they represent generalizable ground-truths. Together, these results guide RNAseq methods selection, define MSN transcriptomes, highlight neuronal sex differences, and provide a baseline for D1- and D2-MSNs.
Conflict of interest statement
The authors declare no competing interests.
Figures
Similar articles
-
A Role for Peroxisome Proliferator-Activated Receptor Gamma Coactivator-1α in Nucleus Accumbens Neuron Subtypes in Cocaine Action.Biol Psychiatry. 2017 Apr 1;81(7):564-572. doi: 10.1016/j.biopsych.2016.10.024. Epub 2016 Oct 28. Biol Psychiatry. 2017. PMID: 27939396 Free PMC article.
-
Opposing role for Egr3 in nucleus accumbens cell subtypes in cocaine action.J Neurosci. 2015 May 20;35(20):7927-37. doi: 10.1523/JNEUROSCI.0548-15.2015. J Neurosci. 2015. PMID: 25995477 Free PMC article.
-
Different roles of D1/D2 medium spiny neurons in the nucleus accumbens in pair bond formation of male mandarin voles.Elife. 2025 Jun 6;13:RP100292. doi: 10.7554/eLife.100292. Elife. 2025. PMID: 40478768 Free PMC article.
-
A novel perspective on the role of nucleus accumbens neurons in encoding associative learning.FEBS Lett. 2023 Nov;597(21):2601-2610. doi: 10.1002/1873-3468.14727. Epub 2023 Sep 1. FEBS Lett. 2023. PMID: 37643893 Review.
-
D1 and D2 dopamine-receptor modulation of striatal glutamatergic signaling in striatal medium spiny neurons.Trends Neurosci. 2007 May;30(5):228-35. doi: 10.1016/j.tins.2007.03.008. Epub 2007 Apr 3. Trends Neurosci. 2007. PMID: 17408758 Review.
Cited by
-
DNA methylation and hydroxymethylation characterize the identity of D1 and D2 striatal projection neurons.Commun Biol. 2022 Dec 1;5(1):1321. doi: 10.1038/s42003-022-04269-w. Commun Biol. 2022. PMID: 36456703 Free PMC article.
-
Repulsive Sema3E-Plexin-D1 signaling coordinates both axonal extension and steering via activating an autoregulatory factor, Mtss1.Elife. 2024 Mar 25;13:e96891. doi: 10.7554/eLife.96891. Elife. 2024. PMID: 38526535 Free PMC article.
-
Cell-type specific profiling of histone post-translational modifications in the adult mouse striatum.Nat Commun. 2022 Dec 13;13(1):7720. doi: 10.1038/s41467-022-35384-1. Nat Commun. 2022. PMID: 36513652 Free PMC article.
-
Single-nucleus transcriptome analysis reveals cell-type-specific molecular signatures across reward circuitry in the human brain.Neuron. 2021 Oct 6;109(19):3088-3103.e5. doi: 10.1016/j.neuron.2021.09.001. Epub 2021 Sep 27. Neuron. 2021. PMID: 34582785 Free PMC article.
-
SIRT1 Coordinates Transcriptional Regulation of Neural Activity and Modulates Depression-Like Behaviors in the Nucleus Accumbens.Biol Psychiatry. 2024 Sep 15;96(6):495-505. doi: 10.1016/j.biopsych.2024.03.017. Epub 2024 Apr 3. Biol Psychiatry. 2024. PMID: 38575105
References
-
- Orecchioni, S. & Bertolini, F. In Methods in molecular biology (Clifton, N. J.) 1464, 49–62 (2016). - PubMed
Publication types
MeSH terms
Substances
Grants and funding
LinkOut - more resources
Full Text Sources
Molecular Biology Databases
Research Materials
Miscellaneous
