. 2020 May;17(5):507-518.
doi: 10.1038/s41423-019-0246-9. Epub 2019 Jun 6.

A wave of Foxp3+ regulatory T cell accumulation in the neonatal liver plays unique roles in maintaining self-tolerance

Affiliations

A wave of Foxp3+ regulatory T cell accumulation in the neonatal liver plays unique roles in maintaining self-tolerance

Mingyang Li et al. Cell Mol Immunol. 2020 May.

Abstract

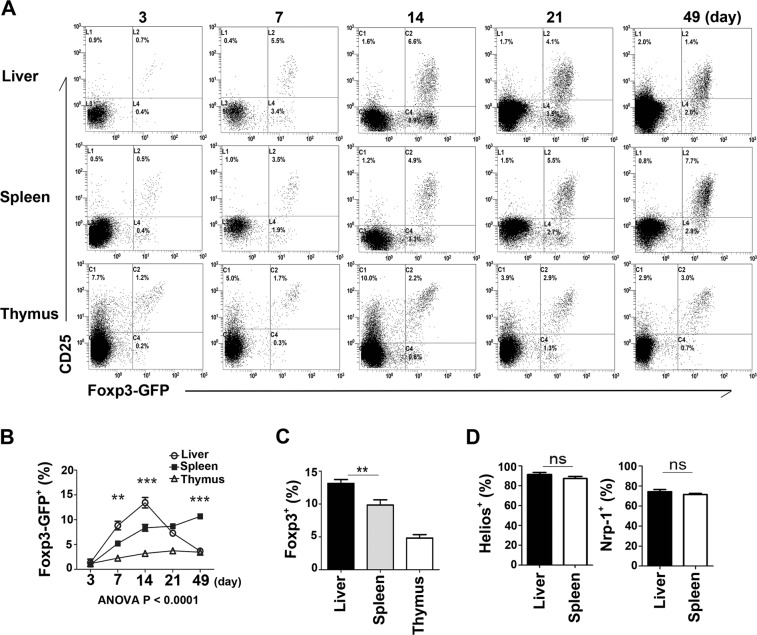
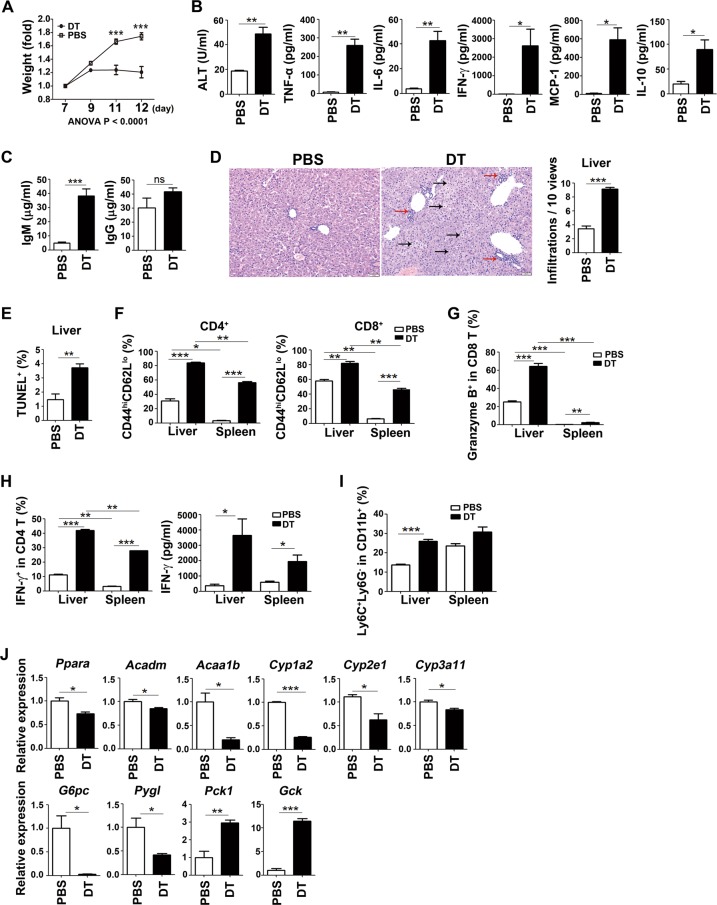
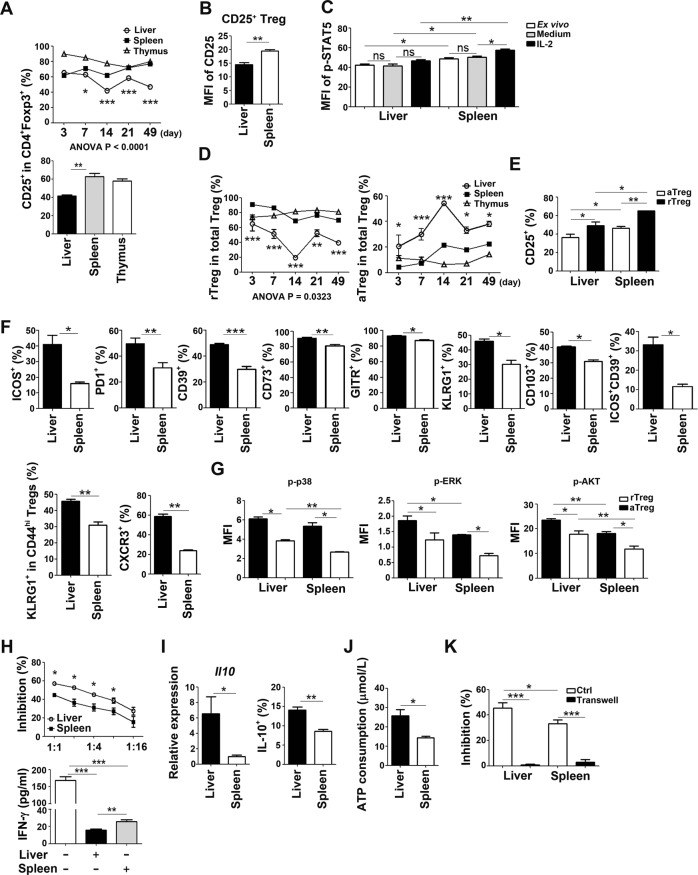
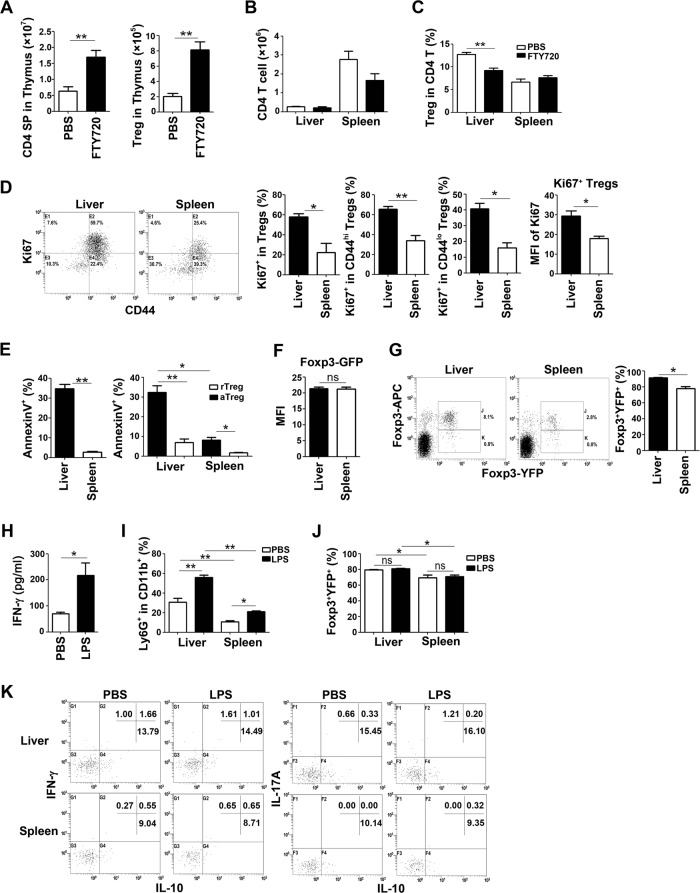
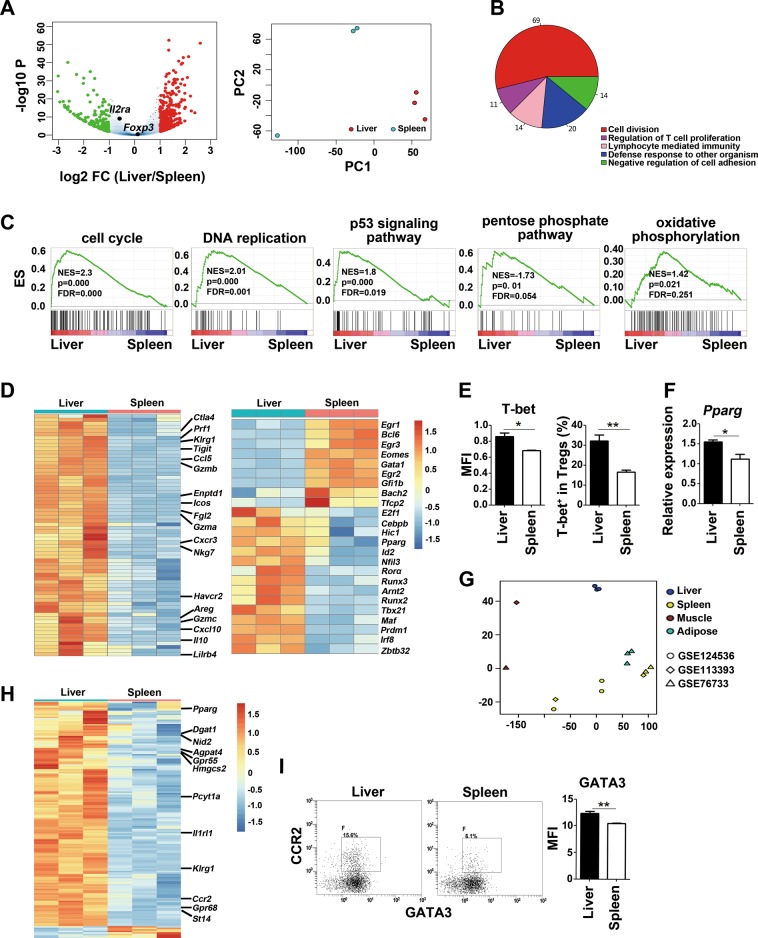
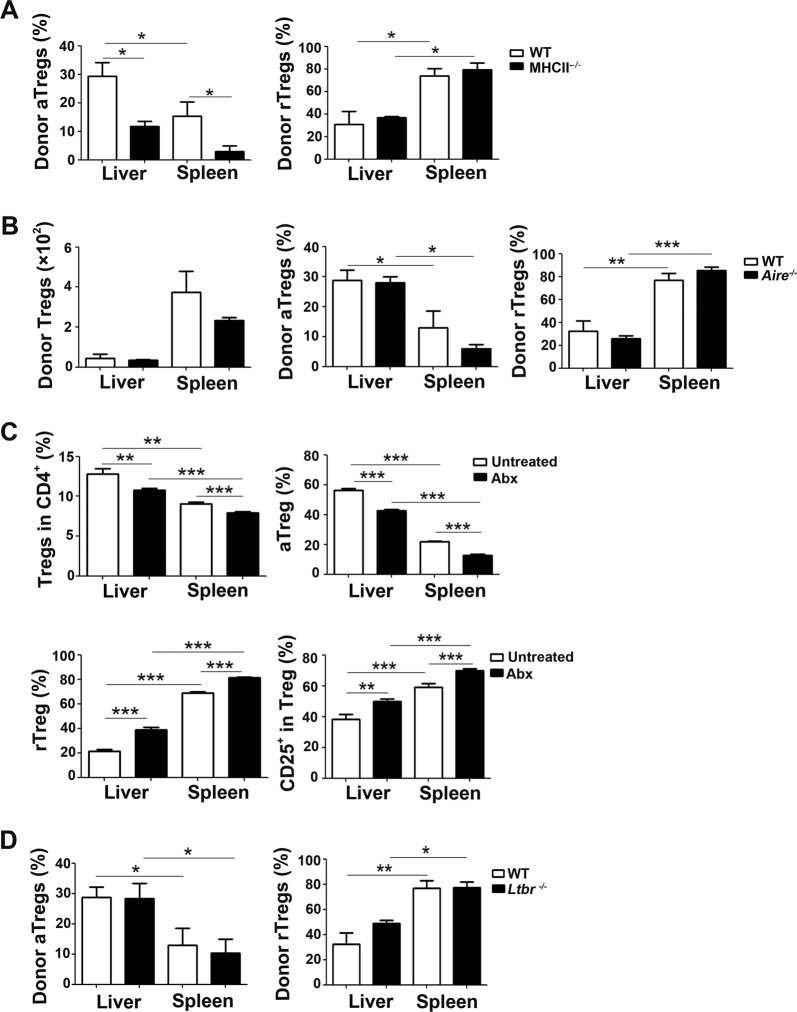
Newborn animals require tightly regulated local and systemic immune environments to govern the development and maturation of multiple organs/tissues even though the immune system itself is far from mature during the neonatal period. Regulatory T cells (Tregs) are essential for maintaining immune tolerance/homeostasis and modulating inflammatory responses. The features of Tregs in the neonatal liver under steady-state conditions are not well understood. The present study aimed to investigate the phenotype, functions, and significance of neonatal Tregs in the liver. We found a wave of thymus-derived Treg influx into the liver during 1-2 weeks of age. Depletion of these Tregs between days 7 and 11 after birth rapidly resulted in Th1-type liver inflammation and metabolic disorder. More Tregs in the neonatal liver than in the spleen underwent MHC II-dependent activation and proliferation, and the liver Tregs acquired stronger suppressive functions. The transcriptomic profile of these neonatal liver Tregs showed elevated expression of PPARγ and T-bet and features of Tregs that utilize lipid metabolic machinery and are capable of regulating Th1 responses. The accumulation of Tregs with unique features in the neonatal liver is critical to ensure self-tolerance and liver maturation.

Keywords: Foxp3; Neonatal period,; Th1-type inflammation; Treg cells; liver.


Conflict of interest statement

The authors declare no competing interests.

Figures

Fig. 1
Fig. 1
tTregs accumulated in the liver at 1–2 weeks after parturition. a, b Flow cytometry analysis of Tregs (Foxp3-GFP+) in the liver, spleen, and thymus of Foxp3GFP knock-in (KI) mice. The cells were gated on the CD4+CD8 population. c Comparison of CD4+Foxp3+ Treg frequencies in 12- to 14-day-old WT mice. d Comparison of Helios+ and Nrp-1+ cell percentages in the CD4+Foxp3-GFP+ liver and splenic Treg populations in 12-day-old mice. Three independent experiments were performed with at least three mice in each group. Data are presented as the mean ± SEM. The differences between liver and splenic Tregs are indicated with *p < 0.05, **p < 0.01, and ***p < 0.005
Fig. 2
Fig. 2
Depletion of Tregs quickly resulted in Th1-type liver inflammation and metabolic disorder. B6.Foxp3DTR/GFP (Foxp3-DTR) mice were injected with diphtheria toxin (DT) or PBS at days 7, 9, and 11 after birth. The mice were monitored daily and harvested on day 12. a Comparison of body weight changes between the PBS- and DT-treated Foxp3-DTR mice. b Comparisons of serum ALT and cytokine levels. c Comparisons of serum IgM and IgG levels. d Representative H&E staining of liver sections obtained from the PBS- and DT-treated Foxp3-DTR mice. The scale bar represents 20 μm. The red and black arrows point to infiltrated lymphocytes and swollen hepatocytes with extensively vacuolated cytoplasm, respectively. The average numbers of infiltrated lymphocytes in 10 fields of views are plotted on the right. e Comparison of liver cell apoptosis (percentage of TUNEL+ cells among all DAPI+ cells in six fields of view) between the PBS- and DT-treated Foxp3-DTR mice. f Flow cytometry analysis of the CD44hiCD62Llo percentages of CD4 and CD8 T cells obtained from the liver and spleen. g Comparison of the percentages of Granzyme B+ cells in the CD8 T cell populations from the liver and spleen. h Liver and splenic cells stimulated with PMA and ionomycin for 6 h. IFN-γ production was measured by intracellular staining (gated on CD4 T cells, left) and the LEGENDplex™ Mouse Inflammation Panel (right). i Flow cytometry analysis of the Ly6C+Ly6G cell percentages in the CD11b+ cell populations in the liver and spleen. j Quantitative PCR analysis of gene expression in PBS- and DT-treated liver samples. The experiments were repeated three times with 6–10 mice in each group
Fig. 3
Fig. 3
Neonatal liver had more Tregs with a highly activated/effector phenotype and functions than the spleen. CD4+Foxp3-GFP+ (KI) or CD4+Foxp3+ (WT) Tregs obtained from various tissues of 10- to 14-day-old (unless specified) mice were compared. a Comparison of CD25+ Treg proportions in KI (upper panel) and WT (lower panel) mice. The significance of the difference between liver and splenic Tregs was calculated. b Comparison of the fluorescence intensity of CD25 staining of CD25+ Tregs obtained from the liver and spleen. c Flow cytometry analysis of phosphorylated STAT5 (p-STAT5) expression in Tregs ex vivo or Tregs cultured in the presence or absence of IL-2 (10 ng/ml) for 20 minutes. d Comparison of rTregs (CD44int/loCD62Lhi) and aTregs (CD44hiCD62Llo) in various tissues. The difference between liver and splenic samples was evaluated. e Comparison of CD25 expression in liver and splenic rTregs and aTregs. (f) Comparison of surface marker expression in liver and splenic Tregs. g Flow cytometry analysis of signaling molecules in liver and splenic Tregs. h Comparison of liver and splenic Tregs regarding their capability to suppress the proliferation of CFSE-labeled CD4 T cells and production of IFN-γ by total T cells in vitro. The ratio of Tregs to responder T cells was 1:2 in the IFN-γ suppression assay. Liver, liver Tregs; Spleen, splenic Tregs. i Il10 transcription in purified liver and splenic CD4+Foxp3-GFP+ Tregs, as measured by quantitative PCR (left plot). Liver and splenic mononuclear cells were stimulated with PMA and ionomycin for 6 h. IL-10 protein production was measured by flow cytometry, and CD4+Foxp3+ cells were gated (right plot). j Comparison of ATP consumption between liver and splenic Tregs. k Comparison of the suppressive activity of liver and splenic Tregs in a Transwell system with a Treg-to-responder ratio of 1:2. At least three independent experiments were performed with three mice in each group
Fig. 4
Fig. 4
Liver Tregs were stable and had higher levels of cell proliferation and apoptosis than splenic Tregs. ac FTY720 or PBS was injected into KI mice on days 7, 9, and 11 to block thymic egress. On day 12, the numbers of CD4 SP and Tregs in the thymus were measured (a). CD4 T cell numbers (b) and Treg percentages (c) in the liver and spleen were analyzed. d Comparisons of the percentage of Ki67+ proliferating cells in the CD4+Foxp3+ Treg population (left) and the fluorescence intensity of Ki67 staining in the Ki67+ Tregs (right) were performed. e Flow cytometry analysis of AnnexinV+ cells in the liver and splenic CD4+Foxp3-GFP+ Treg populations was performed. f Flow cytometry was used to analyze Foxp3 expression in liver and splenic Tregs. g Foxp3-GFP-Cre × Rosa26-loxP-Stop-loxP-YFP mice (10–12-days-old) were analyzed for YFP and Foxp3 expression in CD4 T cells. The average percentage of Foxp3+YFP+ cells in the YFP+ cell population is plotted on the right. hk Foxp3-GFP-Cre × Rosa26-loxP-Stop-loxP-YFP mice were intraperitoneally injected with LPS or PBS on day 11. The mice were sacrificed 24 h later. The serum IFN-γ level was measured by ELISA (h). The percentages of Ly6G+ cells in the CD11b+ cell populations in the liver and spleen were measured by flow cytometry (i). The percentages of Foxp3+YFP+ cells in the YFP+ cell populations in the liver and spleen are shown in j. The expression of IL-10, IFN-γ, and IL-17A by Tregs in the liver and spleen was measured by flow cytometry (k). The experiments were repeated three times with at least 3–6 mice in each group
Fig. 5
Fig. 5
RNA-seq analysis of liver and splenic Tregs in 12-day-old mice. a Volcano plot (left) and PCA analysis (right) of liver and splenic Tregs. Genes highly expressed in the liver and spleen are indicated as red and green, respectively. b Pie chart of DEGs assigned to the indicated GO terms. c Pathways significantly enriched in the liver by GSEA analysis. d Heatmaps of activation/effector Treg-associated genes (left) and transcription factors (right) in liver and splenic Tregs. e Flow cytometry analysis of the T-bet expression level and T-bet+ ratios in Tregs. Each group included at least four mice. f Quantitative PCR analysis of Pparg expression in Tregs. g PCA analysis of the Treg transcriptome of neonatal liver (GSE124536, dark blue), adult adipose (GSE76733, light blue) and muscle (GSE113393, red) Tregs. Splenic Tregs (yellow) were used as controls in all analyses. h Heatmap of the VAT Treg signature genes with upregulated expression in neonatal liver and splenic Tregs. i Flow cytometry analysis of GATA3 and CCR2 expression in Tregs. Comparison of the staining intensity of GATA3 in Tregs is shown on the right. The experiment was repeated 2–3 times
Fig. 6
Fig. 6
Activation of neonatal Tregs depends on MHC II and partially depends on microbial antigens. a, b CD4 SP thymocytes from 10- to 12-days-old KI mice were adoptively transferred into 10-days-old WT, MHC II−/− (a) and Aire−/− (b) mice. Foxp3-GFP+ Tregs in the spleen and liver were analyzed four days later. c Female KI mice were given vancomycin and streptomycin during pregnancy and after parturition. Two litters of 12-days-old pups were analyzed to assess their Tregs in the liver and spleen. d CD4 SP thymocytes were adoptively transferred into 10-days-old Ltbr−/− recipients. The donor-derived Tregs were analyzed 4 days later. The experiments were repeated 3–5 times with 2–4 mice in each group

References

    1. Grijalva J, Vakili K. Neonatal liver physiology. Semin Pedia. Surg. 2013;22:185–189. - PubMed
    1. Nakagaki B. N., et al. Immune and metabolic shifts during neonatal development reprogram liver identity and function. J. Hepatol.69, 1294–1307 (2018). - PubMed
    1. van Elburg RM, Fetter WP, Bunkers CM, Heymans HS. Intestinal permeability in relation to birth weight and gestational and postnatal age. Arch. Dis. Child Fetal Neonatal Ed. 2003;88:F52–55. - PMC - PubMed
    1. Weaver LT, Laker MF, Nelson R, Lucas A. Milk feeding and changes in intestinal permeability and morphology in the newborn. J. Pedia. Gastroenterol. Nutr. 1987;6:351–358. - PubMed
    1. Prandota J. Possible pathomechanisms of sudden infant death syndrome: key role of chronic hypoxia, infection/inflammation states, cytokine irregularities, and metabolic trauma in genetically predisposed infants. Am. J. Ther. 2004;11:517–546. - PubMed

Publication types

MeSH terms

Substances