. 2019 May 1;3(3):299-312.
doi: 10.1002/evl3.117. eCollection 2019 Jun.

The genomic determinants of adaptive evolution in a fungal pathogen

Affiliations

The genomic determinants of adaptive evolution in a fungal pathogen

Jonathan Grandaubert et al. Evol Lett. .

Abstract

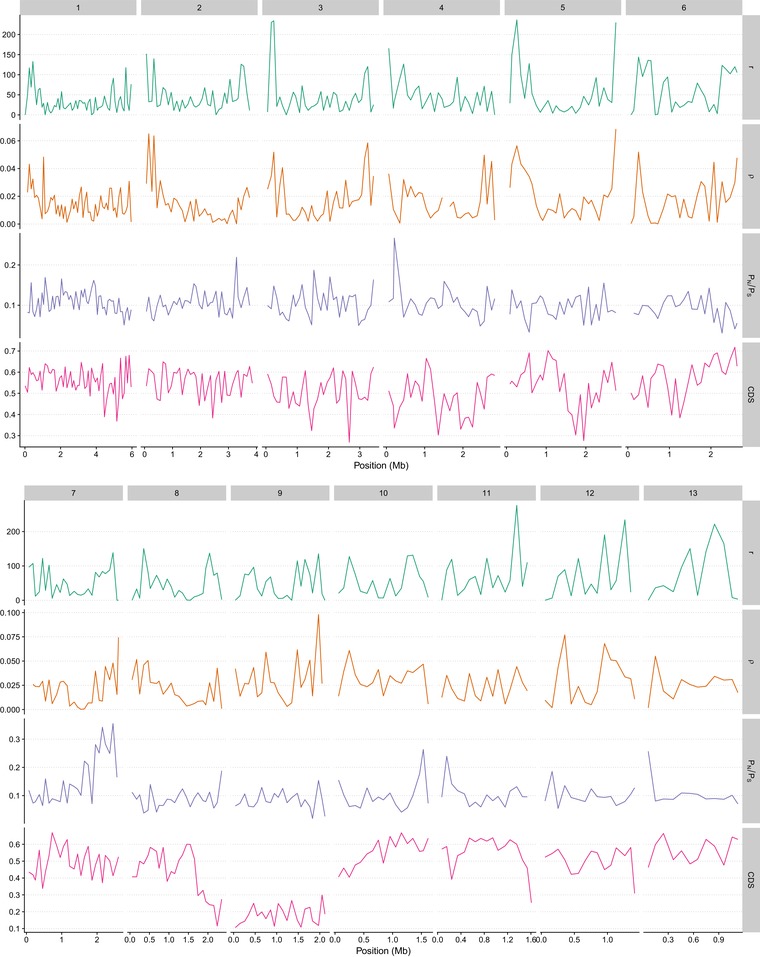
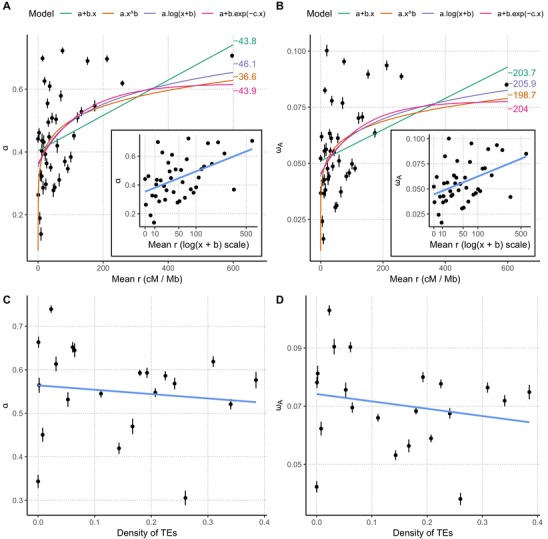
Unravelling the strength, frequency, and distribution of selective variants along the genome as well as the underlying factors shaping this distribution are fundamental goals of evolutionary biology. Antagonistic host-pathogen coevolution is thought to be a major driver of genome evolution between interacting species. While rapid evolution of pathogens has been documented in several model organisms, the genetic mechanisms of their adaptation are still poorly understood and debated, particularly the role of sexual reproduction. Here, we apply a population genomic approach to infer genome-wide patterns of selection among 13 isolates of Zymoseptoria tritici, a fungal pathogen characterized by extremely high genetic diversity, gene density, and recombination rates. We report that the genome of Z. tritici undergoes a high rate of adaptive substitutions, with 44% of nonsynonymous substitutions being adaptive on average. This fraction reaches 68% in so-called effector genes encoding determinants of pathogenicity, and the distribution of fitness effects differs in this class of genes as they undergo adaptive mutations with stronger positive fitness effects, but also more slightly deleterious mutations. Besides the globally high rate of adaptive substitutions, we report a negative relationship between pN/pS and the fine-scale recombination rate and a strong positive correlation between the rate of adaptive nonsynonymous substitutions (ωa) and recombination rate. This result suggests a pervasive role of both background selection and Hill-Robertson interference even in a species with an exceptionally high recombination rate (60 cM/Mb on average). While transposable elements (TEs) have been suggested to contribute to adaptation by creating compartments of fast-evolving genomic regions, we do not find a significant effect of TEs on the rate of adaptive mutations. Overall our study suggests that sexual recombination is a significant driver of genome evolution, even in rapidly evolving organisms subject to recurrent mutations with large positive effects.

Keywords: Adaptation; evolutionary rates; genome evolution; plant pathogenic fungi; recombination.


Conflict of interest statement

The authors declare that they have no competing interests.

Figures

Figure 1
Figure 1
Correlation of the strength of purifying selection with several genomic factors. The pN/pS ratio measures the intensity of purifying selection. (A–G) Points represent median values and error bar the first and third quartiles of the distributions. The x‐axis was discretized in categories with equal point densities for clarity of visualization. Lines represent first, median, and third quantile regression on non‐discretized data. (H–I) Colored bars represent median values and error bar the first and third quartiles of the distributions.
Figure 2
Figure 2
Patterns of selection along the genome of Z. tritici. Recombination rate, population recombination rate, pN/pS ratio, and density of coding sites (CDS) are plotted in windows of 100 kb along the 13 essential chromosomes.
Figure 3
Figure 3
Comparison of the rate of adaptive evolution and distribution of fitness effects in effector and non‐effector genes. (A) Comparison of the estimates of the proportion of adaptive substitutions α and the rate of adaptive substitutions, ωa for genes predicted to encode effector proteins (blue) or not (grey). Histograms (white bars), kernel density plots, and box‐and‐whiskers charts are computed over 100 bootstrap replicates in each case (see Material and Methods). (B) Null distributions of the differences of α and ωa between effectors and non‐effector genes (grey histogram) and the corresponding observed statistics (red line). (C) Average distribution of fitness effects (P), computed as the product of the effective population size Ne and selection coefficient s, over 100 bootstrap replicates for both effector and non‐effector encoding genes. (D) Correlation of inferred parameters over 100 bootstrap replicates of effector and non‐effector encoding genes, for the Gamma (negative selection) and Exponential (positive selection) components, respectively. γ and δ: the mean and shape of the Gamma distribution of negative selection coefficients. ε, mean of the exponential distribution of positive selection coefficients; ψ, the probability that the selection coefficient is positive.
Figure 4
Figure 4
Estimates of the proportion of adaptive substitutions α, and the rate of adaptive substitution, ωa as a function of the recombination rate (r). (A) α as a function of the r. (B) ωa as a function of r. Each point and bars represent the mean estimate, and corresponding standard error for one recombination category over 100 bootstrap replicates. Four models were fitted (colored curves) and corresponding Akaike's information criterion values are indicated in the right margin. Inset plots represent the same data with a logarithmic scale; the b value was set to the corresponding estimate in the third model. Confidence intervals have been omitted for clarity. (C) and (D) Show the effect of TE density on α and ωa, respectively.

References

    1. Aguileta, G. , Lengelle J., Marthey S., Chiapello H., Rodolphe F., Gendrault A., et al. 2010. Finding candidate genes under positive selection in non‐model species: examples of genes involved in host specialization in pathogens. Mol. Ecol. 19:292–306. - PubMed
    1. Birdsell, J. A. 2002. Integrating genomics, bioinformatics, and classical genetics to study the effects of recombination on genome evolution. Mol. Biol. Evol. 19:1181–1197. - PubMed
    1. Blanchette, M. , Kent W. J., Riemer C., Elnitski L., Smit A. F. A., Roskin K. M., et al. 2004. Aligning multiple genomic sequences with the threaded blockset aligner. Genome Res. 14:708–715. - PMC - PubMed
    1. Campos, J. L. , Halligan D. L., Haddrill P. R., and Charlesworth B.. 2014. The relation between recombination rate and patterns of molecular evolution and variation in Drosophila melanogaster . Mol. Biol. Evol. 31:1010–1028. - PMC - PubMed
    1. Castellano, D. , Coronado‐Zamora M., Campos J. L., Barbadilla A., and Eyre‐Walker A.. 2016. Adaptive evolution is substantially impeded by Hill–Robertson interference in Drosophila . Mol. Biol. Evol. 33:442–455. - PMC - PubMed