. 2020 Mar 1;116(3):658-670.
doi: 10.1093/cvr/cvz148.

A human embryonic stem cell reporter line for monitoring chemical-induced cardiotoxicity

Affiliations

A human embryonic stem cell reporter line for monitoring chemical-induced cardiotoxicity

Su-Yi Tsai et al. Cardiovasc Res. .

Erratum in

Abstract

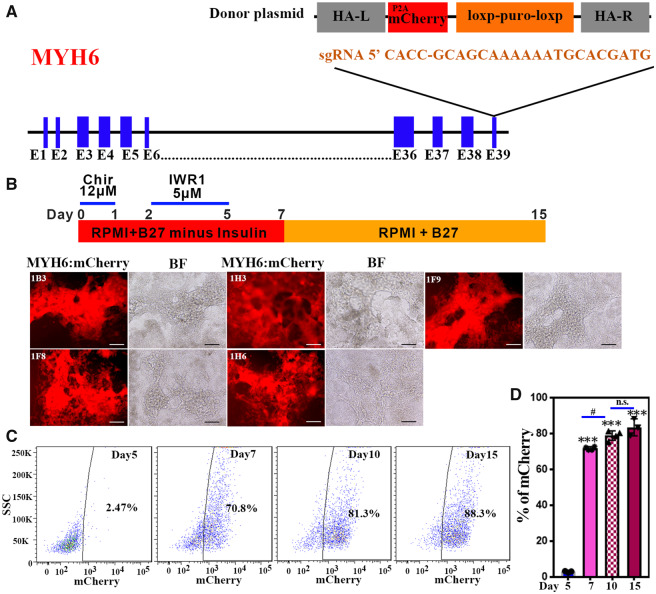
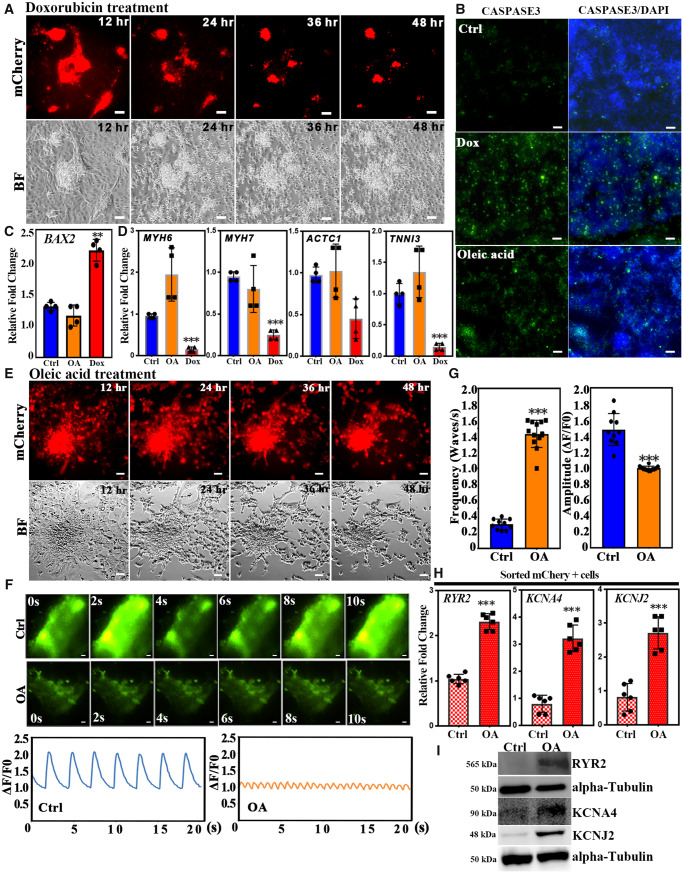
Aims: Human embryonic stem cells (hESCs) can be used to generate scalable numbers of cardiomyocytes (CMs) for studying cardiac biology, disease modelling, drug screens, and potentially for regenerative therapies. A fluorescence-based reporter line will significantly enhance our capacities to visualize the derivation, survival, and function of hESC-derived CMs. Our goal was to develop a reporter cell line for real-time monitoring of live hESC-derived CMs.

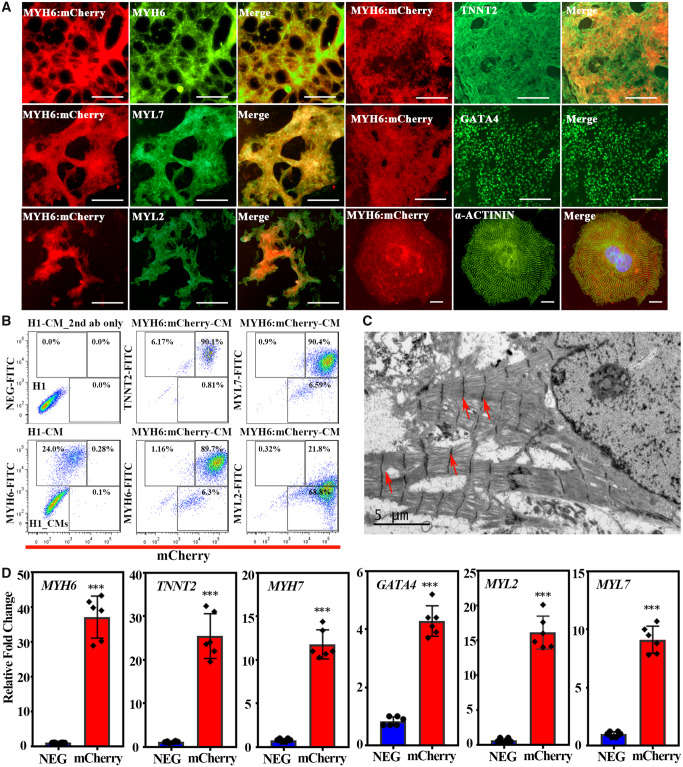
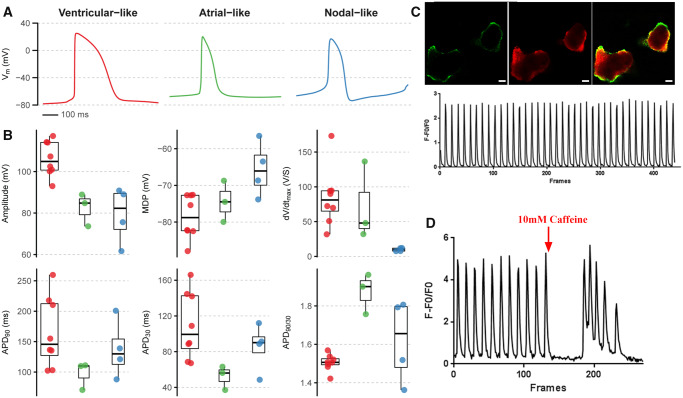
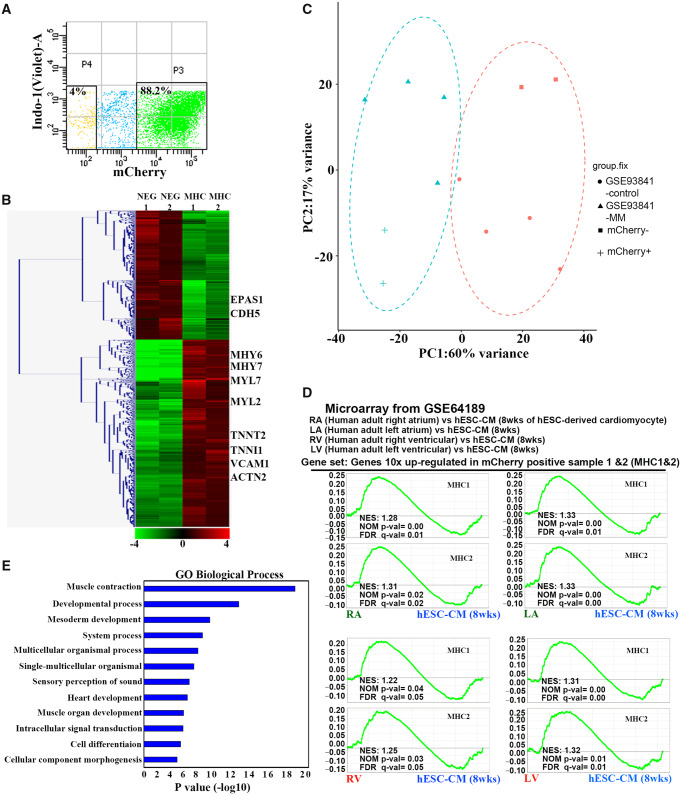
Methods and results: We used CRISPR/Cas9 to knock a mCherry reporter gene into the MYH6 locus of hESC lines, H1 and H9, enabling real-time monitoring of the generation of CMs. MYH6:mCherry+ cells express atrial or ventricular markers and display a range of cardiomyocyte action potential morphologies. At 20 days of differentiation, MYH6:mCherry+ cells show features characteristic of human CMs and can be used successfully to monitor drug-induced cardiotoxicity and oleic acid-induced cardiac arrhythmia.

Conclusion: We created two MYH6:mCherry hESC reporter lines and documented the application of these lines for disease modelling relevant to cardiomyocyte biology.

Keywords: Cardiomyocyte; Cardiotoxicity testing; Disease model; MYH6; hESC reporter.


Figures

Figure 1
Figure 1
MYH6 gene targeting strategy and evaluation of an MYH6:mCherry hESC knock-in reporter line. (A) A sgRNA sequence targets a region close to the stop codon of the MYH6 gene. A P2A-mCherry fluorescence reporter cassette together with an excisable selection marker (PGK-Puro) was inserted using homologous recombination. After genotyping hESC MYH6:mCherry clones, the selection cassette was excised by expression of Cre recombinase. (B) Evaluation of the hESC MYH6:mCherry knock-in reporter line following human cardiomyocyte differentiation. Five independent MYH6:mCherry clones show mCherry fluorescent signals at differentiation Day 15. Scale bar: 100 µm. (C) Percentage of mCherry populations analysed by flow cytometry at different cardiac differentiation stages at Days 5, 7, 10, and 15, respectively. (D) Quantification of the mCherry+ population. Results represent three independent experiments. A two-tailed Student’s t-test was used to calculate statistical significance. Error bars show SD. Statistical significance is indicated: #P < 0.05, ∗∗∗P < 0.001. n.s., not significant.
Figure 2
Figure 2
MYH6:mCherry+ cells express cardiac markers and display well-organized sarcomeric structure. (A) MYH6:mCherry+ cells co-express cardiac markers MYH6, MYL7, MYL2, TNNT2, GATA4, and ACTN2 at differentiation Day 15. In the merged images, MYH6:mCherry are shown in red and individual cardiac makers are coloured by green. Scale bar: 100 µm, except for ACTN2: 10 µm. (B) Flow cytometry analysis of MYH6:mCherry+ CMs with co-expressed cardiac markers. (C) Transmission electron micrograph demonstrating the sarcomeric structures in MYH6:mCherry+ CMs. Red arrows indicate Z-lines. (D) Expression of cardiac genes in MYH6:mCherry sorted cells. Results represent data from three independent experiments. A two-tailed Student’s t-test was used to calculate statistical significance. Error bars show SD. Statistical significance is indicated: ∗∗∗P < 0.001.
Figure 3
Figure 3
MYH6:mCherry+ cells display atrial-like, ventricular-like, or nodal-like action potential morphology. (A) Examples of the mean spontaneous action potential recorded using whole-cell patch clamp from each of the three subtypes characterized by upstroke velocity (dV/dtmax) and action potential shape (APD90/30 ratio). (B) Action potential parameters from all recorded cells (n = 15) separated by subtype. Boxplot whiskers represent maximum and minimum values within 1.5*inter-quartile range. (C) Images of calcium transients of MYH6:mCherry expressing cells. Scale bar: 50 µm. (D) MYH6:mCherry+ cells respond to caffeine stimulation. Data represent cells analysed from three independent experiments.
Figure 4
Figure 4
ESC-derived MYH6:mCherry+ cells display cardiac gene expression profiles. (A) A representative FACS plot of MYH6:mCherry+ and MYH6:mCherry cell populations. Cells were harvested at differentiation Day 20. (B) Hierarchical clustering analysis of altered gene expression based on RNA sequencing from MYH6:mCherry+ and MYH6:mCherry populations. (C) PCA analysis of the transcriptome of MYH6:mCherry+ and MYH6:mCherry cells and previously published hESC-derived cardiomyocytes (GSE93841). GSE93841-MM: hESC-derived CMs cultured in maturation medium; GSE93841-control: hESC-derived cells cultured in control medium; (D) GSEA analysis indicates that genesets of two independent MYH6:mCherry+ samples (MHC1 and MHC2) are both significantly enriched in adult human right/left atrial and ventricular cells compared to hESC-CMs (at 8 weeks). A published microarray dataset (GSE64189) and the genesets that are >10-fold up-regulated from MYH6:mCherry+ populations were used for comparison. Enriched genesets are selected based on statistical significance (FDR q value <0.25 and/or NOM P value <0.05). MHC 1 and MHC2: two independent MYH6:mCherry+ samples. RA/LA: human adult right/left atrium. RV/LV: human adult right/left ventricular cells. hESC-CM (8 weeks): hESC-derived cardiomyocytes harvested at differentiation Week 8. (E) GO biological process analyses of the genes that are significantly enriched in human adult right/left atrial samples. Sorted cells are from two independent experiments.
Figure 5
Figure 5
Establishment of a platform for cardiotoxicity testing. (A) Day 20 differentiated CMs were treated with 20 µM doxorubixin (Dox) and monitored for 48 h. Shown are representative live images. CMs started to die after 12 h Dox treatment. (B) CMs were harvested and stained with the apoptotic marker cleaved-CASPASE 3 after Dox treatment for 24 h and OA treatment for 48 h, respectively. Green fluorescence indicates cleaved-CASPASE 3+ cells. Scale bar: 50 µm. (C) The expression levels of BAX2 were measured by qRT-PCR in control, OA, and Dox treatments. (D) The expression levels of cardiac genes were determined by qRT-PCR. (E) Day 20 differentiated CMs were treated with 8 mM OA and monitored for 48 h. Shown are representative live images. (F) Shown are representative images of calcium transits of control (Ctrl) or cells showing OA-induced tachycardia. Scale bar: 50 µm. Low panel: quantification of calcium transits. (G) Frequency and amplitude quantification of calcium transits. (H) OA induces the expression levels of transcripts encoding calcium-handling genes RYR2, KCNA4, and KCNJ2. MYH6:mCherry+ cells were sorted from control and OA-treated cells. (I) Representative western blot of RYR2, KCNA4, and KCNJ2 in lysates from control or OA-treated cells. Error bars show SD. Results are from three independent experiments. A two-tailed Student’s t-test was used to calculate statistical significance. Statistical significance is indicated: ∗∗P < 0.01, ∗∗∗P < 0.001.

References

    1. Mozaffarian D, Benjamin EJ, Go AS, Arnett DK, Blaha MJ, Cushman M, de Ferranti S, Despres JP, Fullerton HJ, Howard VJ, Huffman MD, Judd SE, Kissela BM, Lackland DT, Lichtman JH, Lisabeth LD, Liu S, Mackey RH, Matchar DB, McGuire DK, Mohler ER 3rd, Moy CS, Muntner P, Mussolino ME, Nasir K, Neumar RW, Nichol G, Palaniappan L, Pandey DK, Reeves MJ, Rodriguez CJ, Sorlie PD, Stein J, Towfighi A, Turan TN, Virani SS, Willey JZ, Woo D, Yeh RW, Turner MB.. Heart disease and stroke statistics–2015 update: a report from the American Heart Association. Circulation 2015;131:17. - PubMed
    1. Burridge PW, Matsa E, Shukla P, Lin ZC, Churko JM, Ebert AD, Lan F, Diecke S, Huber B, Mordwinkin NM, Plews JR, Abilez OJ, Cui B, Gold JD, Wu JC.. Chemically defined generation of human cardiomyocytes. Nat Methods 2014;11:855–860. - PMC - PubMed
    1. Lian X, Hsiao C, Wilson G, Zhu K, Hazeltine LB, Azarin SM, Raval KK, Zhang J, Kamp TJ, Palecek SP.. Robust cardiomyocyte differentiation from human pluripotent stem cells via temporal modulation of canonical Wnt signaling. Proc Natl Acad Sci U S A 2012;109:29. - PMC - PubMed
    1. Dubois NC, Craft AM, Sharma P, Elliott DA, Stanley EG, Elefanty AG, Gramolini A, Keller G.. SIRPA is a specific cell-surface marker for isolating cardiomyocytes derived from human pluripotent stem cells. Nat Biotechnol 2011;29:1011–1018. - PMC - PubMed
    1. Elliott DA, Braam SR, Koutsis K, Ng ES, Jenny R, Lagerqvist EL, Biben C, Hatzistavrou T, Hirst CE, Yu QC, Skelton RJ, Ward-van Oostwaard D, Lim SM, Khammy O, Li X, Hawes SM, Davis RP, Goulburn AL, Passier R, Prall OW, Haynes JM, Pouton CW, Kaye DM, Mummery CL, Elefanty AG, Stanley EG.. NKX2-5(eGFP/w) hESCs for isolation of human cardiac progenitors and cardiomyocytes. Nat Methods 2011;8:1037–1040. - PubMed

Publication types

MeSH terms