

Identification of key candidate genes involved in melanoma metastasis
- PMID: 31173190
- PMCID: PMC6625188
- DOI: 10.3892/mmr.2019.10314
Identification of key candidate genes involved in melanoma metastasis
Abstract
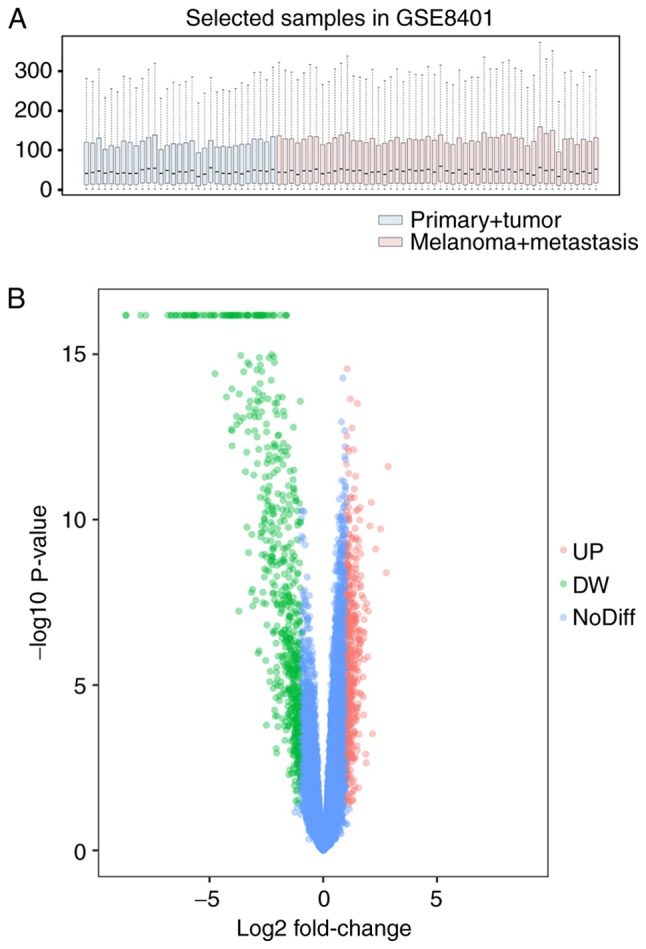
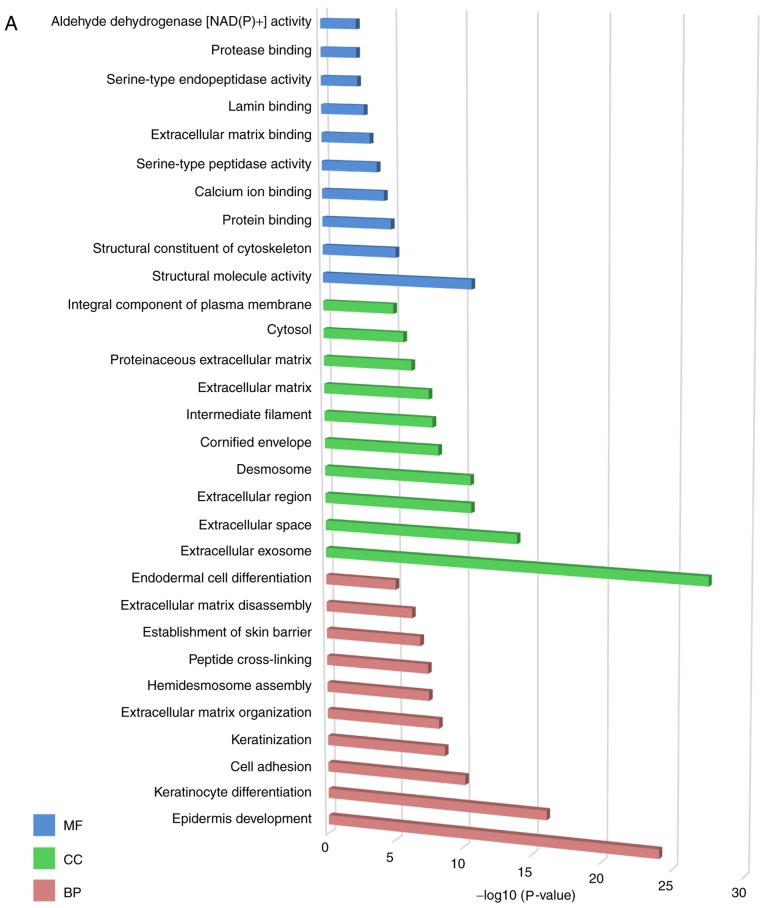
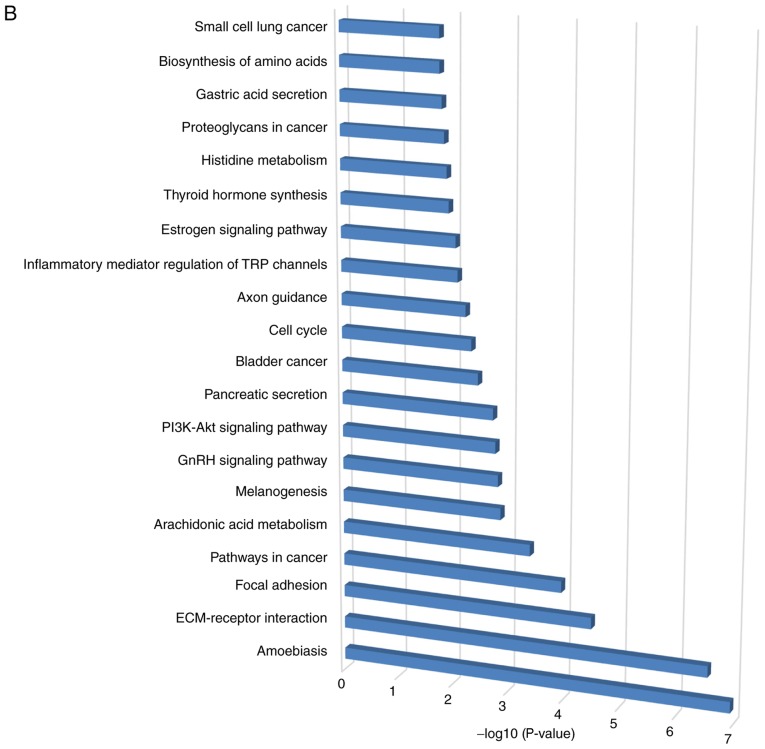
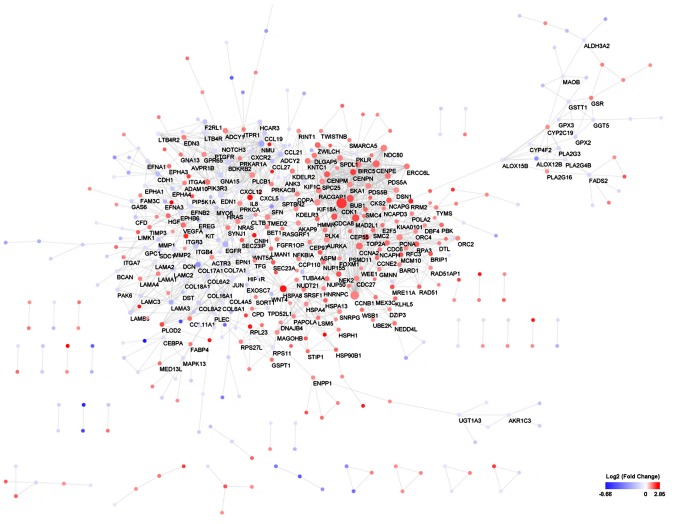
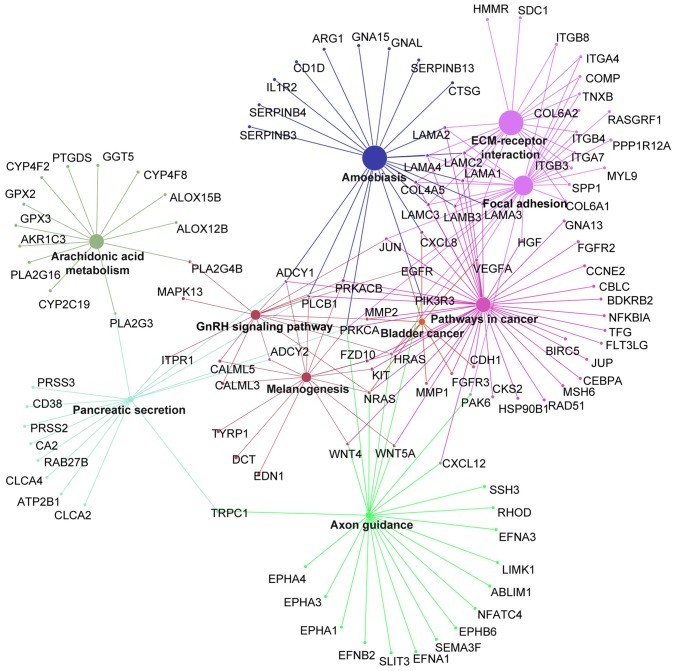
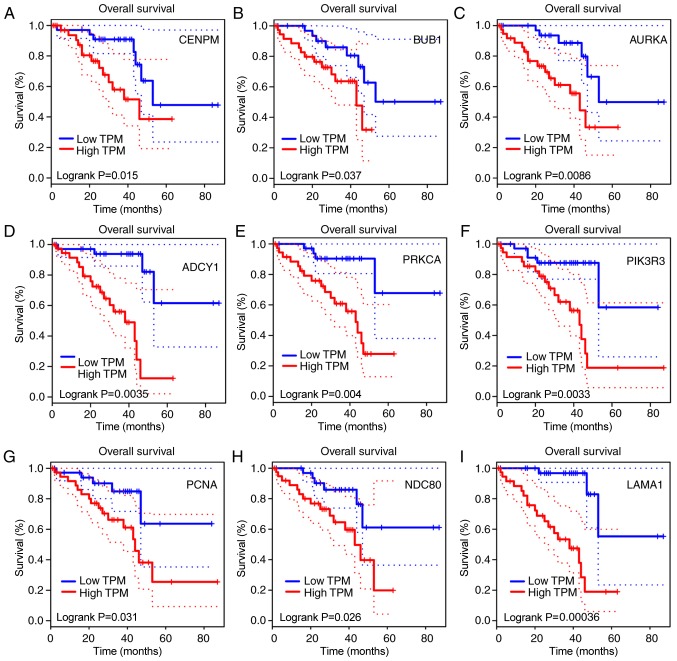
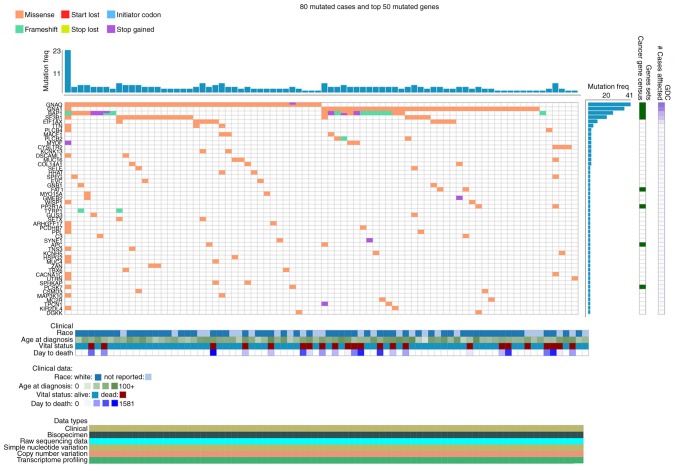
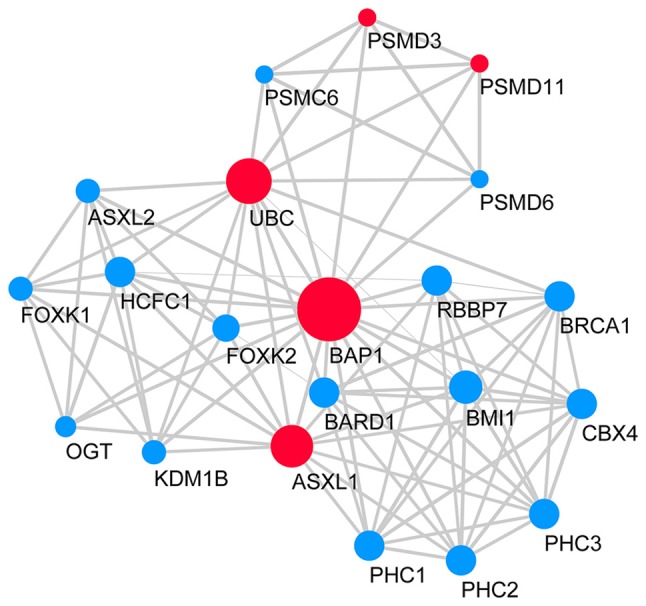
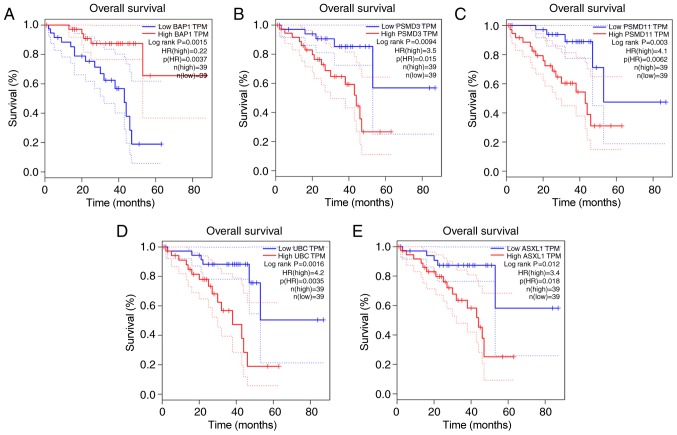
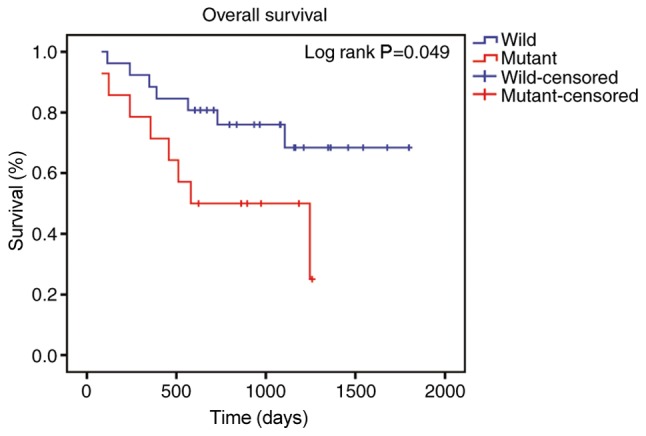
Metastasis is the most lethal stage of cancer progression. The present study aimed to investigate the underlying molecular mechanisms of melanoma metastasis using bioinformatics. Using the microarray dataset GSE8401 from the Gene Expression Omnibus database, which included 52 biopsy specimens from patients with melanoma metastasis and 31 biopsy specimens from patients with primary melanoma, differentially expressed genes (DEGs) were identified, subsequent to data preprocessing with the affy package, followed by Gene Ontology and Kyoto Encyclopedia of Genes and Genomes (KEGG) pathway enrichment analyses. A protein‑protein interaction (PPI) network was constructed. Mutated genes were analyzed with 80 mutated cases with melanoma from The Cancer Genome Atlas. The overall survival of key candidate DEGs, which were within a filtering of degree >30 criteria in the PPI network and involved three or more KEGG signaling pathways, and genes with a high mutation frequency were delineated. The expression analysis of key candidate DEGs, mutant genes and their associated genes were performed on UALCAN. Of the 1,187 DEGs obtained, 505 were upregulated and 682 were downregulated. 'Extracellular exosome' processes, the 'amoebiasis' pathway, the 'ECM‑receptor interaction' pathway and the 'focal adhesion' signaling pathway were significantly enriched and identified as important processes or signaling pathways. The overall survival analysis of phosphoinositide‑3‑kinase regulator subunit 3 (PIK3R3), centromere protein M (CENPM), aurora kinase A (AURKA), laminin subunit α 1 (LAMA1), proliferating cell nuclear antigen (PCNA), adenylate cyclase 1 (ADCY1), BUB1 mitotic checkpoint serine/threonine kinase (BUB1), NDC80 kinetochore complex component (NDC80) and protein kinase C α (PRKCA) in DEGs was statistically significant. Mutation gene analysis identified that BRCA1‑associated protein 1 (BAP1) had a higher mutation frequency and survival analysis, and its associated genes in the BAP1‑associated PPI network, including ASXL transcriptional regulator 1 (ASXL1), proteasome 26S subunit, non‑ATPase 3 (PSMD3), proteasome 26S subunit, non ATPase 11 (PSMD11) and ubiquitin C (UBC), were statistically significantly associated with the overall survival of patients with melanoma. The expression levels of PRKCA, BUB1, BAP1 and ASXL1 were significantly different between primary melanoma and metastatic melanoma. Based on the present study, 'extracellular exosome' processes, 'amoebiasis' pathways, 'ECM‑receptor interaction' pathways and 'focal adhesion' signaling pathways may be important in the formation of metastases from melanoma. The involved genes, including PIK3R3, CENPM, AURKA, LAMA1, PCNA, ADCY1, BUB1, NDC80 and PRKCA, and mutation associated genes, including BAP1, ASXL1, PSMD3, PSMD11 and UBC, may serve important roles in metastases of melanoma.
Figures
Similar articles
-
Identification of candidate biomarkers and pathways associated with SCLC by bioinformatics analysis.Mol Med Rep. 2018 Aug;18(2):1538-1550. doi: 10.3892/mmr.2018.9095. Epub 2018 May 29. Mol Med Rep. 2018. PMID: 29845250 Free PMC article.
-
Identification of key genes and associated pathways in KIT/PDGFRA wild‑type gastrointestinal stromal tumors through bioinformatics analysis.Mol Med Rep. 2018 Nov;18(5):4499-4515. doi: 10.3892/mmr.2018.9457. Epub 2018 Sep 5. Mol Med Rep. 2018. PMID: 30221743 Free PMC article.
-
Investigation of crucial genes and microRNAs in conventional osteosarcoma using gene expression profiling analysis.Mol Med Rep. 2017 Nov;16(5):7617-7624. doi: 10.3892/mmr.2017.7506. Epub 2017 Sep 18. Mol Med Rep. 2017. PMID: 28944822
-
The emerging role of the thrombin receptor (PAR-1) in melanoma metastasis--a possible therapeutic target.Oncotarget. 2011 Jan-Feb;2(1-2):8-17. doi: 10.18632/oncotarget.211. Oncotarget. 2011. PMID: 21378407 Free PMC article. Review.
-
Emerging molecular targets in melanoma invasion and metastasis.Pigment Cell Melanoma Res. 2013 Jan;26(1):39-57. doi: 10.1111/pcmr.12041. Epub 2012 Nov 21. Pigment Cell Melanoma Res. 2013. PMID: 23095214 Review.
Cited by
-
Multi-omics data integration for subtype identification of Chinese lower-grade gliomas: A joint similarity network fusion approach.Comput Struct Biotechnol J. 2022 Jul 2;20:3482-3492. doi: 10.1016/j.csbj.2022.06.065. eCollection 2022. Comput Struct Biotechnol J. 2022. PMID: 35860412 Free PMC article.
-
Reproductive history and blood cell DNA methylation later in life: the Young Finns Study.Clin Epigenetics. 2021 Dec 20;13(1):227. doi: 10.1186/s13148-021-01215-1. Clin Epigenetics. 2021. PMID: 34930449 Free PMC article.
-
Upregulation of CENPM facilitates tumor metastasis via the mTOR/p70S6K signaling pathway in pancreatic cancer.Oncol Rep. 2020 Sep;44(3):1003-1012. doi: 10.3892/or.2020.7673. Epub 2020 Jul 7. Oncol Rep. 2020. PMID: 32705259 Free PMC article.
-
GNG7 and ADCY1 as diagnostic and prognostic biomarkers for pancreatic adenocarcinoma through bioinformatic-based analyses.Sci Rep. 2021 Oct 14;11(1):20441. doi: 10.1038/s41598-021-99544-x. Sci Rep. 2021. PMID: 34650124 Free PMC article.
-
High expression of LIMD2 predicts a poor prognosis and promotes migration of colon cancer cells.Discov Oncol. 2025 Aug 14;16(1):1550. doi: 10.1007/s12672-025-03424-z. Discov Oncol. 2025. PMID: 40813949 Free PMC article.
References
-
- Pessina F, Navarria P, Tomatis S, Cozzi L, Franzese C, Di Guardo L, Ascolese AM, Reggiori G, Franceschini D, Del Vecchio M, et al. Outcome evaluation of patients with limited brain metastasis from malignant melanoma, treated with surgery, radiation therapy, and targeted therapy. World Neurosurg. 2017;105:184–190. doi: 10.1016/j.wneu.2017.05.131. - DOI - PubMed
-
- Xu L, Shen SS, Hoshida Y, Subramanian A, Ross K, Brunet JP, Wagner SN, Ramaswamy S, Mesirov JP, Hynes RO. Gene expression changes in an animal melanoma model correlate with aggressiveness of human melanoma metastases. Mol Cancer Res. 2008;6:760–769. doi: 10.1158/1541-7786.MCR-07-0344. - DOI - PMC - PubMed
MeSH terms
Substances
LinkOut - more resources
Full Text Sources
Medical
Research Materials
Miscellaneous
