. 2019 Jun 7;11(11):3418-3431.
doi: 10.18632/aging.102001.

α-Ketoglutarate inhibits autophagy

Affiliations

α-Ketoglutarate inhibits autophagy

Elisa Elena Baracco et al. Aging (Albany NY). .

Abstract

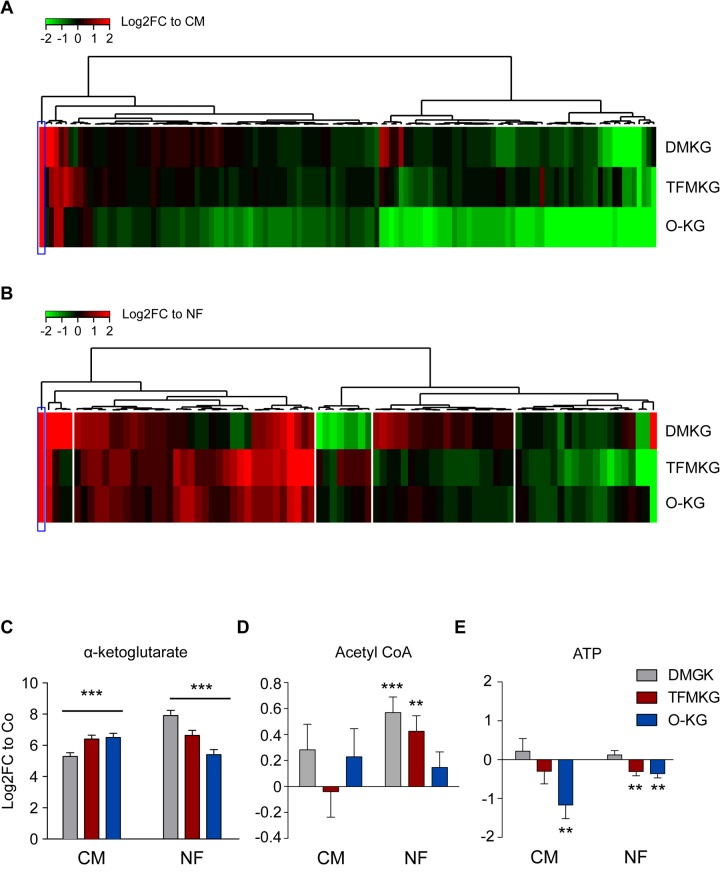
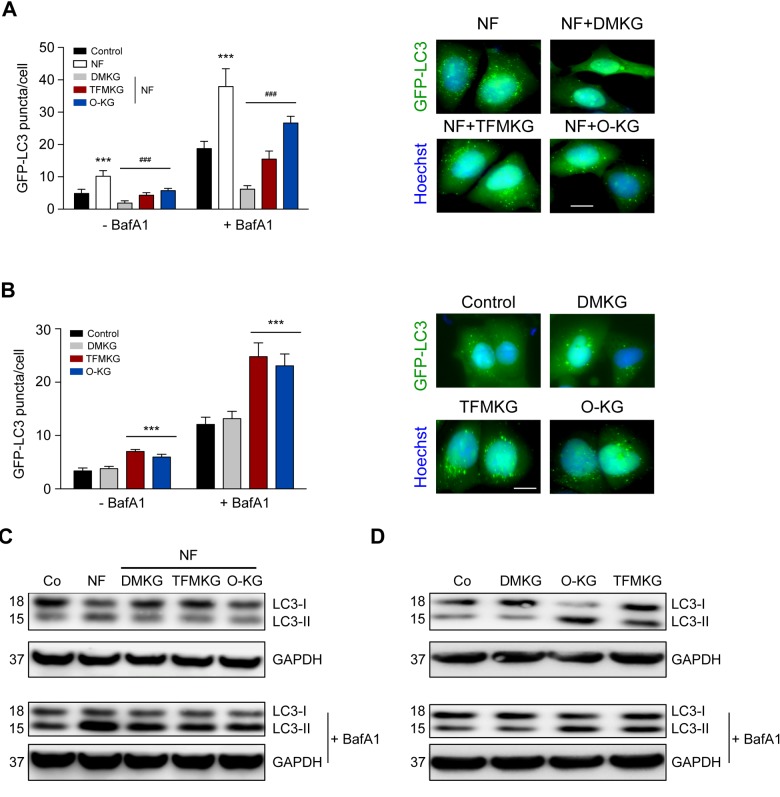
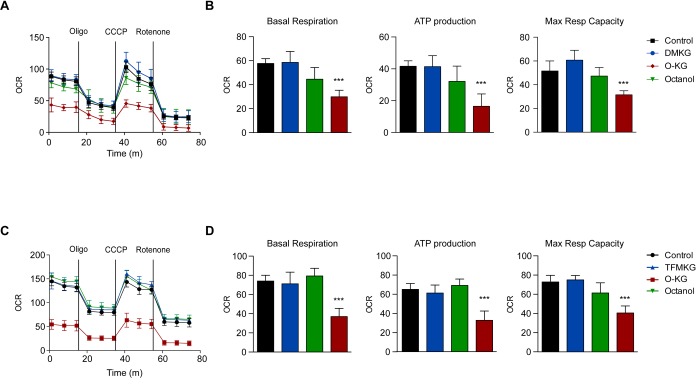
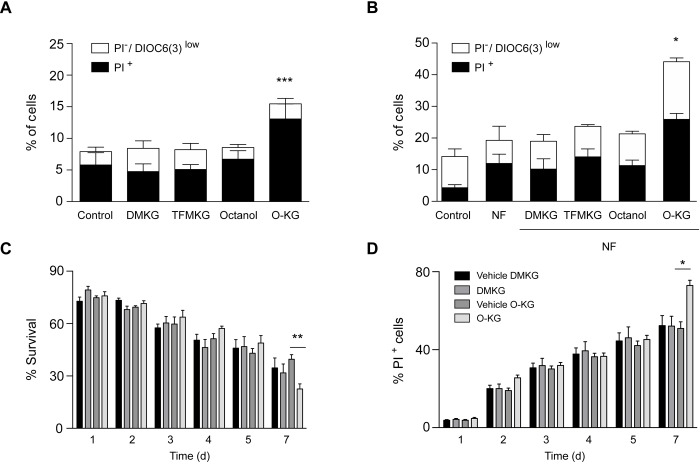
The metabolite α-ketoglutarate is membrane-impermeable, meaning that it is usually added to cells in the form of esters such as dimethyl -ketoglutarate (DMKG), trifluoromethylbenzyl α-ketoglutarate (TFMKG) and octyl α-ketoglutarate (O-KG). Once these compounds cross the plasma membrane, they are hydrolyzed by esterases to generate α-ketoglutarate, which remains trapped within cells. Here, we systematically compared DMKG, TFMKG and O-KG for their metabolic and functional effects. All three compounds similarly increased the intracellular levels of α-ketoglutarate, yet each of them had multiple effects on other metabolites that were not shared among the three agents, as determined by mass spectrometric metabolomics. While all three compounds reduced autophagy induced by culture in nutrient-free conditions, TFMKG and O-KG (but not DMKG) caused an increase in baseline autophagy in cells cultured in complete medium. O-KG (but neither DMKG nor TFMK) inhibited oxidative phosphorylation and exhibited cellular toxicity. Altogether, these results support the idea that intracellular α-ketoglutarate inhibits starvation-induced autophagy and that it has no direct respiration-inhibitory effect.

Keywords: Krebs cycle; acetyl CoA; aging; cell death; metabolomics; mitochondria.


Conflict of interest statement

CONFLICTS OF INTEREST: GK and FM are scientific cofounders of Samsara Therapeutics.

Figures

Figure 1
Figure 1
Metabolic effects of α-ketoglutarate precursors. (A, B) Unsupervised hierarchical clustering of intracellular metabolites in U2OS cells treated with the α-ketoglutarate precursors dimethyl α-ketoglutarate (DMKG), trifluoromethylbenzyl α-ketoglutarate (TFMKG) and octyl α-ketoglutarate (O-KG) in complete (CM) (A) or nutrient free (NF) medium (B) for 4 h at the concentrations indicated in the Experimental Procedure section. Heat maps depict log2 fold changes to the control of metabolite signals found altered (False Discovery Rate [FDR]< 0.1) upon incubation with α-ketoglutarate precursors. (C-E) Impact of α-ketoglutarate precursors on intracellular levels of α-ketoglutarate (C) and the energy related metabolites AcetylCoA (D) and ATP (E). Data represent averaged log2 fold change ± S.E.M. to the controls (CM or NF). *** p < 0.001; ** p< 0.01 (unpaired t test).
Figure 2
Figure 2
Modulation of autophagy by α-ketoglutarate precursors. (A) Inhibition of starvation-induced autophagy by DMKG, TFMKG and O-KG. U2OS cells stably expressing the autophagic markers GFP-LC3 were incubated in HBSS medium (NF) and left untreated or incubated with α-ketoglutarate precursors for 4h. Co-treatment with bafilomycin A1 (BafA1) was used to assess autophagic flux. Representative pictures (in presence of BafA1) (right panel) and quantification (left panel) are shown. Data represent mean ± S.D. (one representative experiment, n=3). *** p < 0.001 (compared to Control); ### p < 0.001 (compared to NF) (unpaired t test). Scale bar 10 μm. (B) Induction of autophagy by TFMKG and O-KG, but not DMKG, in complete medium. *** p < 0.001 (compared to Control); (unpaired t test). Scale bar 10 μm. (C, D) Immunoblotting showing the conversion of LC3I to LC3II in U2OS cells treated with α-ketoglutarate precursors in NF (C) or complete medium (D) in presence or absence of BafA1 to monitor autophagic flux (one representative experiment, n=3).
Figure 3
Figure 3
Influence of α-ketoglutarate precursors on mitochondrial metabolism (A-D) O-KG, but not DMKG and TFMKG, inhibits mitochondrial respiration. U2OS cells were incubated for 6 h in presence or absence of DMKG (A, B), TFMKG (C, D), O-KG and octanol (A-D); after pre-incubation with distinct α-ketoglutarate precursors, oxygen consumption rate (OCR) was monitored in a Seahorse XF analyzer upon injection of the complex V inhibitor oligomycin (Oligo), the uncoupler carbonyl cyanide 3-chlorophenylhydrazone (CCCP) and the complex I inhibitor rotenone at the concentrations indicated in the Experimental Procedure section. Mitochondrial function was evaluated as basal respiration (B, D, left panel), ATP production (B, D, middle panel) and maximal respiratory capacity (B, D, right panel). Data are depicted as mean ± S.D. (one representative experiment, n=3). *** p < 0.001 (compared to Control) (unpaired t test)
Figure 4
Figure 4
Impact of α-ketoglutarate precursors on cell viability. (A-B) Cytofluorimetric assessment of cell death elicited upon administration of distinct α-ketoglutarate precursors to U2OS cells in complete (A) or nutrient free medium (NF) (B) for 4 h. PI+ = dead cells; PI-/DiOC6(3) low cells = dying cells. Data (depicted as percentage of cells) represent mean ± S.D. (one representative experiment, n=3). *** p < 0.001 (compared to Control); * p < 0.05 (compared to NF) (unpaired t test). (C). Survival rates of treated (200 µM) and control cells were analyzed at indicated timepoints via clonogenicity assay. (D) Plasma membrane integrity via PI staining of treated (200 µM) versus control yeast cells was monitored at indicated timepoints during chronological aging. Data represent mean ± S.E.M of at least 3 independent experiments. ** p < 0.01; * π < 0.05 (Compared to O-KG vehicle); (two-way Anova).

References

    1. Krebs HA, Eggleston LV. The oxidation of pyruvate in pigeon breast muscle. Biochem J. 1940; 34: 442– 59. 10.1042/bj0340442 - DOI - PMC - PubMed
    1. Owen OE, Kalhan SC, Hanson RW. The key role of anaplerosis and cataplerosis for citric acid cycle function. J Biol Chem. 2002; 277: 30409– 12. 10.1074/jbc.R200006200 - DOI - PubMed
    1. Galluzzi L, Kepp O, Vander Heiden MG, Kroemer G. Metabolic targets for cancer therapy. Nat Rev Drug Discov. 2013; 12: 829– 46. 10.1038/nrd4145 - DOI - PubMed
    1. Bento CF, Renna M, Ghislat G, Puri C, Ashkenazi A, Vicinanza M, Menzies FM, Rubinsztein DC. Mammalian Autophagy: How Does It Work? Annu Rev Biochem. 2016; 85: 685– 713. 10.1146/annurev-biochem-060815-014556 - DOI - PubMed
    1. Levine B, Kroemer G. Biological Functions of Autophagy Genes: A Disease Perspective. Cell. 2019; 176: 11– 42. 10.1016/j.cell.2018.09.048 - DOI - PMC - PubMed

Publication types

Substances