. 2019 Jun 6;8(6):547.
doi: 10.3390/cells8060547.

Methylglyoxal Acts as a Tumor-Promoting Factor in Anaplastic Thyroid Cancer

Affiliations

Methylglyoxal Acts as a Tumor-Promoting Factor in Anaplastic Thyroid Cancer

Cinzia Antognelli et al. Cells. .

Abstract

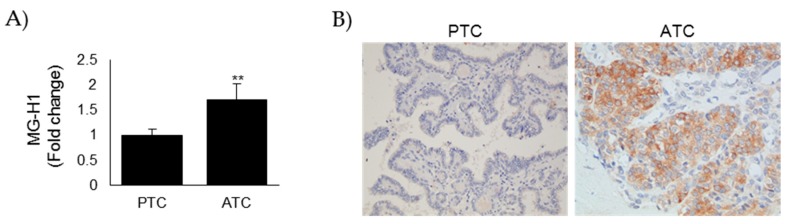
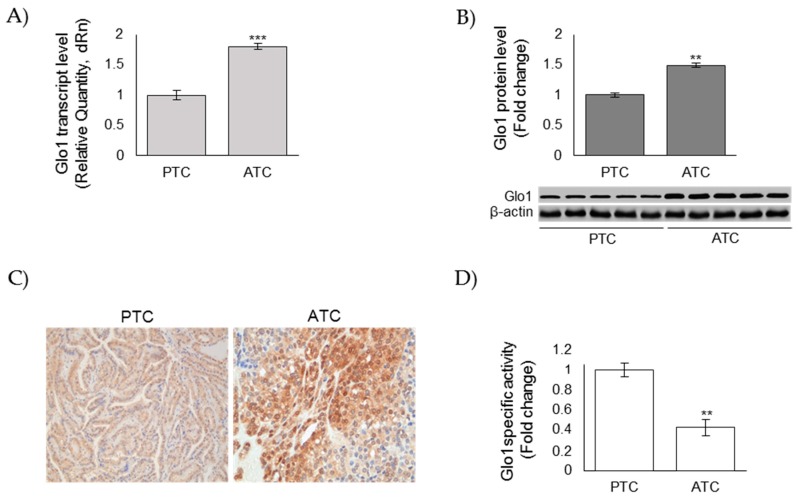
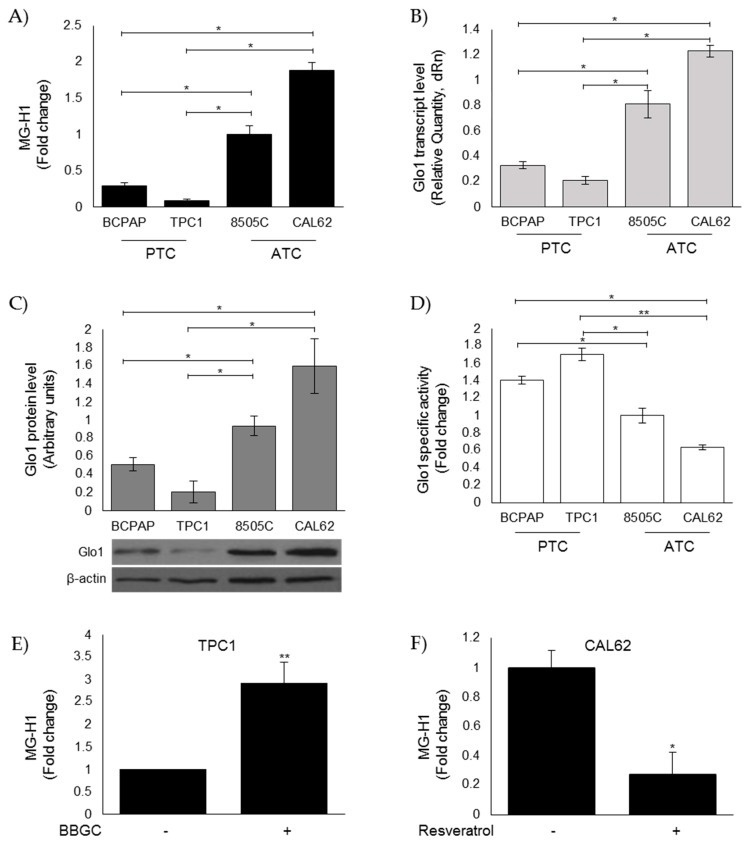
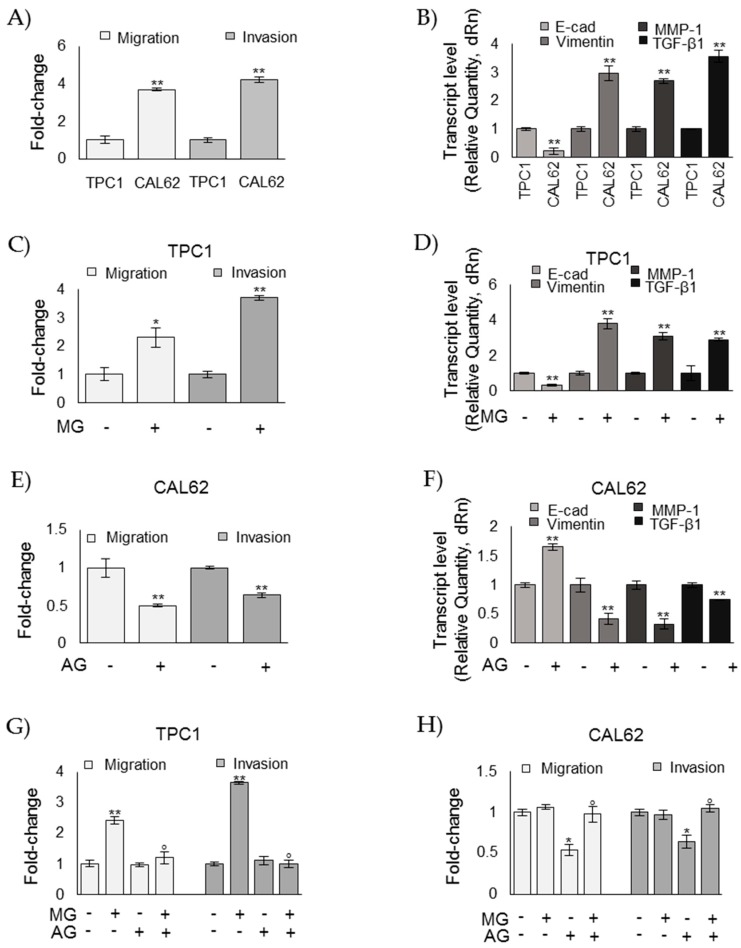
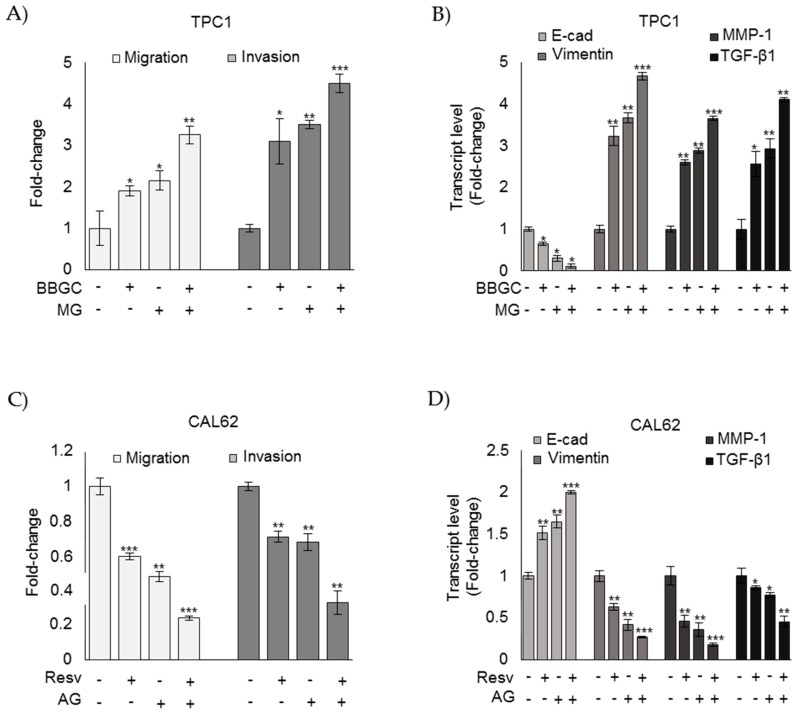
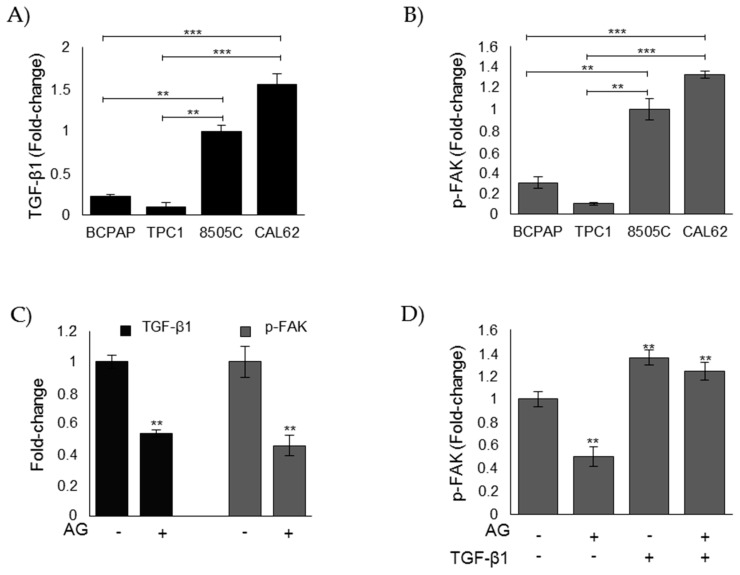
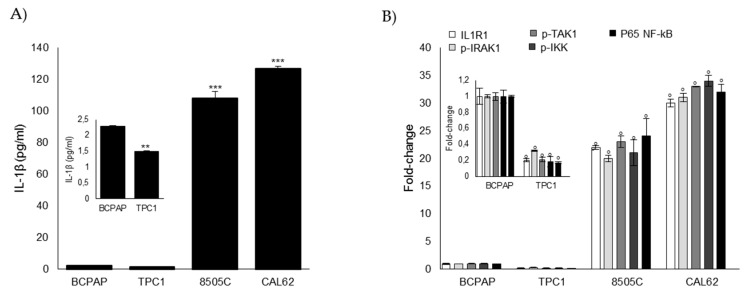
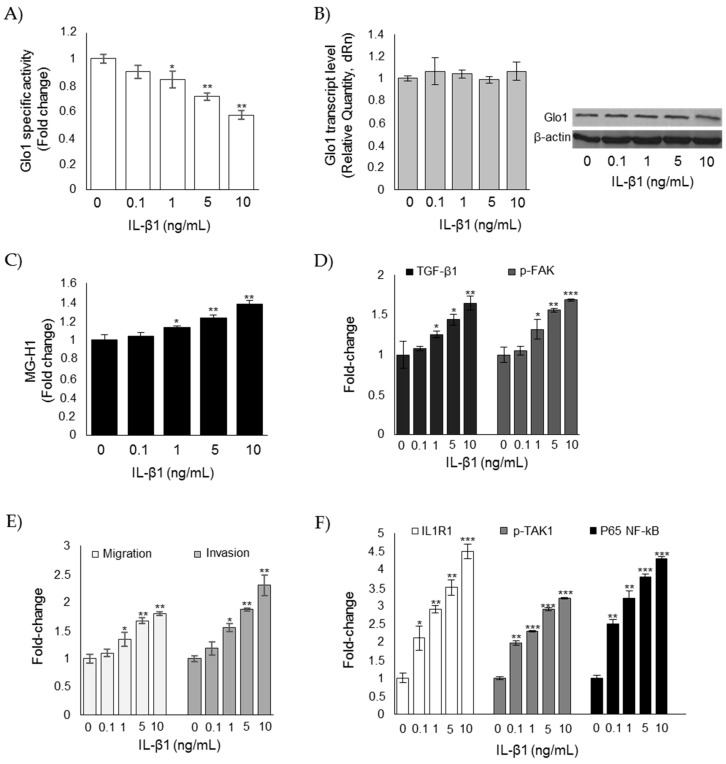
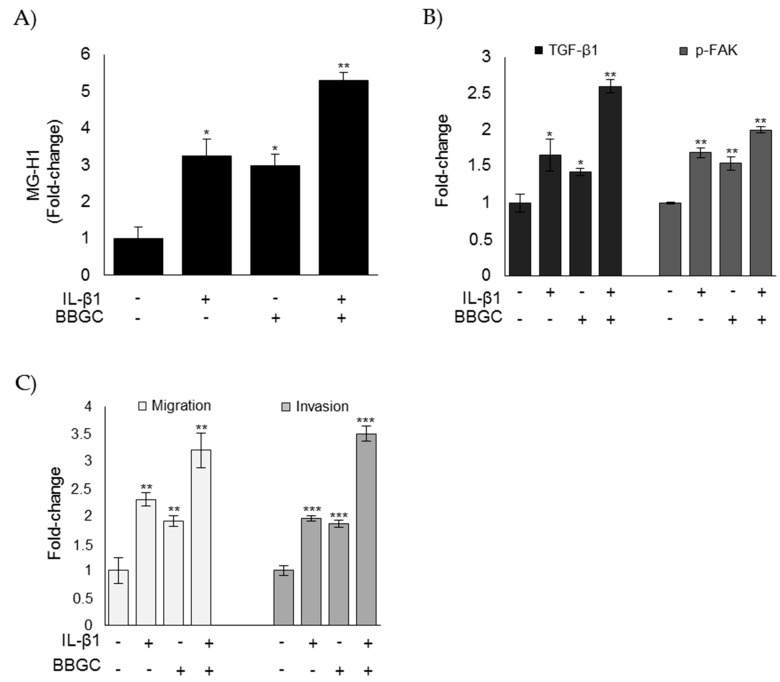
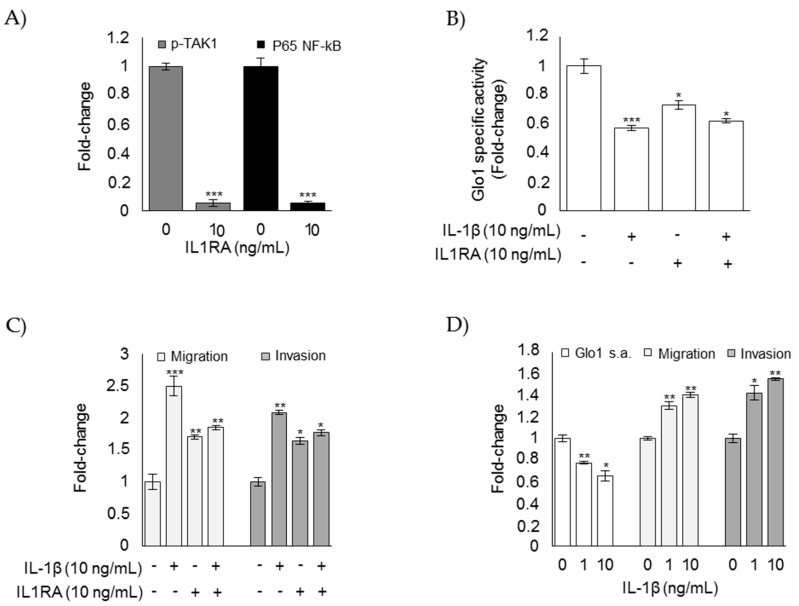
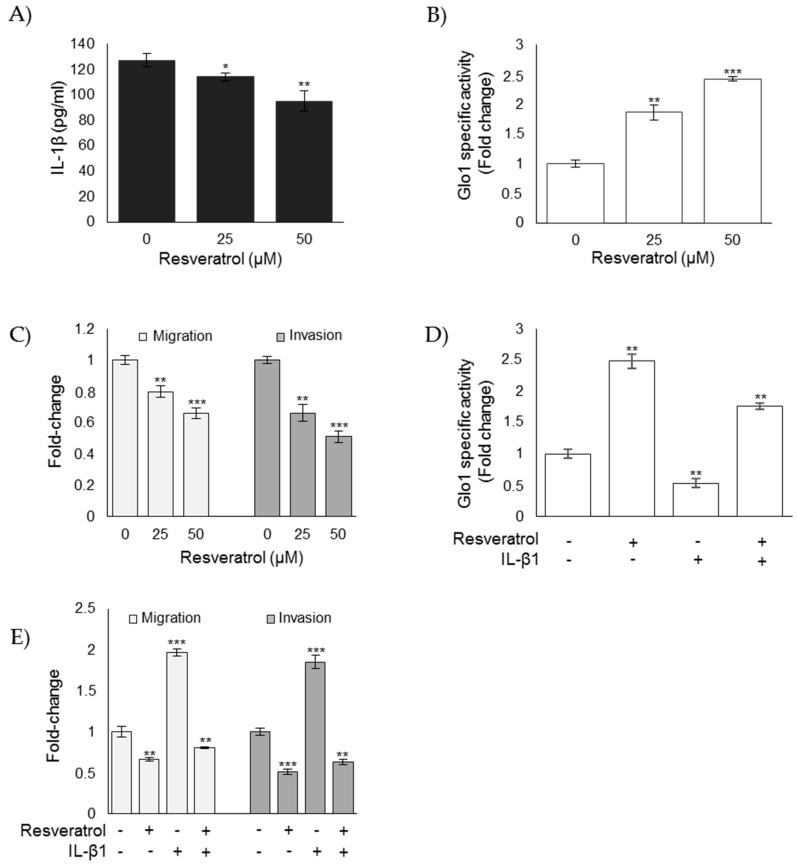
Methylglyoxal (MG) is a potent inducer of advanced glycation end products (AGEs). MG, long considered a highly cytotoxic molecule with potential anticancer value, is now being re-evaluated to a protumorigenic agent in some malignancies. Anaplastic thyroid cancer (ATC) is an extremely aggressive and highly lethal cancer for which conventional therapies have proved ineffective. Successful therapeutic intervention in ATC is undermined by our poor understanding of its molecular etiology. In the attempt to understand the role of MG in ATC aggressiveness, we used immunohistochemistry to examine the level of MG protein adducts in ATC and slow-growing papillary thyroid cancer (PTC). We detected a high level of MG adducts in ATC compared to PTC ones, suggesting a protumor role for MG-mediated dicarbonyl stress in ATC. Accordingly, MG adduct accumulation in ATC cells in vitro was associated with a marked mesenchymal phenotype and increased migration/invasion, which were both reversed by aminoguanidine (AG)-a scavenger of MG-and resveratrol-an activator of Glyoxalase 1 (Glo1), the key metabolizing enzyme of MG. Our study represents the first demonstration that MG, via AGEs, acts as a tumor-promoting factor in ATC and suggests that MG scavengers and/or Glo1 activators merit investigations as potential therapeutic strategies for this malignancy.

Keywords: AGEs; EMT; aminoguanidine; anaplastic thyroid cancer; glyoxalase 1; methylglyoxal; resveratrol.


Conflict of interest statement

The authors declare no conflict of interest.

Figures

Figure 1
Figure 1
MG-derived hydroimidazolone (MG-H1) adducts are accumulated in anaplastic thyroid cancer (ATC) tissues when compared with papillary thyroid cancer (PTC) ones. (A) Intracellular levels of MG-H1, measured by a specific ELISA kit, in protein extracts from PTC (n = 5, #6–10) and ATC (n = 5, #1–5) tissues. Results are expressed as mean ± SD. ** p < 0.01; (B) Representative immunohistochemical staining of MG-H1 on PTC (n = 5, #16–20) and ATC (n = 5, #11–15) tissues (200× magnification).
Figure 2
Figure 2
Glyoxalase 1 (Glo1) expression in anaplastic (ATC) and papillary (PTC) thyroid cancer samples. (A) Glo1 mRNA expression, evaluated by real-time PCR, after total RNA extraction from five ATC (#1–5) and five PTC samples (#6–10) and cDNA synthesis; (B) representative Western blot of Glo1 protein expression measured on lysates from five PTC (#6–10) and five ATC (#1–5) tissues. β-actin was used as loading control. The histogram, representing the densitometric analysis of the blots, indicates mean ± SD of all PTC (n = 5, #6–10) and ATC (n = 5, #1–5) samples analyzed; (C) representative immunohistochemical staining of Glo1 on PTC (n = 5, #16–20) and ATC (n = 5, #11–15) tissues (200× magnification); (D) Glo1 enzyme activity was measured in total protein extracts according to a spectrophotometric method, and increases in absorbance resulting from the formation of S-d-lactoylglutathione were monitored at 240 nm (see Materials and Methods). ** p < 0.01, *** p < 0.01.
Figure 3
Figure 3
Evaluation of MG-H1 and Glo1 expression in human thyroid cancer (TC) cell lines. PTC (BCPAP and TPC1) and ATC (8505C and CAL62) cell models grown to confluence under standard conditions were lysed and analyzed by a specific ELISA kit (A), real-time PCR (B), Western blotting (C), and spectrophotometric enzymatic (D) assays, as described in the Materials and Methods section. (A) Intracellular levels of MG-H1, analyzed by a specific ELISA kit. The histogram indicates mean ± SD of three different cultures, and each was tested in triplicate. (B) Glo1 mRNA expression levels, analyzed in triplicate by real-time PCR and normalized to the amount of an internal control transcript (β-actin). Results are expressed as relative mRNA level units and represent the mean ± SD of n ≥ 3 independent, real-time PCR experiments. (C) Representative Western blot (WB) and quantitative histogram of the relative Glo1 protein expression levels. β-actin was used as internal loading control for WB normalization. The WB bands of Glo1 were quantified by a densitometric analysis, and normalized optical density values were expressed as relative protein level arbitrary units. (D) Glo1 enzyme activity was measured in total protein extracts according to a spectrophotometric method, and increases in absorbance resulting from the formation of S-D-lactoylglutathione were monitored at 240 nm (see Materials and Methods). Results represent the mean (± SD) of n ≥ 3 independent experiments performed in triplicate. Intracellular levels of MG-H1 in the presence of (E) 1 µM Glo1 inhibitor bromobenzylglutathione cyclopentyl diester (BBGC) or (F) 50 µM Glo1 activator Resveratrol were analyzed for 48 h with a specific ELISA kit. The histogram indicates mean ± SD of three different cultures, and each was tested in triplicate. * p < 0.05; ** p < 0.01.
Figure 4
Figure 4
Methylglyoxal (MG) sustains the aggressive phenotype of ATC CAL62 cells. Papillary thyroid cancer (BCPAP and TPC1) and anaplastic thyroid cancer (8505C and CAL62) cells grown to confluence under standard conditions were analyzed by specific assays or real-time PCR to evaluate their migration and invasion capabilities (A,C,E,G,H) or the mRNA expression of E-cadherin (E-cad), Vimentin, MMP-1, and TGF-β1 (B,D,F), respectively, as described in the Materials and Methods section. The histograms indicate mean ± SD of three different cultures, and each was tested in triplicate. mRNA expression levels were normalized to the amount of an internal control transcript (β-actin). Invasion/migration capabilities as well as gene expression were measured in TPC1 after 5 µM MG administration and in CAL62 cells after 1 mM aminoguanidine (AG), both for 48 h. Invasion/migration were also evaluated after MG and AG cotreatment (G,H) at the concentrations above reported. The histogram indicates mean ± SD of three different cultures, and each was tested in triplicate. * p < 0.05; ** p < 0.01 compared to untreated cells; ° p < 0.01 compared with MG (G) or AG (H) exposure alone.
Figure 5
Figure 5
Methylglyoxal (MG) sustains the aggressive phenotype of ATC CAL62 cells. Papillary thyroid cancer TPC1 and anaplastic thyroid cancer CAL62 cells grown to confluence under standard conditions were analyzed by specific assays or real-time PCR to evaluate their migration and invasion capabilities (A,C) or the mRNA expression of E-cadherin (E-cad), Vimentin, MMP-1, and TGF-β1 (B,D), respectively, as described in the Materials and Methods section. The histograms indicate mean ± SD of three different cultures, and each was tested in triplicate. mRNA expression levels were normalized to the amount of an internal control transcript (β-actin). Invasion/migration capabilities as well as gene expression were measured in TPC1 after 5 µM MG administration and in CAL62 cells after 1 mM aminoguanidine (AG), both for 48 h. The histogram indicates mean ± SD of three different cultures, and each was tested in triplicate. * p < 0.05; ** p < 0.01; *** p < 0.01.
Figure 6
Figure 6
MG sustains the aggressive phenotype of ATC CAL62 cells by modulating TGF-β1 secretion and FAK signaling. Evaluation of (A) secreted TGF-β1 and phospho-FAK (p-FAK) (B) levels, measured by specific ELISA kits in the culture supernatant or lysate, respectively, of PTC (BCPAP and TPC1) and ATC (8505C and CAL62) cell models; (C) levels of TGF-β1 and p-FAK in ATC CAL62 cells treated (+) with 1 mM aminoguanidine (AG). Untreated (−) cells were used as controls. (D) Intracellular levels of p-FAK in ATC CAL62 cells treated with 1 mM AG and/or treated with 5 ng/mL TGF-β1 for 48 h. The histograms indicate mean ± SD of three different cultures, and each was tested in triplicate. ** p < 0.01, *** p < 0.001.
Figure 7
Figure 7
IL-1β signaling in human TC cell lines. PTC (BCPAP and TPC1) and ATC (8505C and CAL62) cell models grown to confluence under standard conditions were analyzed by specific ELISA kits, following the manufacturer’s instructions, to evaluate (A) the secreted levels of IL-1β (measured in the medium) and (B) levels of IL1 receptor, type I (ILR1) (measured in the cell lysates), phospho-IRAK-1 (p-IRAK1) (a cell-based method), phospho-TAK1 (p-TAK1) (measured in the cell lysates), phospho-IKK (p-IKK) (a cell-based method), and P65 NF-kB (measured in the nuclear extracts). The histograms indicate mean ± SD of three different cultures, and each was tested in triplicate. The inserts represent the original histograms without ATC cells in order to better appreciate changes in PTC cells. ** p < 0.01, *** p < 0.001, and ° p < 0.001.
Figure 8
Figure 8
Glo1 depletion and related downstream events are under the partial control of IL-1β in CAL62 cells. Effects of IL-1β on (A) Glo1 enzyme activity; (B) Glo1 transcript and protein levels; (C) intracellular levels of MG-H1; (D) TGF-β1 and p-FAK levels, measured in the culture supernatant or lysate of CAL62, respectively; (E) migration and invasion capabilities; and (F) IL-1β signaling, evaluated by the levels of IL1 receptor type I (ILR1) (measured in the cell lysates), phospho-TAK1 (p-TAK1) (measured in the cell lysates), and P65 NF-kB (measured in the nuclear extracts). Western blots are representative of three different cultures, each tested in triplicate. β-actin was used as internal loading control for WB normalization. Histograms indicate mean ± SD of three different cultures, each tested in triplicate. * p < 0.05, ** p < 0.01, and *** p < 0.001 compared to untreated cells.
Figure 9
Figure 9
IL-1β partially sustains the aggressive phenotype of CAL62 cells via a novel mechanism mediated by Glo1 inhibition, which drives MG-H1 accumulation and, in turn, activates TGF-β1-mediated FAK signaling. Effects of Glo1 inhibition, under IL-1β administration, on (A) intracellular levels of MG-H1, evaluated by ELISA; (B) TGF-β1 and p-FAK levels, measured in the culture supernatant or lysate of CAL62 cells, respectively, by ELISA; and (C) migration and invasion capabilities, evaluated by specific assays. Histograms indicate mean ± SD of three different cultures each tested in triplicate. * p < 0.05, ** p < 0.01, and *** p < 0.001 compared to untreated cells.
Figure 10
Figure 10
The effect of a specific IL-1 receptor antagonist (IL1RA) administrated to CAL65 anaplastic thyroid cancer cells for 3 h alone (A) or in combination with IL-1β (B,C) on (A) phospho-TAK1 (p-TAK1) (measured in the cell lysates) and P65 NF-kB (measured in the nuclear extracts) by ELISA; (B) Glyoxalase 1 (Glo1)-specific activity, measured by a spectrophotometric assay; and (C) migration and invasion capabilities, evaluated by specific assays. (D) Effect of the long-term exposure (2 weeks) of TPC1 papillary thyroid cancer cells to IL-1β on Glo1 specific activity (s.a.), migration, and invasion. Histograms indicate mean ± SD of three different cultures each tested in triplicate. * p < 0.05, ** p < 0.01, and *** p < 0.001 compared to untreated cells.
Figure 11
Figure 11
Resveratrol affects the CAL62 cell aggressive phenotype by reducing migration and invasion through the inhibition of IL-1β-driven, Glo1/MG-H1-mediated TGF-β1/FAK signaling. Effect of resveratrol on (A) IL-1β levels, evaluated by an ELISA kit in cell culture medium; (B) Glo1-specific activity, measured by spectrophotometry; and (C) migration and invasion capabilities, evaluated by specific assays. Effect of IL-1β, under resveratrol administration, on (D) Glo1 enzyme activity and (E) migration and invasion capabilities. Histograms indicate mean ± SD of three different cultures, and each was tested in triplicate. * p < 0.05, ** p < 0.01, and *** p < 0.001.

References

    1. Antognelli C., Talesa V.N. Glyoxalases in Urological Malignancies. Int. J. Mol. Sci. 2018;19:415. doi: 10.3390/ijms19020415. - DOI - PMC - PubMed
    1. Thornalley P. Protein and nucleotide damage by glyoxal and methylglyoxal in physiological systems-role in ageing and disease. Drug Metab. Drug Interact. 2008;23:125–150. doi: 10.1515/DMDI.2008.23.1-2.125. - DOI - PMC - PubMed
    1. Nass N., Vogel K., Hofmann B., Presek P., Silber R.E., Simm A. Glycation of PDGF results in decreased biological activity. Int. J. Biochem. Cell Biol. 2010;42:749–754. doi: 10.1016/j.biocel.2010.01.012. - DOI - PubMed
    1. Bansode S.B., Chougale A.D., Joshi R.S., Giri A.P., Bodhankar S.L., Harsulkar A.M., Kulkarni M.J. Proteomic analysis of protease resistant proteins in the diabetic rat kidney. Mol. Cell Proteom. 2013;12:228–236. doi: 10.1074/mcp.M112.020651. - DOI - PMC - PubMed
    1. Nowotny K., Jung T., Hohn A., Weber D., Grune T. Advanced glycation end products and oxidative stress in type 2 diabetes mellitus. Biomolecules. 2015;5:194–222. doi: 10.3390/biom5010194. - DOI - PMC - PubMed

Publication types

MeSH terms

Substances

LinkOut - more resources