. 2019 Jun 7;11(1):54.
doi: 10.1186/s13195-019-0508-x.

Upregulation of MIF as a defense mechanism and a biomarker of Alzheimer's disease

Affiliations

Upregulation of MIF as a defense mechanism and a biomarker of Alzheimer's disease

Si Zhang et al. Alzheimers Res Ther. .

Abstract

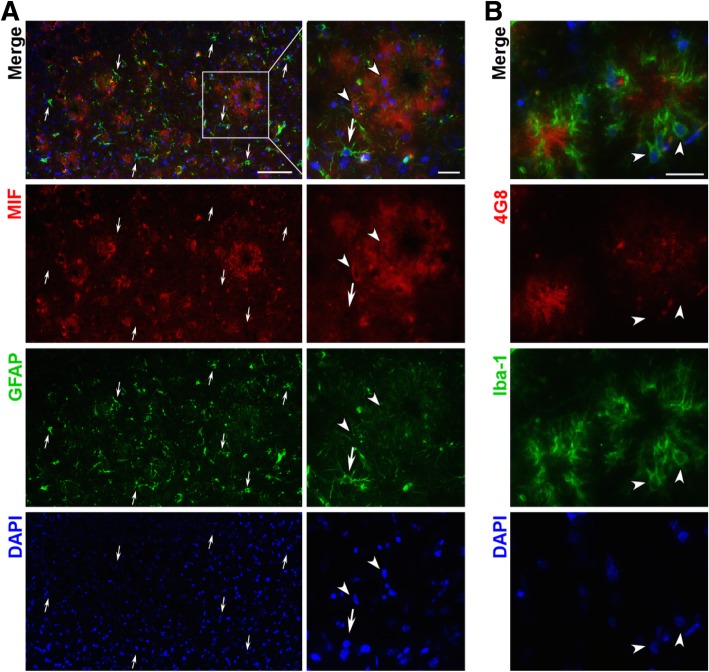
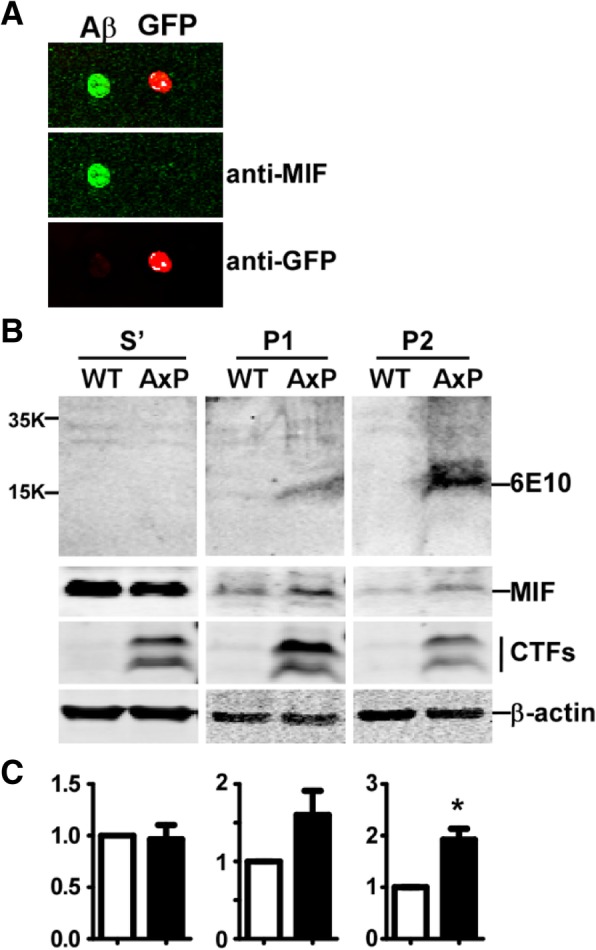
Background: Macrophage migration inhibitory factor (MIF) is a pro-inflammatory cytokine. Chronic inflammation induced by amyloid β proteins (Aβ) is one prominent neuropathological feature in Alzheimer's disease (AD) brain.

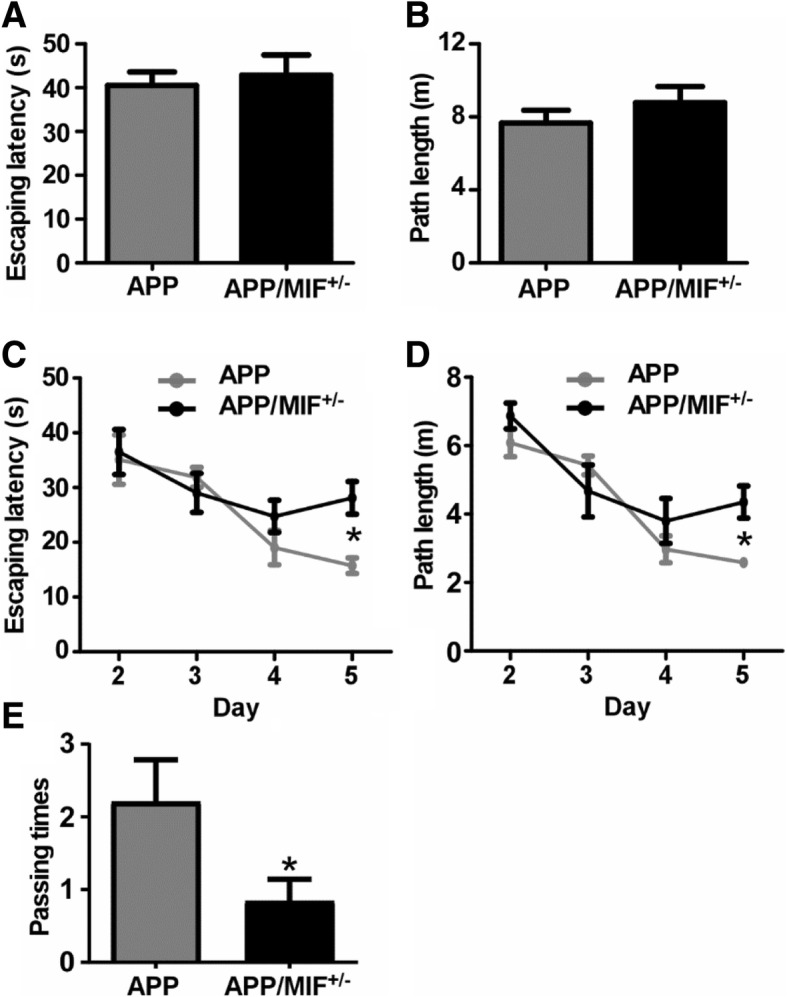
Methods: Elisa, Western blot, and immunohistochemical staining analysis were performed to examine the level of MIF protein in CSF and brain tissues. MTT and LDH assays were used to examine the neurotoxicity, and the Morris Water Maze test was performed to examine the cognitive function in the MIF+/-/APP23 transgenic mice.

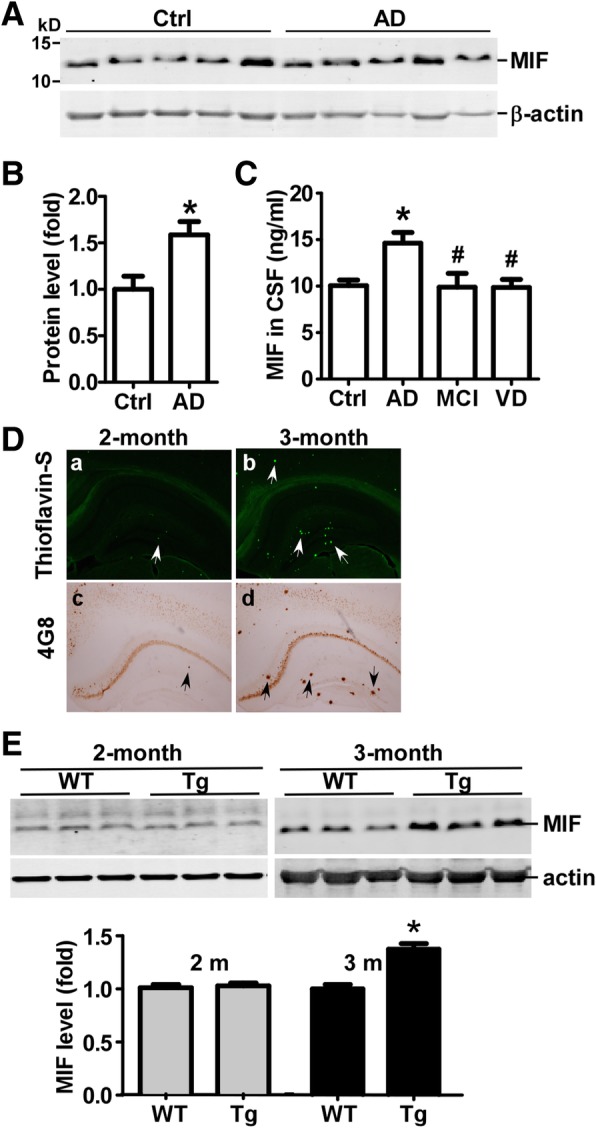
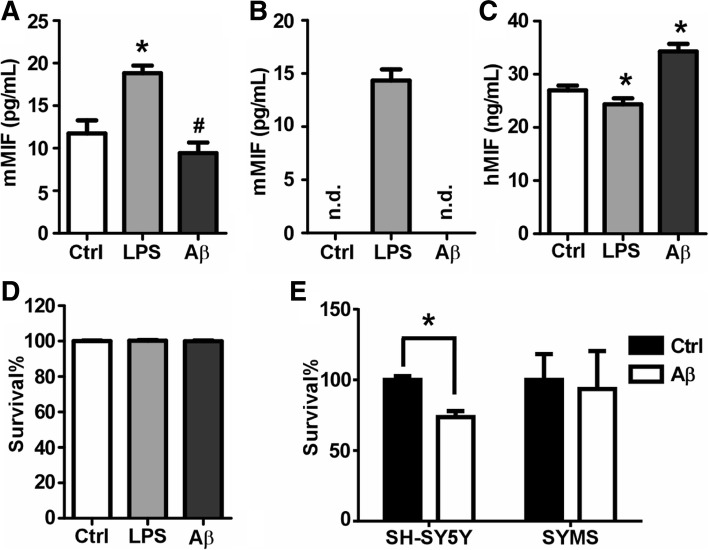
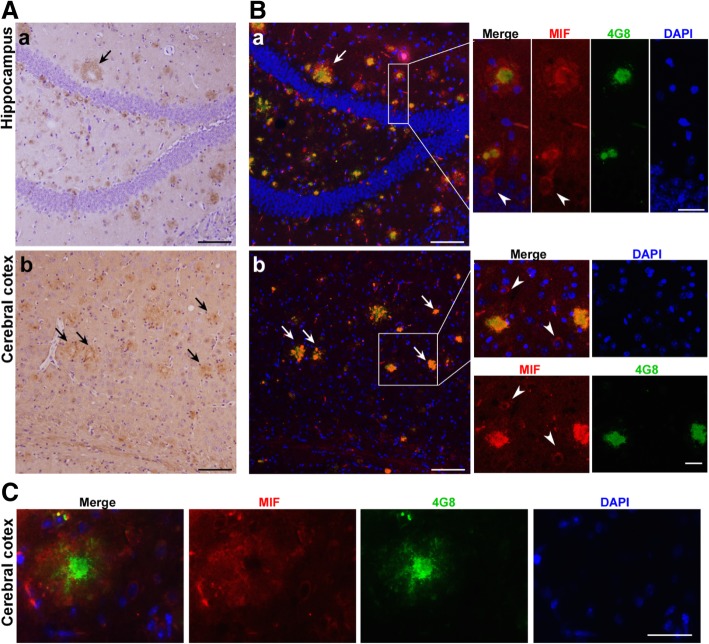
Results: MIF expression was upregulated in the brain of AD patients and AD model mice. Elevated MIF concentration was detected in the cerebrospinal fluid of AD patients but not in that of the patients suffering from mild cognitive impairment and vascular dementia. Reduced MIF expression impaired learning and memory in the AD model mice. MIF expression largely associates with Aβ deposits and microglia. The binding assay revealed a direct association between MIF and Aβ oligomers. Neurons instead of glial cells were responsible for the secretion of MIF upon stimulation by Aβ oligomers. In addition, overexpression of MIF significantly protected neuronal cells from Aβ-induced cytotoxicity.

Conclusion: Our study suggests that neuronal secretion of MIF may serve as a defense mechanism to compensate for declined cognitive function in AD, and increased MIF level could be a potential AD biomarker.

Keywords: Alzheimer’s disease; Amyloid; Cognitive impairment; MIF; Microglia; Neuronal toxicity.


Conflict of interest statement

The authors declare that they have no competing interests.

Figures

Fig. 1
Fig. 1
Upregulation of MIF in AD patients and AD model mice. a Human brain tissues obtained from Columbia University were lysed in RIPA-DOC buffer, and an equal amount of protein was resolved on a 12% tris-tricine gel. MIF was detected by anti-MIF antibody, and β-actin was detected by the β-actin antibody. b Quantification of (A). Values were expressed as mean ± SEM, n = 5. *p < 0.05 by Student’s t test. c Concentrations of MIF in CSF collected from patients with MCI, AD, and VD, and control subjects were measured by ELISA. Values were expressed as mean ± SEM, n = 30 for control, 28 for AD, 10 for MCI, and 17 for VD. *p < 0.05 by one-way ANOVA with Newman-Keuls post hoc tests compared to control. #p < 0.05 by one-way ANOVA with Newman-Keuls post hoc tests compared to AD. d APP23/PS45 double transgenic mice and the wildtype controls were euthanized at the ages of 2 and 3 months. Half of the brain was fixed and sectioned for plaque assessment, and the other half was used for MIF expression evaluation. Thioflavin S (a, b) and 4G8 (c, d) were used to stained representative brain sections for plaque detection. Arrows point to neuritic plaques. e Brain tissues were lysed in RIPA-DOC buffer, and an equal amount of protein was resolved on a 12% tris-tricine gel. MIF was detected by anti-MIF antibody, and β-actin was detected by β-actin antibody serving as the loading control. The ratio of MIF to β-actin was normalized to wildtype mice. Values were expressed as mean ± SEM, n = 4~8 for wildtype mice and 4~10 for APP23/PS45 mice. p > 0.05 by Student’s t tests. (I) *p < 0.05 by Student’s t tests
Fig. 2
Fig. 2
Increased MIF secretion protects neuronal cells from Aβ-induced neurotoxicity. Cells were seeded on seeded onto 96-well plates and cultured 24 h prior to treatment. Aβ treatment was achieved by adding medium diluted Aβ1-42 oligomer stock solution (100 μM in sterile PBS) at the final concentration of 10 μM or 50 μM. LPS at the concentration of 100 ng/mL was used as a positive control for MIF secretion. Sixteen hours after treatment, the culture medium was collected and centrifuged prior to analysis. Media collected from RAW 264.7 (a), BV-2 (b), and SHSY-5Y (c) cell lines were measured for MIF concentrations by ELISA. Values represent mean ± SEM, n = 4. *p < 0.05 relative to controls by one-way ANOVA with Newman-Keuls post hoc tests. #p < 0.05 relative to LPS by one-way ANOVA with Newman-Keuls post hoc tests. d The same batch of media from SHSY-5Y cells were subjected to LDH assay to evaluate the cell membrane integrity. Values represent mean ± SEM, n = 4. *p < 0.05 relative to controls by one-way ANOVA with Newman-Keuls post hoc tests. e SH-SY5Y and SYMS cell lines were subjected to Aβ oligomer treatment at the final concentration of 50 μM. After 24-h treatment, cell viability was assessed by MTS assays. Values represent mean ± SEM, n = 3. *p < 0.05 relative to controls by two-way ANOVA with Bonferroni’s multiple comparison test
Fig. 3
Fig. 3
MIF deficiency affects cognitive functions in the AD model mice. APP23/MIF+/− and APP23 mice (APP/MIF+/− and APP, respectively) at the age of 12 to 13 months were subjected to the Morris water maze test. a During the first day of visible platform tests, the APP23/MIF+/− and APP23 mice exhibited a similar latency to escape onto the visible platform. P > 0.05 by Student’s t test. b APP23/MIF+/− and APP23 mice had similar swimming distances before escaping onto the visible platform. P > 0.05 by Student’s t test. c In hidden platform tests, APP23/MIF+/− mice showed a longer latency to escape on to the hidden platform on the 5th day. *p < 0.05 by two-way ANOVA with Bonferroni post hoc tests. d APP23/MIF+/− mice had a shorter swimming length before escaping onto the hidden platform on the 5th day. *P < 0.05 by two-way ANOVA with Bonferroni post hoc tests. e On the last day of the trial, APP23/MIF+/− showed a significantly lower number of passing times through the location of the platform than APP23 mice. P < 0.05 by Student’s t test
Fig. 4
Fig. 4
Colocalization of MIF and amyloid plaques in APP/PS mice. A, B Fixed brains were prepared for paraffin-embedded sectioning at 5 μm thickness. MIF was detected by anti-MIF antibody and visualized by ABC and DBA methods. Nuclei were stained by hematoxylin. The sections were observed under traditional microscopy. Arrows point to plaques associated MIF expression, which resembles the expression pattern of Aβ plaques. Scale bar, 100 μm. C Fixed brains were dehydrated in 30% sucrose solution and embedded in O.C.T. for cryosectioning at 30 μm thickness. MIF was detected by polyclonal MIF antibody, and Alexa 488-labeled secondary antibody, and Aβ plaques were detected by monoclonal 4G8 antibody and Alexa 594-labeled secondary antibody. Nuclei were stained with DAPI, and brain sections were observed under fluorescent microscopy. Arrowspoint to colocalization of MIF and plaques. Arrow heads point to MIF expression cells. Scale bar, 100 μm in B, and 25 μm in inserts and C
Fig. 5
Fig. 5
MIF expression overlaps but is not restricted in the vicinity microglia and astrocytes. Fixed brains were dehydrated in 30% sucrose solution and embedded in O.C.T. for cryosectioning at 20 μm thickness. a MIF was detected by polyclonal MIF antibody and Alexa 488-labeled secondary antibody, and active astrocytes were detected by monoclonal GFAP antibody and Alexa 594-labeled secondary antibody. Nuclei were stained with DAPI, and brain sections were observed under fluorescent microscopy. Arrows point to GFAP-positive cells. Arrowheads point to possible MIF expressing cells. Scale bar, 200 μm and 50 μm in inserts. b Neuritic plaques were detected by monoclonal 4G8 antibody and Alexa 488-labeled secondary antibody, and microglia were detected by polyclonal Iba-1 antibody and Alexa 594-labeled secondary antibody. Nuclei were stained with DAPI, and brain sections were observed under fluorescent microscopy. Arrowheads point to possible MIF expressing cells. Scale bar, 50 μm
Fig. 6
Fig. 6
MIF interacts with Aβ oligomers. a 0.2 nmol of Aβ oligomers and 0.1 nmol of purified GFP protein were spot on a nitrocellulose membrane, and the membrane was incubation with mixed proteins of recombinant hMIF and purified GFP at the concentration of approximated 5 μM at 4 °C for overnight. The membrane was then subjected to immunoblotting to detect MIF and GFP by a monoclonal anti-MIF antibody and a polyclonal anti-GFP antibody, respectively. The red channel detects IR-dye-labeled goat anti-rabbit antibody, and the green channel detects IR-dye-labeled goat anti-mouse antibody. b Brains from 4-month-old APP23/PS45 and wildtype (as controls) mice were homogenized in 5x PBS with 0.5% Triton-100 (v/w) and centrifuge at 16,000×g at 4 °C for 15 min. The supernatants were collected and subjected to ultracentrifugation at 100,000×g for 1 h at 4 °C, and the second supernatants were collected and labeled as S′. Homogenates from each layer were further dissolved in RIPA-DOC buffer followed by brief sonication. The same amount of protein was loaded on 16% and 12% Tris-tricine SDS PAGE gels for Aβ and MIF separation, respectively. Aβ was detected by a 6E10 antibody, MIF was detected by anti-MIF antibody, CTFs were detected by a C20 antibody to confirm the expression of the transgene, and β-actin was detected by β-actin antibody serving as the loading control. S′, supernatant after ultracentrifugation; P1, pellet 1; P2 pellet 2. c Quantification of the level of MIF protein from b. Values represent mean ± SEM, n = 3. *P < 0.05 by Student’s t test

References

    1. Zhang S, Wang Z, Cai F, Zhang M, Wu Y, Zhang J, Song W. BACE1 cleavage site selection critical for amyloidogenesis and Alzheimer’s pathogenesis. J Neurosci. 2017;37(29):6915–6925. doi: 10.1523/JNEUROSCI.0340-17.2017. - DOI - PMC - PubMed
    1. Zhang Y, Song W. Islet amyloid polypeptide: another key molecule in Alzheimer's pathogenesis? Prog Neurobiol. 2017;153:100–120. doi: 10.1016/j.pneurobio.2017.03.001. - DOI - PubMed
    1. Wyss-Coray T, Rogers J. Inflammation in Alzheimer disease-a brief review of the basic science and clinical literature. Cold Spring Harb Perspect Med. 2012;2(1):a006346. doi: 10.1101/cshperspect.a006346. - DOI - PMC - PubMed
    1. Colton CA. Heterogeneity of microglial activation in the innate immune response in the brain. J Neuroimmune Pharmacol. 2009;4(4):399–418. doi: 10.1007/s11481-009-9164-4. - DOI - PMC - PubMed
    1. Koga K, Kenessey A, Powell SR, Sison CP, Miller EJ, Ojamaa K. Macrophage migration inhibitory factor provides cardioprotection during ischemia/reperfusion by reducing oxidative stress. Antioxid Redox Signal. 2011;14(7):1191–1202. doi: 10.1089/ars.2010.3163. - DOI - PubMed

Publication types

MeSH terms

Substances

Grants and funding