

Temperature impacts on dengue emergence in the United States: Investigating the role of seasonality and climate change
- PMID: 31175008
- PMCID: PMC6791375
- DOI: 10.1016/j.epidem.2019.05.003
Temperature impacts on dengue emergence in the United States: Investigating the role of seasonality and climate change
Abstract
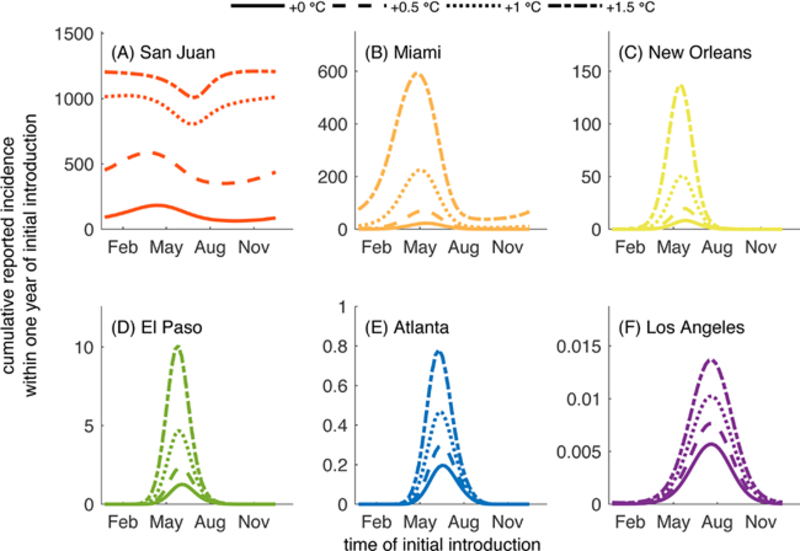
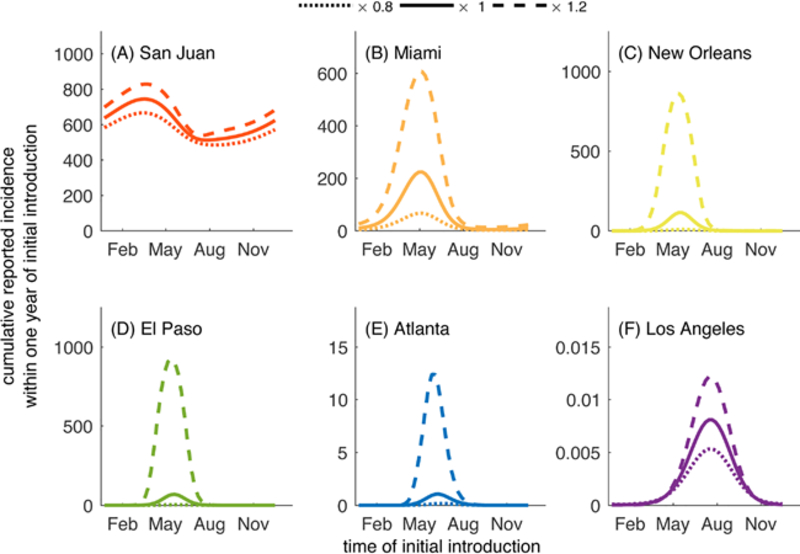
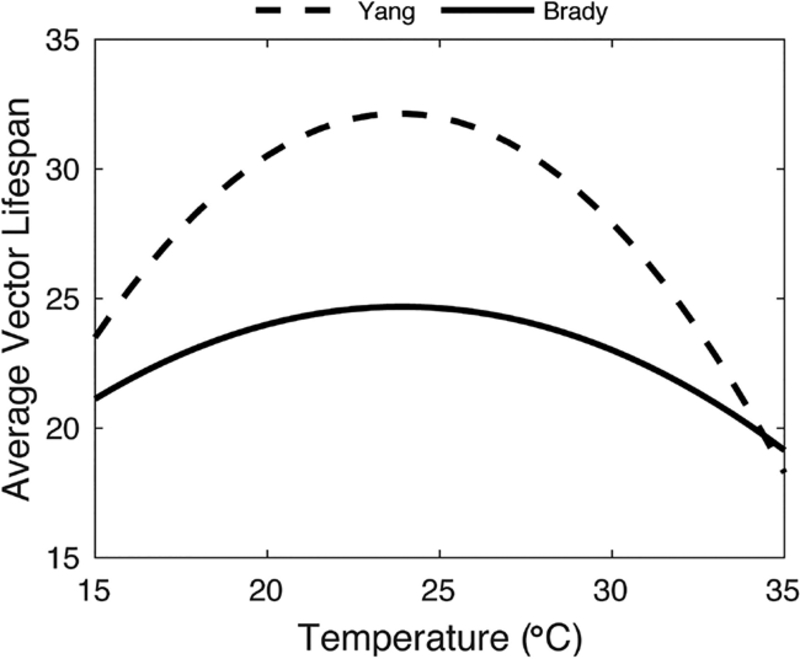
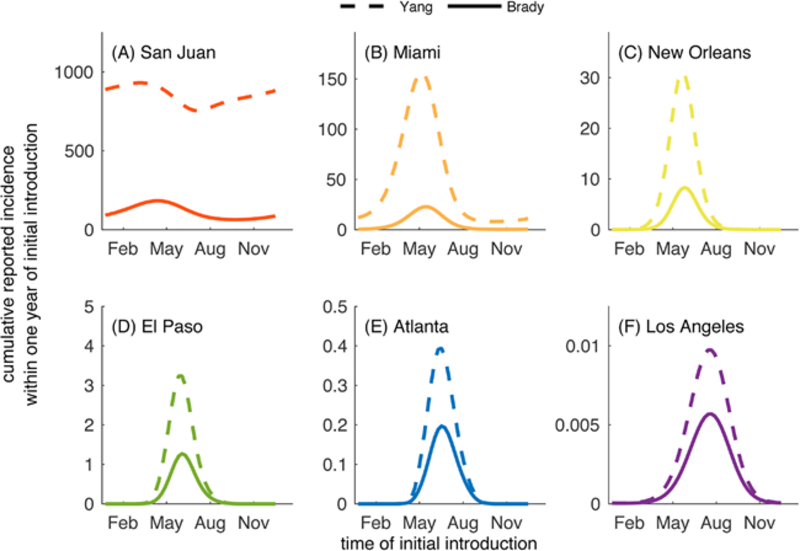
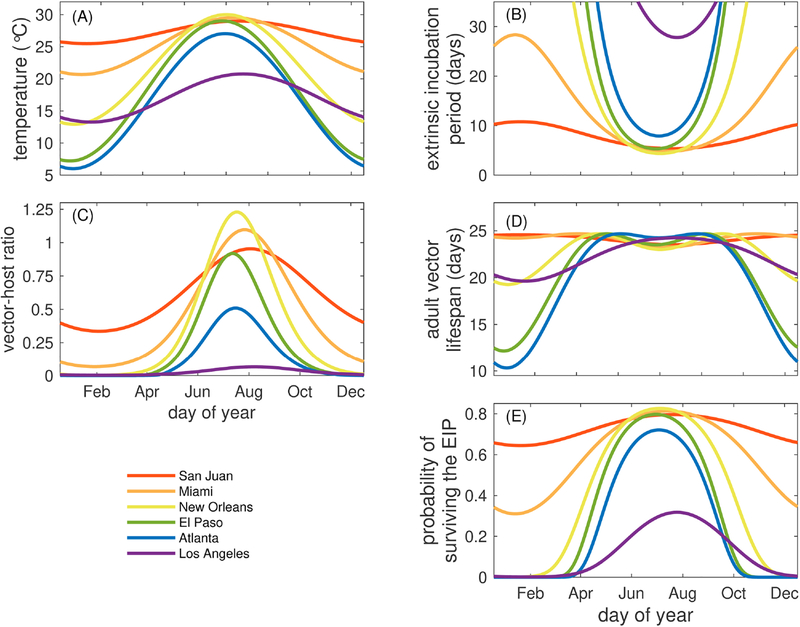
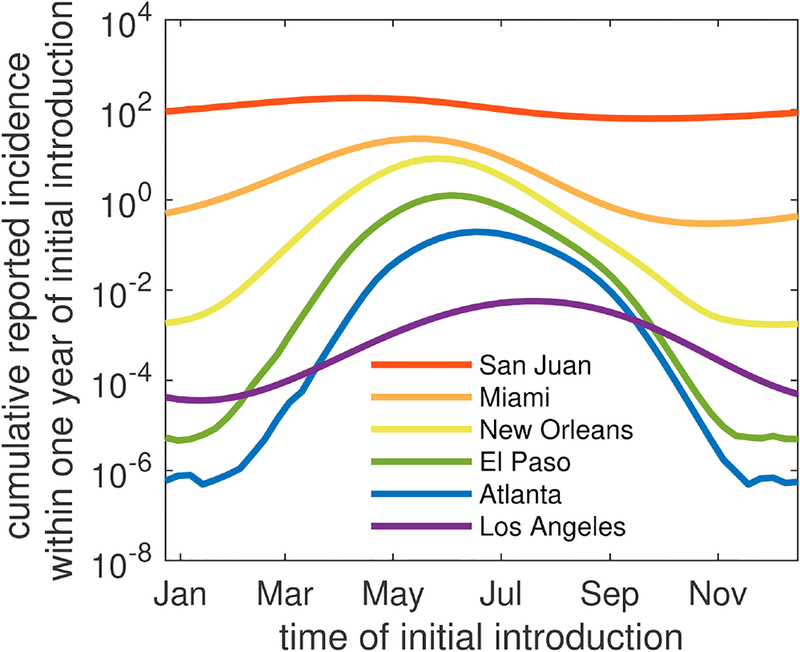
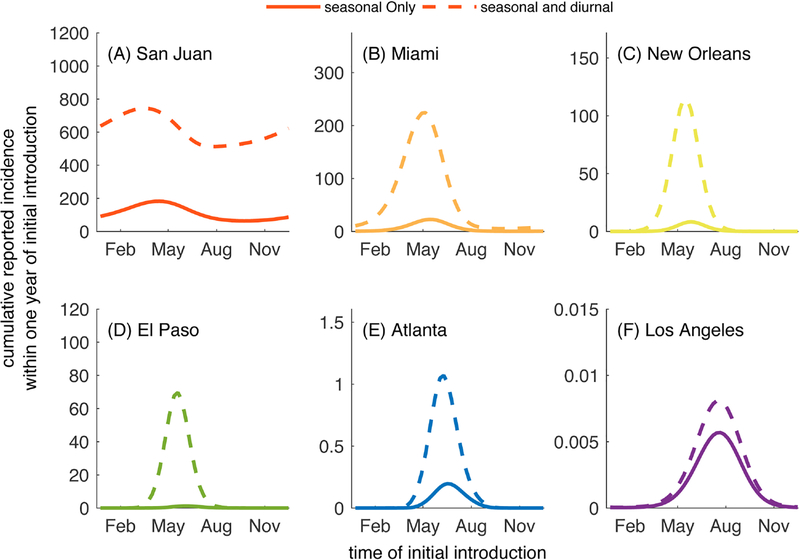
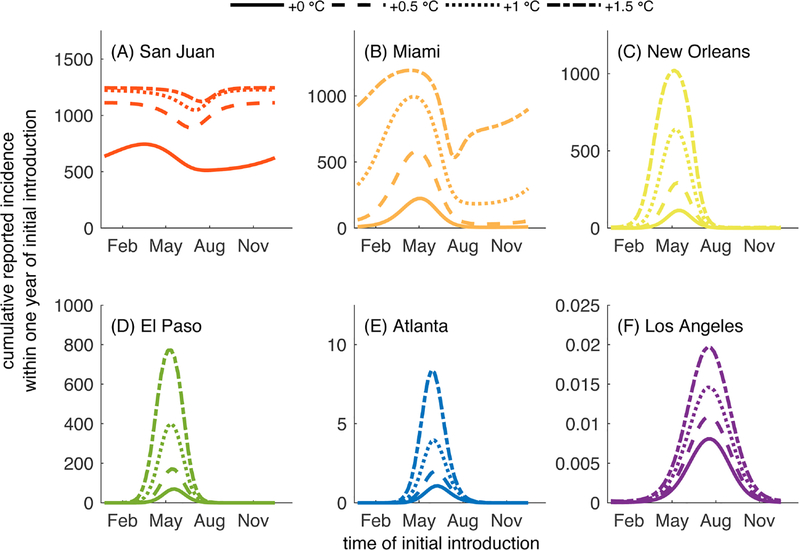
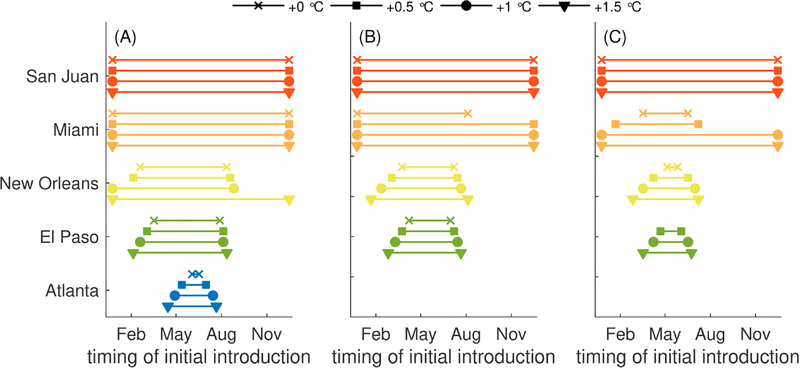
Tropical mosquito-borne viruses have been expanding into more temperate regions in recent decades. This is partly due to the coupled effects of temperature on mosquito life history traits and viral infection dynamics and warming surface temperatures, resulting in more suitable conditions for vectors and virus transmission. In this study, we use a deterministic ordinary differential equations model to investigate how seasonal and diurnal temperature fluctuations affect the potential for dengue transmission in six U.S. cities. We specifically consider temperature-dependent mosquito larval development, adult mosquito mortality, and the extrinsic incubation period of the virus. We show that the ability of introductions to lead to outbreaks depends upon the relationship between a city's temperature profile and the time of year at which the initial case is introduced. We also investigate how the potential for outbreaks changes with predicted future increases in mean temperatures due to climate change. We find that climate change will likely lead to increases in suitability for dengue transmission and will increase the periods of the year in which introductions may lead to outbreaks, particularly in cities that typically have mild winters and warm summers, such as New Orleans, Louisiana, and El Paso, Texas. We discuss our results in the context of temperature heterogeneity within and across cities and how these differences may impact the potential for dengue emergence given present day and predicted future temperatures.
Keywords: Aedes aegypti; Arbovirus; Climate change; Dengue; Emergence; Puerto Rico; Temperature; United States.
Copyright © 2019 The Authors. Published by Elsevier B.V. All rights reserved.
Figures
Similar articles
-
Aedes (Stegomyia) aegypti in the continental United States: a vector at the cool margin of its geographic range.J Med Entomol. 2013 May;50(3):467-78. doi: 10.1603/me12245. J Med Entomol. 2013. PMID: 23802440
-
Seasonal temperature variation influences climate suitability for dengue, chikungunya, and Zika transmission.PLoS Negl Trop Dis. 2018 May 10;12(5):e0006451. doi: 10.1371/journal.pntd.0006451. eCollection 2018 May. PLoS Negl Trop Dis. 2018. PMID: 29746468 Free PMC article.
-
Bionomic response of Aedes aegypti to two future climate change scenarios in far north Queensland, Australia: implications for dengue outbreaks.Parasit Vectors. 2014 Sep 19;7:447. doi: 10.1186/1756-3305-7-447. Parasit Vectors. 2014. PMID: 25240382 Free PMC article.
-
The burden of dengue and chikungunya worldwide: implications for the southern United States and California.Ann Glob Health. 2014 Nov-Dec;80(6):466-75. doi: 10.1016/j.aogh.2015.02.006. Ann Glob Health. 2014. PMID: 25960096 Free PMC article. Review.
-
[The effects of climate change on the emergence of dengue].Med Sci (Paris). 2025 Feb;41(2):137-144. doi: 10.1051/medsci/2025009. Epub 2025 Mar 3. Med Sci (Paris). 2025. PMID: 40028951 Review. French.
Cited by
-
Beyond the Unknown: A Broad Framing for Preparedness for Emerging Infectious Threats.Am J Trop Med Hyg. 2022 Oct 3;107(6):1159-1161. doi: 10.4269/ajtmh.22-0341. Print 2022 Dec 14. Am J Trop Med Hyg. 2022. PMID: 36191876 Free PMC article.
-
Climate change and viral emergence: evidence from Aedes-borne arboviruses.Curr Opin Virol. 2020 Feb;40:41-47. doi: 10.1016/j.coviro.2020.05.001. Epub 2020 Jun 20. Curr Opin Virol. 2020. PMID: 32569752 Free PMC article. Review.
-
Longitudinal surveillance of Aedes aegypti (Diptera: Culicidae) in urban coastal Kenya: population dynamics, blood feeding frequency and dengue virus infection rates.Sci Rep. 2025 Jul 1;15(1):21787. doi: 10.1038/s41598-025-05408-z. Sci Rep. 2025. PMID: 40595990 Free PMC article.
-
Effects of Guangzhou seasonal climate change on the development of Aedes albopictus and its susceptibility to DENV-2.PLoS One. 2022 Apr 1;17(4):e0266128. doi: 10.1371/journal.pone.0266128. eCollection 2022. PLoS One. 2022. PMID: 35363810 Free PMC article.
-
The impact of climate change on neglected tropical diseases: a systematic review.Trans R Soc Trop Med Hyg. 2021 Jan 28;115(2):147-168. doi: 10.1093/trstmh/traa192. Trans R Soc Trop Med Hyg. 2021. PMID: 33508094 Free PMC article.
References
-
- Alto BW, Wiggins K, Eastmond B, Ortiz S, Zirbel K, Lounibos LP, 2018. Diurnal temperature range and chikungunya virus infection in invasive mosquito species. J. Med. Entomol 55, 217–224. - PubMed
-
- Beserra EB, Fernandes CRM, Silva S.A.d.O., da Silva LA, dos Santos JW, 2009. Efeitos da temperatura no ciclo de vida, exigências térmicas e estimativas do número de geraç oes anuais de Aedes aegypti (Diptera, Culicidae). Iheringia. Série Zoologia 99, 142–148.
Publication types
MeSH terms
Grants and funding
LinkOut - more resources
Full Text Sources
Medical
