. 2019 Sep 1;25(17):5376-5387.
doi: 10.1158/1078-0432.CCR-18-3590. Epub 2019 Jun 7.

Patient-Derived Cancer Organoid Cultures to Predict Sensitivity to Chemotherapy and Radiation

Affiliations

Patient-Derived Cancer Organoid Cultures to Predict Sensitivity to Chemotherapy and Radiation

Cheri A Pasch et al. Clin Cancer Res. .

Abstract

Purpose: Cancer treatment is limited by inaccurate predictors of patient-specific therapeutic response. Therefore, some patients are exposed to unnecessary side effects and delays in starting effective therapy. A clinical tool that predicts treatment sensitivity for individual patients is needed.

Experimental design: Patient-derived cancer organoids were derived across multiple histologies. The histologic characteristics, mutation profile, clonal structure, and response to chemotherapy and radiation were assessed using bright-field and optical metabolic imaging on spheroid and single-cell levels, respectively.

Results: We demonstrate that patient-derived cancer organoids represent the cancers from which they were derived, including key histologic and molecular features. These cultures were generated from numerous cancers, various biopsy sample types, and in different clinical settings. Next-generation sequencing reveals the presence of subclonal populations within the organoid cultures. These cultures allow for the detection of clonal heterogeneity with a greater sensitivity than bulk tumor sequencing. Optical metabolic imaging of these organoids provides cell-level quantification of treatment response and tumor heterogeneity allowing for resolution of therapeutic differences between patient samples. Using this technology, we prospectively predict treatment response for a patient with metastatic colorectal cancer.

Conclusions: These studies add to the literature demonstrating feasibility to grow clinical patient-derived organotypic cultures for treatment effectiveness testing. Together, these culture methods and response assessment techniques hold great promise to predict treatment sensitivity for patients with cancer undergoing chemotherapy and/or radiation.


Conflict of interest statement

Conflicts of interest:

The authors declare no potential conflicts of interest.

Figures

Figure 1.
Figure 1.
Patient-derived cancer organoids (PDCOs) were generated across multiple cancer types and phenotypically represent the tumors from which they were derived. (A) H&E stained tumor sections and whole mounts of PDCOs generated from the tissue that was adjacent to that shown in the tumor section (DC, colorectal cancer; DP, pancreatic adenocarcinoma). These PDCOs demonstrate similar secondary architecture, nuclear pleomorphism, nuclear-to-cytoplasmic ratio, presence of prominent nucleoli and mitotic rate. (B) Bright field images of PDCOs generated from multiple histologic types of cancer. (C) Colorectal cancer PDCOs develop crypt-like structures reminiscent of malignant glands within the tumor. (D) PDCOs generated from mucinous adenocarcinomas also produce mucin. Tumor H&Es are all at the same magnification; size bars, 100 μm. Spheroids in culture are all at the same magnification; size bars, 500 μm. Spheroid H&E size bars, 200 μm. Outlined areas are enlarged in panels to the right.
Figure 2.
Figure 2.
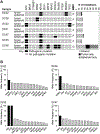
Cancer hotspot next-generation sequencing was performed comparing each patient’s bulk tumor sample and the associated PDCOs (DC, colorectal cancer; DP, pancreatic adenocarcinoma). (A) The non-synonymous mutations were similar between the tumor and PDCOs for the microsatellite stable cancers (MMR, mismatch repair; P, proficient; D, deficient). DC46 is a MMR-deficient tumor, and in this case, an increased number of non-synonymous mutations were identified as unique to the PDCOs or the adjacent tumor sample. In addition, alterations in known driver genes were identical between the PDCOs and the adjacent cancer except for DC47 in which a subcloncal PIK3CA E545K mutation was found unique to the PDCOs and the MMR-deficient DC46 cancer which had additional alterations in APC (*) and KRAS (**) that were not found in the bulk tumor sample. (B) To examine the prevalence of subclonal populations with the PDCOs, first the allele frequency of known alterations was examined. The allele frequencies were ~50% for the founder driver oncogenes and 100% for founding tumor suppressor genes across the samples queried (black bars). For each sample, those alterations with an allele frequency of 10–35% were identified (gray bars); these indicate the presence of subclonal populations within the PDCOs. Spheroid passage (p) numbers at the time of sequencing are: DC02 p6, DC26 p2, DC32 p4, DP41 p1,DC46 p1, DC55 p1, and DC46 p6.
Figure 3.
Figure 3.
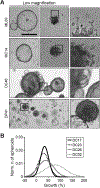
Phenotypic heterogeneity exists within PDCOs (ML, lung adenocarcinoma; DC and MC, colorectal adenocarcinoma; DP, pancreatic adenocarcinoma). (A) Across multiple cancers of different histology, both type 1 (spheres with lumen) and type 2 (spheres without a lumen) are observed within the same cultures. Size bar for all low magnification photos, 500 μm. Outlined areas are enlarged 4x in panels to the right. (B) Population distribution modeling of growth of PDCOs over 48 hours.
Figure 4.
Figure 4.
Differential treatment response to chemotherapy and radiation treatment can be resolved using PDCOs. (A–E) A total of five colorectal cancer PDCO lines were treated with increasing doses of 5FU and/or radiation (0, 2 or 5 Gy) and then observed over four days. Brightfield images are for those PDCOs treated with control or 10 μM 5FU and 2 Gy radiation at baseline and four days post treatment. Median spheroid growth (%) was measured for the different treatment conditions for each line. Growth is defined as change in spheroid diameter. Population distribution modeling was also performed to identify populations with different degrees of response to the treatments. Size bars, 250 μm. (F) Effect sizes, using Glass’s delta, were calculated for each treatment group across patient sample. Spheroid passage (p) numbers at the time of the treatment studies are: DC17 p2–3, DC23 p3–4, DC26 p1, DC02 p15–18, and MC15 11–12. Each treatment for each line was tested with 16–76 spheroids (median = 39).
Figure 5.
Figure 5.
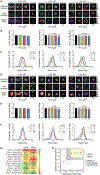
(A–C) DC02. (D–F) MC15. OMI of PDCOs four days post 5FU and radiation. (A and D) Images display the change in NAD(P)H and FAD intensity and the optical redox ratio across treatment groups. Size bars, 100 μm. (B and E) Normalized redox ratios are compared across treatment groups. (C and F) Single cell OMI analysis demonstrates the change in cell level populations in response to 5FU and radiation (cell number range 163–562). Asterisks represent effect size calculated from Glass’s delta. (G) heat map comparing the optical redox ratio effect sizes across treatment groups between DC02 and MC15. H, plot of the effect size (Glass’s delta) comparing the spheroid size and optical redox ratio analyses and using the combined measures to define treatment effectiveness. Each dot represents one treatment condition. *Glass’s delta ≥ 0.6, **Glass’s delta ≥ 0.7, ***Glass’s delta ≥ 0.8, ****Glass’s delta ≥ 0.9. Spheroid passage (p) numbers at the time of the treatment studies are: DC02 p15–18 and MC15 11–12. Each treatment for each line was tested with 163–562 cells (median = 295).
Figure 6.
Figure 6.
PDCOs from a patient with treatment-refractory metastatic CRC possessing alterations in APC and TP53 were generated from a core needle biopsy of a liver metastasis. The subject had previously received 5FU and oxaliplatin chemotherapy in the neoadjuvant setting ~4 years prior. Subsequently, the cancer had become resistant to a 5FU containing regimen. Clinically, there was the question of whether this patient could benefit from re-treatment with 5FU and oxaliplatin. (A) PDCOs from this patient were treated for 48 hours with control, 5FU (10μM), oxaliplatin (40μM), or the combination. A significant reduction in the median growth of the spheres was noted with the combination, however, lack of response was observed with the 5FU treatment alone. *** p < 0.001 (Wilcoxon rank sum test). Growth is defined as change in spheroid diameter. Each treatment was tested with 64–98 spheroids. (B) Population modeling based on spheroid size demonstrated a uniform lack of response to 5FU and response to the combination of 5FU and oxaliplatin. (C and D) OMI confirms the lack of effectiveness of 5FU for these PDCOs and response to the combination of 5FU and oxaliplatin on a single cell level. Each treatment was tested with 255–425 cells. Size bar, 75 μm. (E) Plot of effect sizes comparing the spheroid size and optical redox ratio analyses. (F) Trend of the carcinoembryonic antigen (CEA) tumor marker in the response of this patient to 5FU and oxaliplatin therapy. (G) Computed tomography imaging of the subjects liver metastasis before and 2 months after treatment with 5FU and oxaliplatin. These studies were done on spheroids across passages 2–5.

Comment in

References

    1. Sholl LM, Aisner DL, Varella-Garcia M, Berry LD, Dias-Santagata D, Wistuba II, et al. Multi-institutional Oncogenic Driver Mutation Analysis in Lung Adenocarcinoma: The Lung Cancer Mutation Consortium Experience. J Thorac Oncol 2015;10:768–77. - PMC - PubMed
    1. Solomon BJ, Mok T, Kim DW, Wu YL, Nakagawa K, Mekhail T, et al. First-line crizotinib versus chemotherapy in ALK-positive lung cancer. N Engl J Med 2014;371:2167–77. - PubMed
    1. Le DT, Uram JN, Wang H, Bartlett BR, Kemberling H, Eyring AD, et al. PD-1 Blockade in Tumors with Mismatch-Repair Deficiency. N Engl J Med 2015;372:2509–20. - PMC - PubMed
    1. Drilon A, Laetsch TW, Kummar S, DuBois SG, Lassen UN, Demetri GD, et al. Efficacy of Larotrectinib in TRK Fusion-Positive Cancers in Adults and Children. N Engl J Med 2018;378:731–9. - PMC - PubMed
    1. Fountzilas E, Tsimberidou AM. Overview of Precision Oncology Trials: Challenges and Opportunities. Expert Rev Clin Pharmacol 2018. - PMC - PubMed

Publication types

MeSH terms