. 2019 Jun 24;6(3):ENEURO.0357-18.2019.
doi: 10.1523/ENEURO.0357-18.2019. Print 2019 May/Jun.

Contribution of FEF to Attentional Periodicity during Visual Search: A TMS Study

Affiliations

Contribution of FEF to Attentional Periodicity during Visual Search: A TMS Study

Laura Dugué et al. eNeuro. .

Abstract

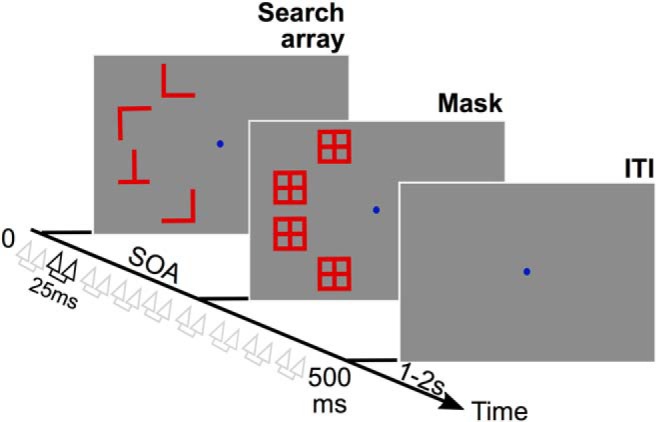
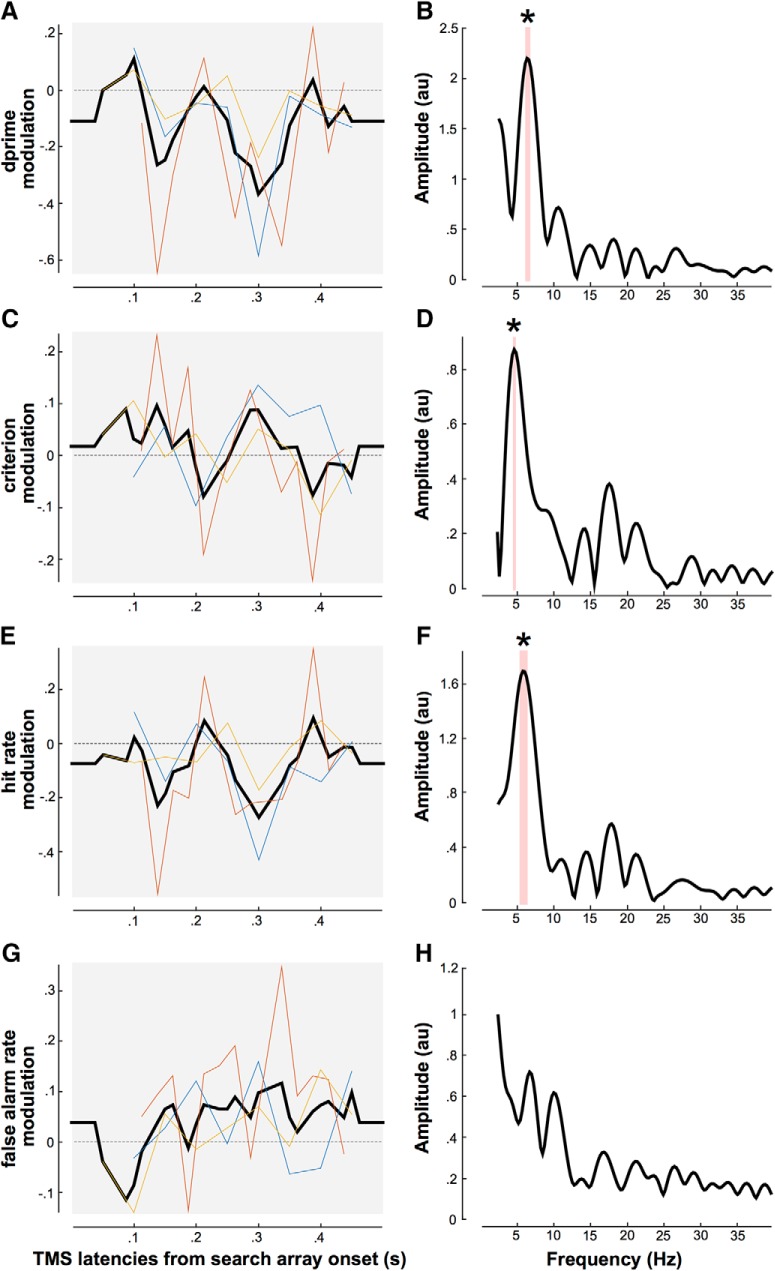
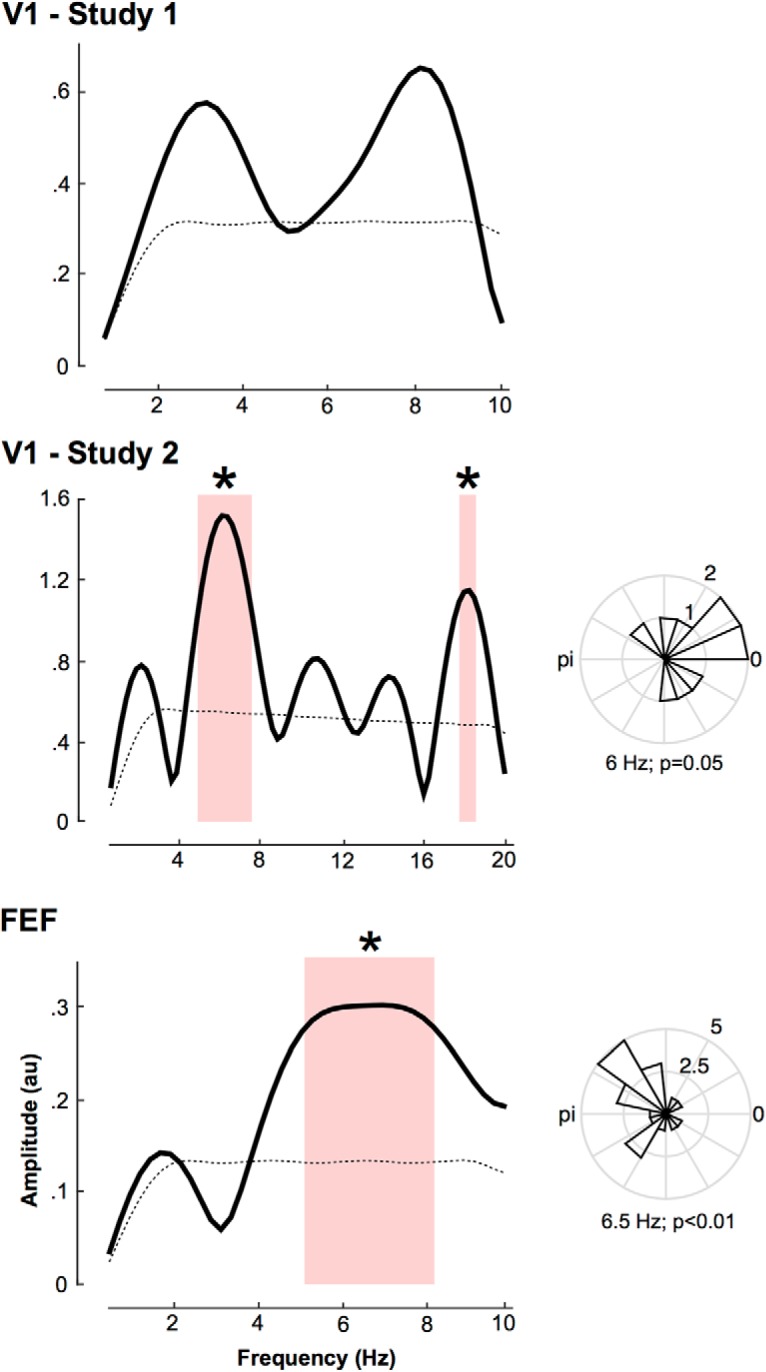
Visual search, looking for a target embedded among distractors, has long been used to study attention. Current theories postulate a two-stage process in which early visual areas perform feature extraction, whereas higher-order regions perform attentional selection. Such a model implies iterative communication between low- and high-level regions to sequentially select candidate targets in the array, focus attention on these elements, and eventually permit target recognition. This leads to two independent predictions: (1) high-level, attentional regions and (2) early visual regions should both be involved periodically during the search. Here, we used transcranial magnetic stimulation (TMS) applied over the frontal eye field (FEF) in humans, known to be involved in attentional selection, at various delays while observers performed a difficult, attentional search task. We observed a periodic pattern of interference at ∼6 Hz (theta) suggesting that the FEF is periodically involved during this difficult search task. We further compared this result with two previous studies (Dugué et al., 2011, 2015a) in which a similar TMS procedure was applied over the early visual cortex (V1) while observers performed the same task. This analysis revealed the same pattern of interference, i.e., V1 is periodically involved during this difficult search task, at the theta frequency. Past V1 evidence reappraised for this paper, together with our current FEF results, confirm both of our independent predictions, and suggest that difficult search is supported by low- and high-level regions, each involved periodically at the theta frequency.

Keywords: FEF; TMS; V1; periodicity; theta; visual search.


Figures

Figure 1.
Figure 1.
Experimental protocol. While participants performed a visual search (finding a T letter among L’s), they were stimulated over the right-FEF or the Vertex (control) with a double-pulse of TMS (25 ms interval) applied at random delays between 50 and 450 ms (50 ms increments) after the search array onset.
Figure 2.
Figure 2.
TMS modulates attentional search periodically. A, D′ modulations (test–control condition) are represented as a function of TMS latencies from the search array onset. The color lines represent each individual study [yellow, current FEF study; blue, first V1 study (Dugué et al., 2011); red, second V1 study (Dugué et al., 2015a)]. The black line is the average across all three studies. B, Amplitude spectrum obtained by FFT decomposition of the averaged data across the three studies. The red shaded area represents the significant spectral components and the *peak at 6.3 Hz (p < 0.05). C, E, G, represent criterion, hit rates, and false-alarm rates modulations, respectively (same representation as in A). D, F, H, represent their corresponding amplitude spectra. The red shaded area represents the significant spectral components and the *peaks at 6 Hz and 18 Hz for criterion and 5.8 Hz for hit rates (p < 0.05).
Figure 3.
Figure 3.
Attentional periodicity in V1 and FEF. For each study, the graphs in the left column represent the amplitude spectra obtained by FFT decomposition of the averaged performance (as per hit rates modulation; see Materials and Methods) across participants. Note the distinct frequency axis in the middle, because of the increased time resolution (and corresponding Nyquist frequency) in that study. The bottom, dashed black line represents the amplitude spectrum of the surrogate distribution. The red shaded area represents the significant spectral components and the *peaks at 6 Hz and 18 Hz for the second V1 study and 6.5 Hz for the FEF study (p < 0.05). The right column represents the phase distribution of the peak frequency across participants. P values are obtained from Rayleigh test for non-uniform distribution of circular data.

References

    1. Ashbridge E (1997) Temporal aspects of visual search studied by transcranial magnetic stimulation. Neuropsychologia 35:1121–1131. - PubMed
    1. Biel AL, Friedrich EVC (2018) Why you should report Bayes factors in your transcranial brain stimulation studies. Front Psychol 9:1125. 10.3389/fpsyg.2018.01125 - DOI - PMC - PubMed
    1. Bressler SL, Tang W, Sylvester CM, Shulman GL, Corbetta M (2008) Top-down control of human visual cortex by frontal and parietal cortex in anticipatory visual spatial attention. J Neurosci 28:10056–10061. 10.1523/JNEUROSCI.1776-08.2008 - DOI - PMC - PubMed
    1. Brüers S, VanRullen R (2018) Alpha power modulates perception independently of endogenous factors. Front Neurosci 12:279. 10.3389/fnins.2018.00279 - DOI - PMC - PubMed
    1. Busch NA, VanRullen R (2010) Spontaneous EEG oscillations reveal periodic sampling of visual attention. Proc Natl Acad Sci U S A 107:16048–16053. 10.1073/pnas.1004801107 - DOI - PMC - PubMed

Publication types

LinkOut - more resources