. 2019 Jul;29(7):1087-1099.
doi: 10.1101/gr.245027.118. Epub 2019 Jun 7.

Kinetics of Xist-induced gene silencing can be predicted from combinations of epigenetic and genomic features

Affiliations

Kinetics of Xist-induced gene silencing can be predicted from combinations of epigenetic and genomic features

Lisa Barros de Andrade E Sousa et al. Genome Res. 2019 Jul.

Abstract

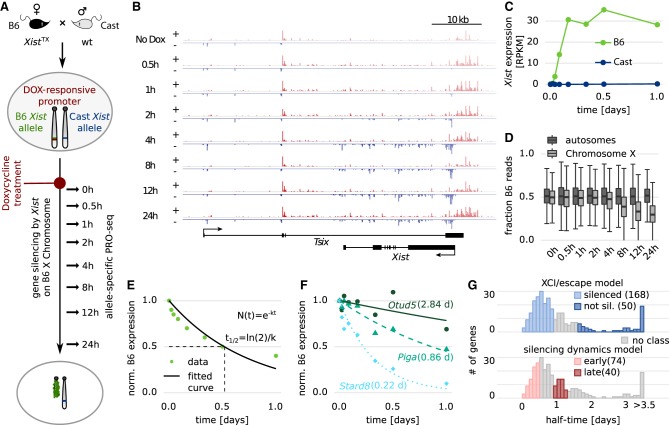
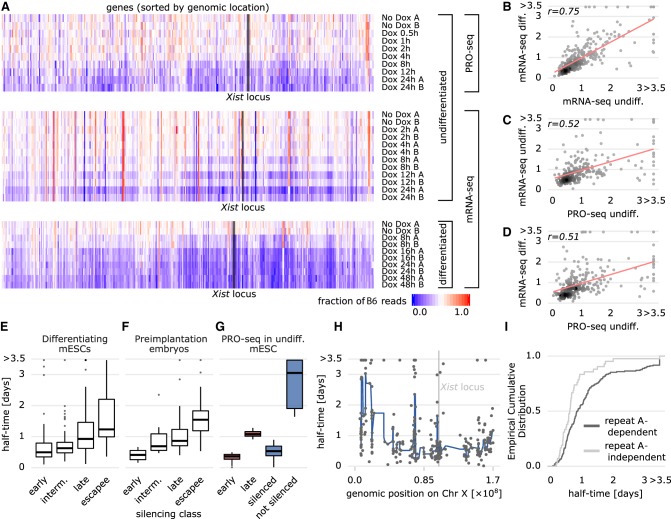
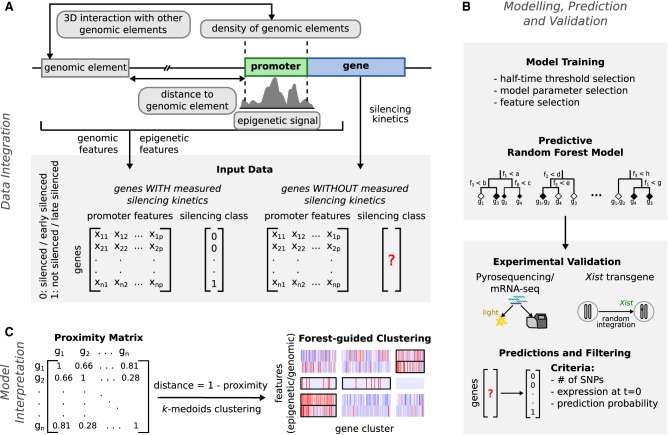
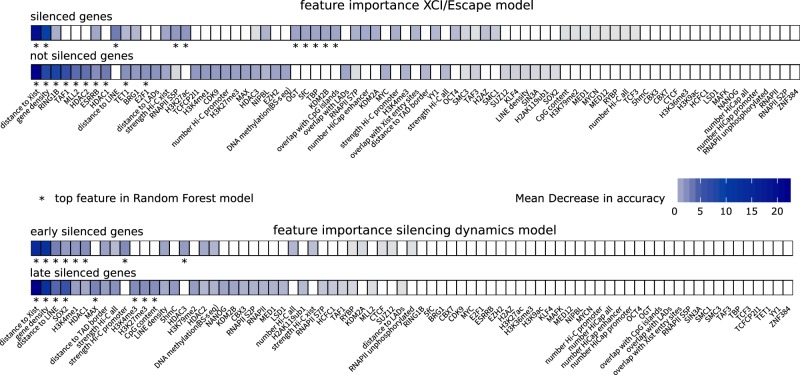
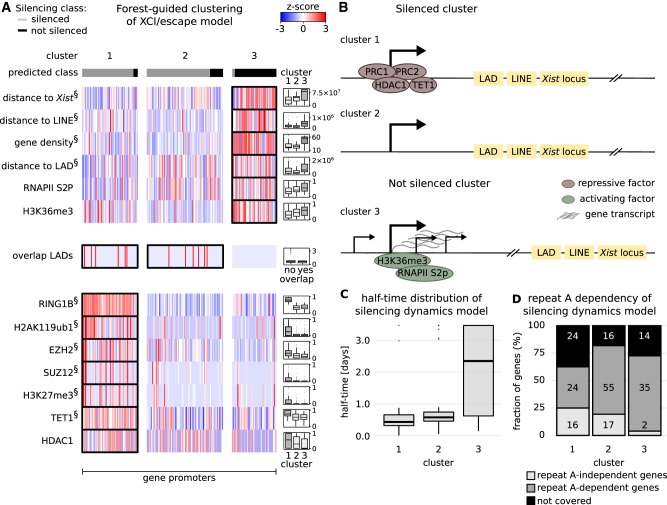
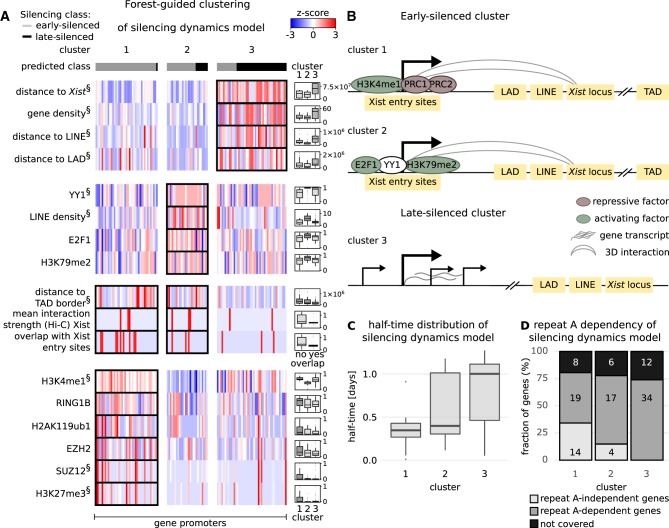
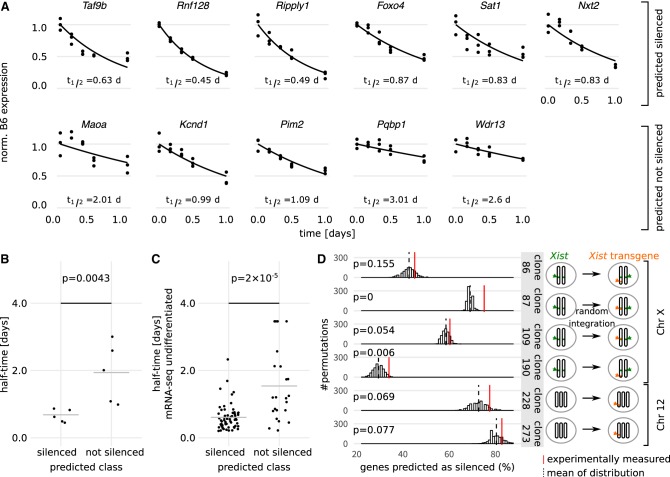
To initiate X-Chromosome inactivation (XCI), the long noncoding RNA Xist mediates chromosome-wide gene silencing of one X Chromosome in female mammals to equalize gene dosage between the sexes. The efficiency of gene silencing is highly variable across genes, with some genes even escaping XCI in somatic cells. A gene's susceptibility to Xist-mediated silencing appears to be determined by a complex interplay of epigenetic and genomic features; however, the underlying rules remain poorly understood. We have quantified chromosome-wide gene silencing kinetics at the level of the nascent transcriptome using allele-specific Precision nuclear Run-On sequencing (PRO-seq). We have developed a Random Forest machine-learning model that can predict the measured silencing dynamics based on a large set of epigenetic and genomic features and tested its predictive power experimentally. The genomic distance to the Xist locus, followed by gene density and distance to LINE elements, are the prime determinants of the speed of gene silencing. Moreover, we find two distinct gene classes associated with different silencing pathways: a class that requires Xist-repeat A for silencing, which is known to activate the SPEN pathway, and a second class in which genes are premarked by Polycomb complexes and tend to rely on the B repeat in Xist for silencing, known to recruit Polycomb complexes during XCI. Moreover, a series of features associated with active transcriptional elongation and chromatin 3D structure are enriched at rapidly silenced genes. Our machine-learning approach can thus uncover the complex combinatorial rules underlying gene silencing during X inactivation.


Figures

Figure 1.
Figure 1.
Measuring gene silencing dynamics. (A) Schematic of the experimental setup used in BF. Using a hybrid female mESC line (B6 × CAST) carrying a Dox-responsive promoter in front of the endogenous Xist gene on the B6 allele, RNAPII activity was measured by allele-specific PRO-seq over a 24-h time course of Dox treatment. (B) Strand-specific read density at the Tsix-Xist locus. Plus-strand is shown in red, minus strand in blue; the y-axis indicates reads per million. (C) Xist expression from the two alleles. (D) Distribution of the fraction of B6 reads for autosomal and X-linked genes over time. (E,F) Schematic (E) and three examples (F) of how gene silencing half-times (in parentheses) were estimated from the allele-specific PRO-seq time course data through fitting an exponential decay function. (G) Distribution of estimated half-times for 280 X-linked genes with an assigned active transcription start site (TSS). The half-time ranges used to define the model classes and the number of genes falling in each category are indicated.
Figure 2.
Figure 2.
Comparison of PRO-seq-based silencing half-times to other data sets. (A) Comparison of PRO-seq (undifferentiated mESC, upper) and mRNA-seq data (undifferentiated mESCs, middle; differentiated mESCs, lower). Fraction of B6 reads are shown for all genes covered in all three data sets, ordered by genomic position. (BD) Comparison of estimated half-times (in days) between the data sets shown in A (replicate B only for mRNA-seq undiff.) with fitted regression lines (red). Pearson correlation coefficients are indicated. (EG) Distribution of half-times within silencing classes defined previously in mESCs (E) (Marks et al. 2015), in preimplantation mouse embryos (F) (Borensztein et al. 2017), and the classes used for Random Forest modeling (G): (blue) XCI/escape model; (red) silencing dynamics model. (H) Estimated half-times (black circles) for all genes in the PRO-seq data set along the X Chromosome. A fitted smooth curve of the half-times is displayed as a blue line, and the Xist locus is marked with a gray line. (I) Cumulative distribution of half-times of genes silenced (independent, light gray) or not silenced (dependent, dark gray) by Xist lacking the repeat A element (Sakata et al. 2017).
Figure 3.
Figure 3.
Schematic overview of our modeling approach. (A) Epigenetic and genomic input data for the model are collected, and feature matrices are computed for all X-linked genes with estimated half-times (labeled) and without estimated half-times (unlabeled). (B) After model training, the XCI/escape model is then used to predict the silencing class of all unlabeled X-linked genes given the same set of input features. The predictions are validated by comparing them to measured half-times from undifferentiated mRNA-seq data, with pyrosequencing experiments (few selected genes) and with measured silencing dynamics of genes in six transgenic mESCs clones. (C) A forest-guided clustering approach was developed for model interpretation. A proximity matrix between genes is computed from the trained model and converted into a distance matrix. Clusters of genes and their most significant associated features are displayed as a heatmap.
Figure 4.
Figure 4.
Feature importance for XCI/escape and silencing dynamics model. For each model, features are ranked class-wise according to their importance for the classification, quantified by the Mean Decrease in Accuracy (MDA) (Methods). (*) The top features of each class (10 for XCI/escape model; 8 for silencing dynamics model) that are used to build the final model. For more details, see Supplemental Figure S3. Similar results are obtained from the XCI/escape model trained on undifferentiated mRNA-seq data (Supplemental Fig. S20; Supplemental Text S8).
Figure 5.
Figure 5.
Classification rules for the XCI/escape model. (A) Results from the forest-guided clustering of the XCI/escape model visualized as a heatmap. Columns indicate the genes grouped by cluster; rows correspond to features with significant differences among clusters (ANOVA test). (§) The top 10 most significant features from the ANOVA test. Distributions of features in each cluster are shown in the box plots next to the heatmap, except for the feature "overlap LADs," where the number of genes in each category is shown. (B) Schematic view of the feature combinations promoting gene silencing (clusters 1 and 2) or escape (cluster 3). (C) Silencing half-time distribution in each cluster. (D) Proportion of genes in each cluster that undergo silencing in mouse trophoblasts, independent or dependent of the Xist-repeat A element (Sakata et al. 2017): (repeat A–dependent genes) genes with abrogated silencing in Xist-repeat A-mutant cells; (repeat A–independent genes) genes that still undergo silencing in the same cells; (not covered) our genes that were not covered in that data set. The numbers in each box indicate the number of genes that fall into each category. Similar results are obtained from the XCI/escape model trained on undifferentiated mRNA-seq data (Supplemental Fig. S20; Supplemental Text S8).
Figure 6.
Figure 6.
Classification rules for the silencing dynamics model. (A) Results from the forest-guided clustering of the silencing dynamics model visualized as a heatmap. Columns indicate the genes grouped by cluster; rows correspond to features with significant differences among clusters (ANOVA test). (§) The top 10 most significant features from the ANOVA test. Differences in the distributions of features between clusters are highlighted in the box plots next to the heatmap, except for two features, where the number of genes in each category is shown. (B) Schematic view of the features associated with early (cluster 1 and 2) and late gene silencing (cluster 3). (C) Silencing half-time distribution for each cluster. (D) The proportion of genes which undergo silencing in mouse trophoblasts, independent or dependent of the Xist-repeat A element, is shown for each cluster, similar to Figure 5D. The numbers in each box indicate the number of genes that fall into each category.
Figure 7.
Figure 7.
Experimental validation of model predictions. (A) Half-times of six candidate genes predicted as “silenced” (top) and five candidate genes predicted as “not silenced” (bottom) were estimated experimentally through allele-specific quantification by pyrosequencing at different time points during 24 h of doxycycline treatment in TX1072 cells in three independent experiments. Individual data points (dots), the fitted exponential decay function (line), and the estimated silencing half-times are shown. (B) Dot plot of the silencing half-times (t1/2) estimated in A. (C) Dot plot of undifferentiated mRNA-seq half-times for genes predicted as silenced and not silenced by our XCI/escape model. The gray line in B and C indicates the mean, and the P-value (Wilcoxon rank-sum test) indicates a significant difference between the mean of the two distributions. (D) Fraction of genes correctly predicted as silenced by the XCI/escape model (red lines) for six cell lines in which an inducible Xist transgene was integrated in different chromosomal locations (orange, cartoon on the right) (Supplemental Table S5). The background distributions of silenced predictions used to estimate empirical P-values is also shown (histogram, black dashed line represents the mean).

References

    1. Andergassen D, Dotter CP, Wenzel D, Sigl V, Bammer PC, Muckenhuber M, Mayer D, Kulinski TM, Theussl HC, Penninger JM, et al. 2017. Mapping the mouse Allelome reveals tissue-specific regulation of allelic expression. eLife 6: e25125 10.7554/eLife.25125 - DOI - PMC - PubMed
    1. Berletch JB, Yang F, Xu J, Carrel L, Disteche CM. 2011. Genes that escape from X inactivation. Hum Genet 130: 237–245. 10.1007/s00439-011-1011-z - DOI - PMC - PubMed
    1. Berletch JB, Ma W, Yang F, Shendure J, Noble WS, Disteche CM, Deng X. 2015. Escape from X inactivation varies in mouse tissues. PLoS Genet 11: e1005079 10.1371/journal.pgen.1005079 - DOI - PMC - PubMed
    1. Bianchi I, Lleo A, Gershwin ME, Invernizzi P. 2012. The X chromosome and immune associated genes. J Autoimmun 38: J187–J192. 10.1016/j.jaut.2011.11.012 - DOI - PubMed
    1. Borensztein M, Syx L, Ancelin K, Diabangouaya P, Picard C, Liu T, Liang JB, Vassilev I, Galupa R, Servant N, et al. 2017. Xist-dependent imprinted X inactivation and the early developmental consequences of its failure. Nat Struct Mol Biol 24: 226–233. 10.1038/nsmb.3365 - DOI - PMC - PubMed

Publication types