. 2019 Aug;31(8):1879-1898.
doi: 10.1105/tpc.19.00110. Epub 2019 Jun 7.

AtTRAPPC11/ROG2: A Role for TRAPPs in Maintenance of the Plant Trans-Golgi Network/Early Endosome Organization and Function

Affiliations

AtTRAPPC11/ROG2: A Role for TRAPPs in Maintenance of the Plant Trans-Golgi Network/Early Endosome Organization and Function

Michel Ruiz Rosquete et al. Plant Cell. 2019 Aug.

Abstract

The dynamic trans-Golgi network/early endosome (TGN/EE) facilitates cargo sorting and trafficking and plays a vital role in plant development and environmental response. Transport protein particles (TRAPPs) are multi-protein complexes acting as guanine nucleotide exchange factors and possibly as tethers, regulating intracellular trafficking. TRAPPs are essential in all eukaryotic cells and are implicated in a number of human diseases. It has been proposed that they also play crucial roles in plants; however, our current knowledge about the structure and function of plant TRAPPs is very limited. Here, we identified and characterized AtTRAPPC11/RESPONSE TO OLIGOGALACTURONIDE2 (AtTRAPPC11/ROG2), a TGN/EE-associated, evolutionarily conserved TRAPP protein in Arabidopsis (Arabidopsis thaliana). AtTRAPPC11/ROG2 regulates TGN integrity, as evidenced by altered TGN/EE association of several residents, including SYNTAXIN OF PLANTS61, and altered vesicle morphology in attrappc11/rog2 mutants. Furthermore, endocytic traffic and brefeldin A body formation are perturbed in attrappc11/rog2, suggesting a role for AtTRAPPC11/ROG2 in regulation of endosomal function. Proteomic analysis showed that AtTRAPPC11/ROG2 defines a hitherto uncharacterized TRAPPIII complex in plants. In addition, attrappc11/rog2 mutants are hypersensitive to salinity, indicating an undescribed role of TRAPPs in stress responses. Overall, our study illustrates the plasticity of the endomembrane system through TRAPP protein functions and opens new avenues to explore this dynamic network.


Figures

Figure 1.
Figure 1.
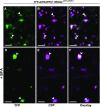
Subcellular Localization of AtTRAPPC11/ROG2 and SYP61. (A) Confocal images showing localization of YFP-AtTRAPPC11/ROG2 in the cytosol and at the TGN/EE (arrowheads) in root cells of 3-d-old Arabidopsis seedlings. (B) CFP-SYP61 localizes at the TGN/EE (arrowheads). (C) YFP-AtTRAPPC11/ROG2 and CFP-SYP61 colocalize at the TGN/EE (arrowheads). Percentage of colocalization = 62%, PCC = 0.61, n > 15 cells per seedling, n > 10 seedlings. Bar in (A) to (C) = 5 μm. (D) After 2 h of treatment with 12.5 μM BFA, YFP-AtTRAPPC11/ROG2 localizes to BFA bodies (arrowheads). (E) CFP-SYP61 localization to BFA bodies 2 h after 12.5 μM BFA treatment. (F) YFP-AtTRAPPC11/ROG2 and CFP-SYP61 colocalize in BFA bodies. Percentage of colocalization = 100%, PCC = 0.75, n > 15 cells per seedling, n > 10 seedlings. Bar in (D) to (F) = 10 μm.
Figure 2.
Figure 2.
SYP61 localization in the attrappc11/rog2-2 Mutant. (A) to (D) TGN and PM localization of CFP-SYP61 at the tip (A) and expansion zone (C) of the root, in Col-0 wild-type background. (B) and (D) Aberrant CFP-SYP61 subcellular localization (arrows) at the tip (B) and expansion zone (D) of the root in the attrappc11/rog2-2 mutant background. Bar in (A) to (D) = 10 μm. (E) to (G) Mislocalization of CFP-SYP61 to tonoplast in attrappc11/rog2-2 is reverted by complementation of the mutant with fluorescently tagged versions of AtTRAPPC11/ROG2 expressed under either the UBIQUITIN10 (UBQ10) (E) or the native (NAT) AtTRAPPC11/ROG2 promoter (F), as shown by the quantification of the percentage of cells displaying tonoplast SYP61 in the wild-type (WT), attrappc11/rog2-2, and complemented mutant backgrounds (G). P < 0.001, one-way ANOVA, n = 15 confocal sections of root cells in the meristematic and transition regions from at least 10 individual seedlings per genotype. Distinct letters indicate statistically significant differences. Error bars represent se. Bar in (E) and (F) = 10 μm. (H) to (J) Staining with the vacuolar (arrows) marker SNARF-1 demonstrates that the aberrant CFP-SYP61 localization corresponds to the tonoplast (arrowheads). Bar in (H) to (J) = 10 μm.
Figure 3.
Figure 3.
Localization of TGN Resident Proteins in the attrappc11/rog2-2 Mutant. (A) and (B) SYP41 immuno-staining on 4-d-old seedlings reveals a reduced number of SYP41 vesicles (red arrowheads) in the attrappc11/rog2-2 mutant (B), compared with Col-0 wild type (WT) (A). Bar in (A) and (B) = 5 μm. (C) and (D) Number of YFP-RABD2A vesicles (white arrowheads) is reduced in root cells of 4-d-old seedlings, in the attrappc11/rog2-2 background (D), compared with the Col-0 wild-type (WT) background (C). Green, YFP-RABD2A; magenta, FM4-64. Bar in (C) and (D) = 10 μm. (E) Quantification of SYP41- and YFP-RABD2A-labeled TGN particle densities in root cells of attrappc11/rog2-2 and Col-0 wild-type (WT) backgrounds. P < 0.001 (***), Student’s t test, n = 15 confocal root sections from at least 10 individual seedlings per genotype. Error bars represent se. (F) to (H) Treatment with 15 μM ES16 for 3 h enhances the mislocalization of CFP-SYP61 to the tonoplast (yellow arrowheads in [F] and [G]) in root cells of 4-d-old attrappc11/rog2-2 mutants, shown by a higher percentage of cells displaying CFP-SYP61 signal at the tonoplast after ES16 treatment (H). P < 0.01 (**), Student’s t test, n = 15 cells per seedling from at least 10 individual seedlings per treatment. Error bars represent se. Bar in (F) to (H) = 10 μm.
Figure 4.
Figure 4.
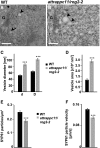
TGN Morphology and Dynamics in the attrappc11/rog2-2 Mutant. (A) and (B) Electron microscopy images showing enlarged TGN vesicles (arrowheads) in root cells of attrappc11/rog2-2 seedlings (B), compared with Col-0 wild type (WT) (A). Bar in (A) and (B) = 200 nm. G, Golgi apparatus. (C) and (D) Measurements of TGN vesicle diameter (C) and area (D) in electron microscopy micrographs. P < 0.001 (***), Student’s t test, n > 5 sections per genotype (>50 particles per genotype). Error bars represent se. d, TGN vesicle diameter measured along the shortest axis of the vesicle; D, TGN vesicle diameter measured along the longest axis of the vesicle. (E) The density of CFP-SYP61–labeled TGN particles is reduced in attrappc11/rog2-2 seedlings, compared with Col-0 wild type (WT). P < 0.001 (***), Student’s t test, n = 10 seedlings per genotype, 20 cells per seedling. Error bars represent se. (F) SYP61 vesicle velocity is reduced in attrappc11/rog2-2 root cells, compared with Col-0 WT. P < 0.001 (***), Student’s t test, n = 10 seedlings per genotype, 20 cells per seedling. Error bars represent se. The color scheme of the graph bars in (C) to (F) indicates the same genotypes.
Figure 5.
Figure 5.
BFA Body Formation in the attrappc11/rog2-2 Mutant. (A) and (B) Confocal imaging of CFP-SYP61–labeled BFA body formation 2 h after treatment of 3-d-old attrappc11/rog2-2 (B) and wild-type (WT; see [A]) seedlings with 12.5 μM BFA. Arrows indicate BFA bodies. (C) and (D) Quantitative 3D analysis of CFP-SYP61–labeled BFA bodies in the wild-type (WT; see [C]) and attrappc11/rog2-2 (D) backgrounds. Objects larger than 20 μm3 (arrows) are only observable in the WT background. n = 24 and 77 cells in WT and attrappc11/rog2-2 backgrounds, respectively. (E) and (F) Confocal imaging of YFP-RABD2A–labeled BFA body formation 2 h after treatment of the 3-d-old attrappc11/rog2-2 and wild-type (WT) seedlings with 12.5 μM BFA. Arrows indicate BFA bodies. The images are representative of confocal root sections obtained from more than 10 seedlings per genotype. (G) to (I) Confocal imaging of FM4-64–labeled BFA bodies 15 min after FM4-64 staining of 4-d-old seedlings treated for 2 h with 12.5 μM BFA. The formation of BFA bodies is reduced in root cells of attrappc11/rog2-2 (H), in contrast to the wild type (WT; see [G]). Complementation of the mutant with YFP-AtTRAPPC11/ROG2 restores BFA body formation to wild-type levels (I). Arrows indicate objects larger than 2.8 μm2. The images are representative of confocal root sections obtained from more than 10 seedlings per genotype. Bars in (G) to (I) = 10 μm.
Figure 6.
Figure 6.
Endocytic Traffic in the attrappc11/rog2-2 Mutant. (A) and (B) Representative 3D renderings of 4-d-old CFP-SYPP61 seedlings showing reduced accumulation of FM4-64 in intracellular vesicles (arrowheads) 18 min after staining with 2 μM FM4-64, in the attrappc11/rog2-2 mutant background (B), compared with Col-0 wild-type (WT) background (A). Bar in (A) and (B) = 10 μm. (C) Quantification of FM4-64 accumulation, expressed as the ratio between mean intracellular fluorescent signal and fluorescent signal at the PM, 12, 15, and 18 min after staining with 2 μM FM4-64. P < 0.05, two-way ANOVA followed by multiple comparisons Tukey test, n > 20 cells per genotype. Distinct letters indicate statistically significant differences. Error bars represent se. Intracell., intracellular. (D) and (E) TGN/EE colocalization of CFP-SYP61 and FM4-64 (arrowheads), 12 min after treatment of 4-d-old seedlings with 2 μM FM4-64, is less frequently observed in the attrappc11/rog2-2 mutant background (E), compared with the Col-0 wild-type (WT) background (D). CFP is indicated in green; FM4-64 is indicated in magenta. Bar in (D) and (E) = 10 μm. (F) Percentages of CFP-SYP61–labeled TGN/EE vesicles displaying colocalization with FM4-64, in relation to the total number of CFP-SYP61–labeled TGN/EE vesicles, 12, 15, and 18 min after staining with 2 μM FM4-64. P < 0.05, two-way ANOVA followed by multiple comparisons Tukey test, n > 20 cells per genotype. Distinct letters indicate statistically significant differences. Error bars represent se. (G) and (H) 3D renderings of SYP61/FM4-64 colocalization in root cells of the Col-0 wild-type (WT; see [G]) and attrappc11/rog2-2 (H) seedlings expressing CFP-SYP61, 12 min after staining with 2 μM FM4-64. CFP-SYP61–labeled vesicles displaying colocalization with FM4-64 (gray) are relatively less abundant in the mutant, compared with the wild-type background. CFP-SYP61–labeled vesicles not colocalized with FM4-64 are shown in green. FM4-64 at the PM is indicated in magenta. Bar in (G) and (H) = 5 μm.
Figure 7.
Figure 7.
AtTRAPPC11/ROG2 Defines an Arabidopsis TRAPP Complex. (A) Spectral counts are presented for the nine Arabidopsis TRAPP orthologs significantly enriched in YFP-ROG2 immunoprecipitates (ROG2 r1 to r3), and for AtTRAPPC11/ROG2 itself (bait). r, biological replicate (r1 to r3, independently grown seedling sets). Note that Arabidopsis orthologs of TRS120 and TRS130, defining the TRAPPII complex, were not detected (nd) in our analysis. FET, Fisher’s exact test; NC, negative control. (B) Volcano plot illustrating log2 fold change (FC, x axis) and statistical significance distribution (y axis) of the proteomic data set (LFQ intensities, MaxQuant). Red squares indicate proteins significantly enriched in YFP-ROG2 immunoprecipitates. Analyses were performed in triplicates.
Figure 8.
Figure 8.
Response of attrappc11/rog2 Mutants to Salt Stress. (A) and (B) Representative 8-d-old seedlings of the mutants attrappc11/rog2-2, attrappc11/rog2-4, attrappc11/rog2-5, and attrappc11/rog2-7 as well as the Col-0 wild-type (WT) and the complemented attrappc11/rog2-2 mutant (YFP-AtTRAPPC11/ROG2attrappc11/rog2-2) are shown (A). Eight days after germination (DAG), all four AtTRAPPC11/ROG2 mutants display reduced root growth, compared with WT and the complemented attrappc11/rog2-2 mutant (B). P < 0.001 (***), one-sample Student’s t test, n = minimum 24 seedlings per genotype. Error bars represent se. (C) and (D) Root elongation shows hypersensitivity to salt treatment in attrappc11/rog2-2, attrappc11/rog2-4, attrappc11/rog2-5, and attrappc11/rog2-7 compared with the Col-0 wild type (WT), 3 and 5 days after transfer (DAT) of 3-d-old seedlings to plates containing 100 mM NaCl. The hypersensitivity of attrappc11/rog2-2 mutants was alleviated by complementation with YFP-AtTRAPPC11/ROG2. The arrowhead in (C) denotes the position of root tips upon transfer. P < 0.001 (***), one-sample Student’s t test, n = minimum 24 seedlings per genotype. Error bars represent se. (E) Time lapse of attrappc11/rog2-2 root growth under 75mm NaCl treatment. Root elongation measurements over the course of 110 h (only diurnal time points) show hypersensitivity of attrappc11/rog2-2 mutants to inhibition of root elongation by 75mm NaCl treatment, compared with the Col-0 wild type (WT; see Supplemental Movie 4). n = 25 seedlings per genotype. Error bars represent sd. (F) The salt hypersensitivity of attrappc11/rog2-2 mutants is dose dependent with 100 mM NaCl treatments resulting in an inhibitory effect on root growth stronger than the inhibition caused by 50 mM NaCl, measured 5 d after treatment. P < 0.0001 (***), one-sample Student’s t test, n = 25 seedlings per genotype. Error bars represent se.
None

References

    1. Allan B.B., Moyer B.D., Balch W.E. (2000). Rab1 recruitment of p115 into a cis-SNARE complex: Programming budding COPII vesicles for fusion. Science 289: 444–448. - PubMed
    1. Alonso J.M., et al. (2003). Genome-wide insertional mutagenesis of Arabidopsis thaliana. Science 301: 653–657. - PubMed
    1. Asaoka R., Uemura T., Nishida S., Fujiwara T., Ueda T., Nakano A. (2013). New insights into the role of Arabidopsis RABA1 GTPases in salinity stress tolerance. Plant Signal. Behav. 8: 8. - PMC - PubMed
    1. Ashburner M., et al. ; The Gene Ontology Consortium (2000). Gene ontology: Tool for the unification of biology. Nat. Genet. 25: 25–29. - PMC - PubMed
    1. Bar M., Leibman M., Schuster S., Pitzhadza H., Avni A. (2013). EHD1 functions in endosomal recycling and confers salt tolerance. PLoS One 8: e54533. - PMC - PubMed

Publication types

MeSH terms

Substances