. 2019 Jul 31;39(31):6081-6094.
doi: 10.1523/JNEUROSCI.2195-18.2019. Epub 2019 Jun 7.

FGF Signaling Directs the Cell Fate Switch from Neurons to Astrocytes in the Developing Mouse Cerebral Cortex

Affiliations

FGF Signaling Directs the Cell Fate Switch from Neurons to Astrocytes in the Developing Mouse Cerebral Cortex

Tung Anh Dinh Duong et al. J Neurosci. .

Abstract

During mammalian neocortical development, neural precursor cells generate neurons first and astrocytes later. The cell fate switch from neurons to astrocytes is a key process generating proper numbers of neurons and astrocytes. Although the intracellular mechanisms regulating this cell fate switch have been well characterized, extracellular regulators are still largely unknown. Here, we uncovered that fibroblast growth factor (FGF) regulates the cell fate switch from neurons to astrocytes in the developing cerebral cortex using mice of both sexes. We found that the FGF signaling pathway is activated in radial glial cells of the ventricular zone at time points corresponding to the switch in cell fate. Our loss- and gain-of-function studies using in utero electroporation indicate that activation of FGF signaling is necessary and sufficient to change cell fates from neurons to astrocytes. We further found that the FGF-induced neuron-astrocyte cell fate switch is mediated by the MAPK pathway. These results indicate that FGF is a critical extracellular regulator of the cell fate switch from neurons to astrocytes in the mammalian cerebral cortex.SIGNIFICANCE STATEMENT Although the intracellular mechanisms regulating the neuron-astrocyte cell fate switch in the mammalian cerebral cortex during development have been well studied, their upstream extracellular regulators remain unknown. By using in utero electroporation, our study provides in vivo data showing that activation of FGF signaling is necessary and sufficient for changing cell fates from neurons to astrocytes. Manipulation of FGF signaling activity led to drastic changes in the numbers of neurons and astrocytes. These results indicate that FGF is a key extracellular regulator determining the numbers of neurons and astrocytes in the mammalian cerebral cortex, and is indispensable for the establishment of appropriate neural circuitry.

Keywords: FGF; astrocyte; cell fate switch; cerebral cortex; neuron.


Figures

Figure 1.
Figure 1.
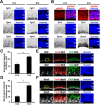
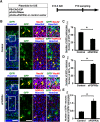
FGF signaling is activated during the neuron–astrocyte cell fate switch in the developing mouse cerebral cortex. Immunohistochemistry and in situ hybridization were performed using 14 μm coronal sections of the mouse cerebral cortex at E15 and E18. A, In situ hybridization for Fgfr1, 2, and 3 in the germinal zones of the mouse cerebral cortex. Scale bar, 50 μm. B, Immunohistochemistry for pMAPK and in situ hybridization for Etv5 and Spry2. Scale bar, 50 μm. C, D, Quantification of Etv5 and Spry2 mRNA signal intensities in the VZ. The signal intensities were increased between E15 and E18 [unpaired Student's t test, *p = 0.0082 (C) and 0.005 (D)]. E, F, In situ hybridization for Etv5 or Spry2 followed by immunostaining for Pax6 and Tbr2 at E18. The areas within the boxes at the top were magnified and shown in the bottom. Note that Etv5 and Spry2 are expressed in Pax6-positive cells but not in Tbr2-positive cells. Scale bars: top, 100 μm; bottom, 25 μm. IZ, Intermediate zone; SVZ, subventricular zone.
Figure 2.
Figure 2.
Subcellular distribution patterns of pMAPK signals. Immunohistochemistry for pMAPK was performed using 14 μm coronal sections of the mouse cerebral cortex at E15 and E18. Images in the VZ were taken using a confocal microscope. Arrowheads indicate the positions of the nuclei. Note that no signal was observed without pMAPK antibody (second antibody). Scale bar, 20 μm.
Figure 3.
Figure 3.
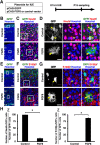
Activation of FGF signaling induces the cell fate switch of GFP-positive cells from neurons to astrocytes in vivo. A, Experimental schematic. pCAG-EGFP plus either pCAG-FGF8 or pCAG control vector was introduced into the mouse cerebral cortex at E15.5 by IUE, and coronal sections were prepared at P15. BD, Sections were stained with anti-GFP and anti-NeuN antibodies and Hoechst 33342. B, Lower-magnification images. The areas within the boxes in B were magnified and shown in C, and the areas within the boxes in C were magnified and shown in D. All GFP-positive cells migrated into layer 2/3 in the control brain, whereas they were ubiquitously located throughout the cortex of the FGF8-electroporated brain. GFP-positive cells in the control brain showed neuronal morphologies (arrows), whereas they exhibited astrocytic star-shaped morphologies with small nuclei and many fine branches in the FGF8-electroporated brain (arrowhead). GFP-positive cells in the control brain coexpressed NeuN (arrows), whereas GFP-positive cells in FGF8-electroporated brain were negative for NeuN (arrowhead). EG, Sections were stained with anti-GFP and anti-S100β antibodies plus Hoechst 33342. E, Lower-magnification images. The areas within the boxes in E were magnified and shown in F, and the areas within the boxes in F were magnified and shown in G. Note that GFP-positive cells in the control brain were S100β-negative (arrow), whereas those in FGF8-transfected brains coexpressed S100β (arrowhead). Numbers indicate layers in the cortex. WM, White matter. Scale bars: B, E, 200 μm; C, F, 50 μm; D, G, 20 μm. H, The percentages of GFP-positive cells coexpressing NeuN (left) or S100β (right). Note that GFP-positive neurons were drastically decreased, and GFP-positive astrocytes were markedly increased by FGF8 (unpaired Student's t test, *p < 0.0001). Error bars represent mean ± SEM.
Figure 4.
Figure 4.
Activation of FGF signaling induces the cell fate switch of GFP-positive cells from neurons to astrocytes in vivo. pCAG-EGFP plus either pCAG-FGF8 or pCAG control vector was introduced into the mouse cerebral cortex at E15.5 by IUE, and coronal sections were prepared at P15. AC, Sections were stained with anti-GFP and anti-NDRG2 antibodies plus Hoechst 33342. A, Lower-magnification images. The areas within the boxes in A were magnified and shown in B, and the areas within the boxes in B were magnified and shown in C. Note that GFP-positive cells in the control brain were NDRG2-negative (arrow), whereas those in FGF8-transfected brains coexpressed NDRG2 (arrowhead). Numbers indicate layers in the cortex. WM, White matter. Scale bars: A, 200 μm; B, 50 μm; C, 20 μm. D, The percentages of GFP-positive cells coexpressing NDRG2. Note that NDRG2-positive astrocytes were markedly increased by FGF8 (unpaired Student's t test, *p < 0.0001). Error bars represent mean ± SEM.
Figure 5.
Figure 5.
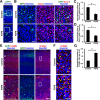
Activation of FGF signaling decreased neurons and increased astrocytes in vivo. pCAG-EGFP plus either pCAG-FGF8 or pCAG control vector was introduced into the mouse cerebral cortex at E15.5 by IUE, and coronal sections were prepared at P15. Sections were stained for GFP plus either NeuN (AD) or NDRG2 (EG), and Hoechst 33342. AD, FGF8 overexpression reduced layer 2/3 neurons. The areas within the boxes in A were magnified and shown in B. Fewer NeuN-positive neurons were observed in layer 2/3 of the FGF8-transfected cortex. C, Quantification of the number of NeuN-positive cells in layer 2/3. The number of layer 2/3 neurons was significantly suppressed by FGF8 (unpaired Student's t test, *p = 0.0069). D, The percentage of cells in layer 2/3 coexpressing NeuN. The percentage was significantly reduced by FGF8 (unpaired Student's t test, *p = 0.0023). EG, FGF8 overexpression increased astrocytes. The areas within the boxes in E were magnified and shown in F. NDRG2-positive astrocytes were markedly increased by FGF8 (arrowheads). G, Quantification of the number of NDRG2-positive cells in the cerebral cortex. Astrocytes were significantly increased by FGF8 (unpaired Student's t test, *p < 0.0001). Error bars represent mean ± SEM. Scale bars: A, 200 μm; B, 50 μm; E, 100 μm; F, 20 μm. Numbers indicate layers in the cortex. WM, White matter.
Figure 6.
Figure 6.
Activation of FGF signaling decreased neurons and increased astrocytes in vivo. pCAG-EGFP plus either pCAG-FGF8 or pCAG control vector was introduced into the mouse cerebral cortex at E15.5 by IUE, and coronal sections were prepared at P15. Sections were stained for GFP plus either Cux1 (AD) or S100β (EG), and Hoechst 33342. AD, FGF8 overexpression reduced layer 2/3 neurons. The areas within the boxes in A were magnified and shown in B. Fewer Cux1-positive neurons were observed in layer 2/3 of the FGF8-transfected cortex. C, Quantification of the number of Cux1-positive cells in layer 2/3. The number of layer 2/3 neurons was significantly suppressed by FGF8 (unpaired Student's t test, *p = 0.0027). D, The percentage of cells in layer 2/3 coexpressing Cux1. The percentage was significantly reduced by FGF8 (unpaired Student's t test, *p = 0.0064). EG, FGF8 overexpression increased astrocytes. The areas within the boxes in E were magnified and shown in F. S100β-positive astrocytes were markedly increased by FGF8 (arrowheads). G, Quantification of the number of S100β-positive cells in the cerebral cortex. Astrocytes were significantly increased by FGF8 (unpaired Student's t test, *p = 0.0006). Error bars represent mean ± SEM. Scale bars: A, 200 μm; B, 50 μm; E, 100 μm; F, 20 μm. Numbers indicate layers in the cortex.
Figure 7.
Figure 7.
Activation of FGF signaling induces an earlier appearance of astrocytes in the cortex. A, Experimental schematic. pCAG-EGFP plus either pCAG-FGF8 or pCAG control vector was introduced into the mouse cerebral cortex at E15.5 by IUE, and coronal sections were prepared at P0. B, Sections were stained for GFP plus GFAP and Hoechst 33342. Images of the germinal zones are shown. The broken lines indicate the surface of the lateral ventricle. Scale bar, 200 μm.
Figure 8.
Figure 8.
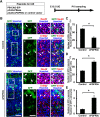
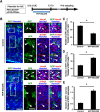
Inhibition of FGF signaling promotes neurogenesis at the expense of astrocytogenesis. A, Experimental schematic. The piggyBac transposon system (pCAG-PBase and PB-CAG-EiP) plus either pCAG-sFGFR3c or pCAG control vector was co-electroporated at E15.5, and the coronal sections were prepared at P10. B, Immunohistochemistry for GFP, NeuN, and S100β was performed. The areas within the boxes on the left were magnified and shown on the right. Note that IUE with the piggyBac system induced GFP expression not only in neurons (arrows), but also astrocytes (arrowheads) in the control brain. Inhibition of FGF signaling by sFGFR3c increased the number of GFP-positive/NeuN-positive neurons (arrows) and decreased the number of GFP-positive/S100β-positive astrocytes (arrowheads). Numbers indicate layers in the cortex. Scale bars: left, 100 μm; right, 50 μm. C, The percentage of GFP-positive cells coexpressing S100β. Inhibition of FGF signaling significantly decreased astrocytes (unpaired Student's t test, *p = 0.0023). D, The percentage of GFP-positive cells coexpressing NeuN. Inhibition of FGF signaling increased neurons (unpaired Student's t test, *p = 0.0023). E, The ratio of the number of GFP-positive neurons to that of GFP-positive astrocytes (unpaired Student's t test, *p = 0.012). Error bars represent mean ± SEM.
Figure 9.
Figure 9.
Inhibition of FGF signaling promotes neurogenesis at the expense of astrocytogenesis. A, Schematic of experiment. The piggyBac transposon system (pCAG-PBase and PB-CAG-EiP) plus either pCAG-sFGFR3c or pCAG control vector was co-electroporated at E15.5, and the coronal sections were prepared at P10. B, Immunohistochemistry for GFP, NeuN, and NDRG2 was performed. The areas within the boxes on the left were magnified and shown on the right. Inhibition of FGF signaling by sFGFR3c increased the number of GFP-positive/NeuN-positive neurons (arrows) and decreased the number of GFP-positive/NDRG2-positive astrocytes (arrowheads). Numbers indicate layers in the cortex. Scale bars: left, 100 μm; right, 50 μm. C, The percentage of GFP-positive cells coexpressing NDRG2. Inhibition of FGF signaling significantly decreased astrocytes (unpaired Student's t test, *p = 0.0017). D, The percentage of GFP-positive cells coexpressing NeuN. Inhibition of FGF signaling increased neurons (unpaired Student's t test, *p = 0.0017). E, The ratio of the number of GFP-positive neurons to that of GFP-positive astrocytes (unpaired Student's t test, *p = 0.0069). Error bars represent mean ± SEM.
Figure 10.
Figure 10.
The effect of an FGFR inhibitor on the neuron–astrocyte cell fate switch. A, Experimental schematic. pCAG-PBase and PB-CAG-EiP were electroporated at E15.5, and the pregnant mothers were treated with the FGFR inhibitor NVP-BGJ398. Coronal sections were prepared at P10. B, Immunohistochemistry for GFP, NeuN, and S100β. The areas within the boxes on the left were magnified and shown on the right. Inhibition of FGF signaling by NVP-BGJ398 increased the number of GFP-positive/NeuN-positive neurons (arrows) and decreased the number of GFP-positive/S100β-positive astrocytes (arrowheads). Numbers indicate layers in the cortex. Scale bars: left, 100 μm; right, 50 μm. C, The percentage of GFP-positive cells coexpressing S100β. Inhibition of FGF signaling significantly decreased astrocytes (unpaired Student's t test, *p = 0.0003). D, The percentage of GFP-positive cells coexpressing NeuN. Inhibition of FGF signaling increased neurons (unpaired Student's t test, *p = 0.0003). E, The ratio of the number of GFP-positive neurons to that of GFP-positive astrocytes (unpaired Student's t test, *p = 0.0011). Error bars represent mean ± SEM.
Figure 11.
Figure 11.
The MAPK pathway was activated in the germinal zones of the mouse cerebral cortex by the introduction of FGF8 by IUE. FGF8 was electroporated at E15.5, and sampling was performed at P0. Coronal sections were stained with anti-pMAPK antibody or subjected to in situ hybridization for Etv5. Overexpression of FGF8 drastically increased pMAPK and Etv5 signals in the germinal zones of the cerebral cortex. Scale bar, 200 μm.
Figure 12.
Figure 12.
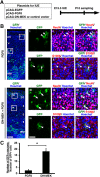
The MAPK pathway mediates the FGF-induced neuron-to-astrocyte cell fate switch. A, Experimental schematic. pCAG-EGFP and pCAG-FGF8 plus either pCAG-DN-MEK or pCAG control vector were co-electroporated at E15.5, and the coronal sections were prepared at P10. B, Immunohistochemistry for GFP, NeuN, and S100β. The areas within the boxes on the left were magnified and shown on the right. As shown in Figures 3 and 4, IUE with pCAG-FGF8 produced many GFP-positive astrocytes (FGF8, arrowheads). Inhibition of MAPK signaling by DN-MEK increased the number of GFP-positive/NeuN-positive neurons (DN-MEK+FGF8, arrows) and decreased the number of GFP-positive/S100β-positive astrocytes (DN-MEK+FGF8, arrowheads). Numbers indicate layers in the cortex. WM, White matter. Scale bars: left, 200 μm; right, 50 μm. C, The percentage of GFP-positive cells coexpressing NeuN. The numbers of immunopositive cells in the gray matter and the white matter were counted. Inhibition of MAPK signaling significantly increased neurons (unpaired Student's t test, *p = 0.0009). Error bars represent mean ± SEM.
Figure 13.
Figure 13.
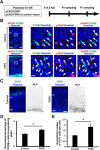
Activation of FGF signaling promotes astrocyte proliferation and oligodendrogenesis. A, Schematic of experiment. pCAG-EGFP plus either pCAG-FGF8 or pCAG control vector was introduced into the mouse cerebral cortex by IUE at E15.5, and coronal sections were prepared at P3 for pHH3 and S100β immunostaining and at P7 for PLP in situ hybridization. B, Immunohistochemistry for pHH3 and S100β. Arrows indicate S100β-positive/pHH3-negative cells, whereas arrowheads indicate S100β-positive cells coexpressing pHH3. Scale bars: left, 200 μm; right, 20 μm. C, In situ hybridization for PLP. PLP-positive cells were increased by FGF8. Scale bar, 200 μm. D, Quantification of the percentage of S100β-positive cells coexpressing pHH3 in the cortex. The percentage of S100β-positive cells coexpressing pHH3 in the electroporated side of the cortex were divided by those in the contralateral non-electroporated cortex (unpaired Student's t test, *p = 0.0282). Error bars represent mean ± SEM. E, Quantification of the number of PLP-positive cells in the cortex. The numbers of PLP-positive cells in the electroporated cortex were divided by those in the other non-electroporated cortex (unpaired Student's t test, *p = 0.0289). Error bars represent mean ± SEM. CP, cortical plate; Hip, Hippocampus; WM, white matter.

Similar articles

Cited by

References

    1. Bandeira F, Lent R, Herculano-Houzel S (2009) Changing numbers of neuronal and non-neuronal cells underlie postnatal brain growth in the rat. Proc Natl Acad Sci U S A 106:14108–14113. 10.1073/pnas.0804650106 - DOI - PMC - PubMed
    1. Bansal R, Kumar M, Murray K, Morrison RS, Pfeiffer SE (1996) Regulation of FGF receptors in the oligodendrocyte lineage. Mol Cell Neurosci 7:263–275. 10.1006/mcne.1996.0020 - DOI - PubMed
    1. Barnabé-Heider F, Wasylnka JA, Fernandes KJ, Porsche C, Sendtner M, Kaplan DR, Miller FD (2005) Evidence that embryonic neurons regulate the onset of cortical gliogenesis via cardiotrophin-1. Neuron 48:253–265. 10.1016/j.neuron.2005.08.037 - DOI - PubMed
    1. Bonni A, Sun Y, Nadal-Vicens M, Bhatt A, Frank DA, Rozovsky I, Stahl N, Yancopoulos GD, Greenberg ME (1997) Regulation of gliogenesis in the central nervous system by the JAK-STAT signaling pathway. Science 278:477–483. 10.1126/science.278.5337.477 - DOI - PubMed
    1. Bronstein R, Kyle J, Abraham AB, Tsirka SE (2017) Neurogenic to gliogenic fate transition perturbed by loss of HMGB2. Front Mol Neurosci 10:153. 10.3389/fnmol.2017.00153 - DOI - PMC - PubMed

Publication types

Substances

LinkOut - more resources