. 2019 Sep:141:115-140.
doi: 10.1016/j.freeradbiomed.2019.05.033. Epub 2019 Jun 6.

Human myeloperoxidase (hMPO) is expressed in neurons in the substantia nigra in Parkinson's disease and in the hMPO-α-synuclein-A53T mouse model, correlating with increased nitration and aggregation of α-synuclein and exacerbation of motor impairment

Affiliations

Human myeloperoxidase (hMPO) is expressed in neurons in the substantia nigra in Parkinson's disease and in the hMPO-α-synuclein-A53T mouse model, correlating with increased nitration and aggregation of α-synuclein and exacerbation of motor impairment

Richard A Maki et al. Free Radic Biol Med. 2019 Sep.

Abstract

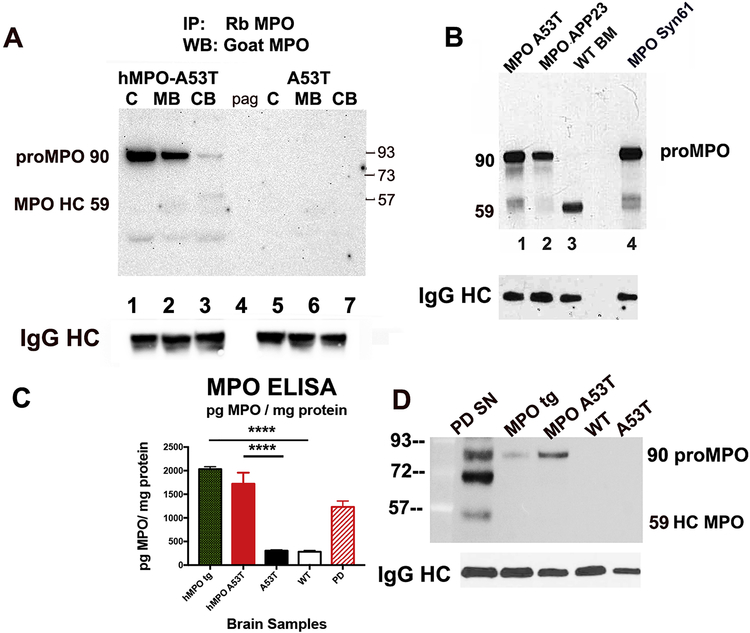
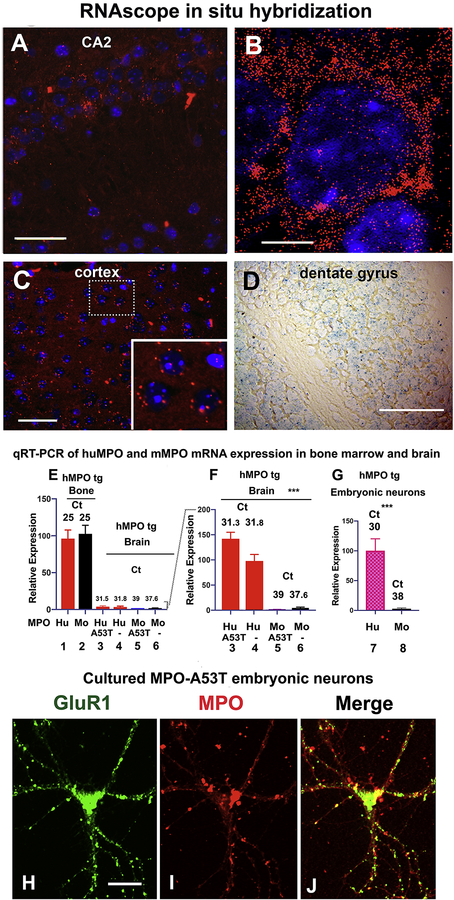
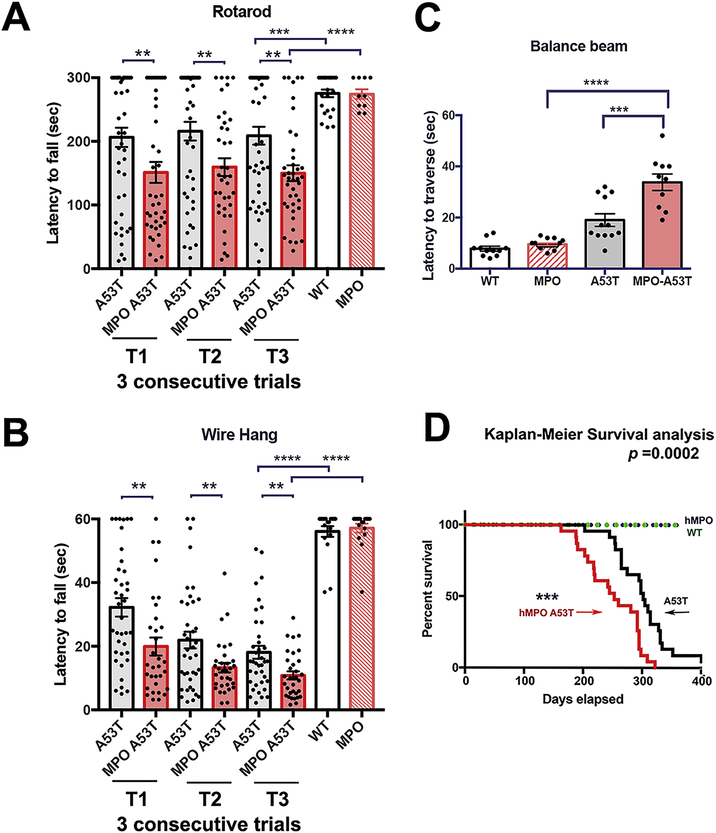
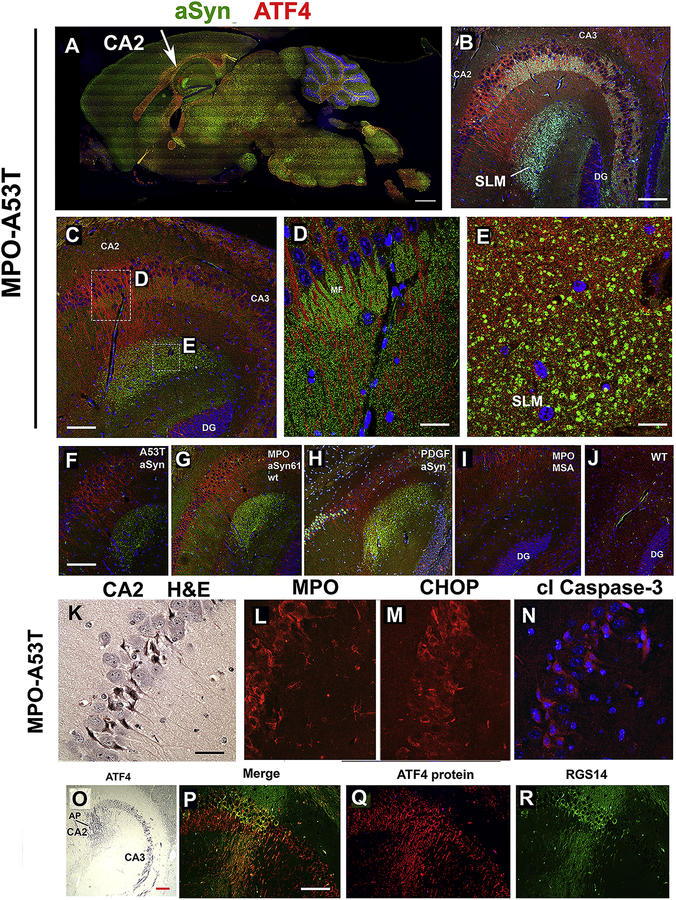
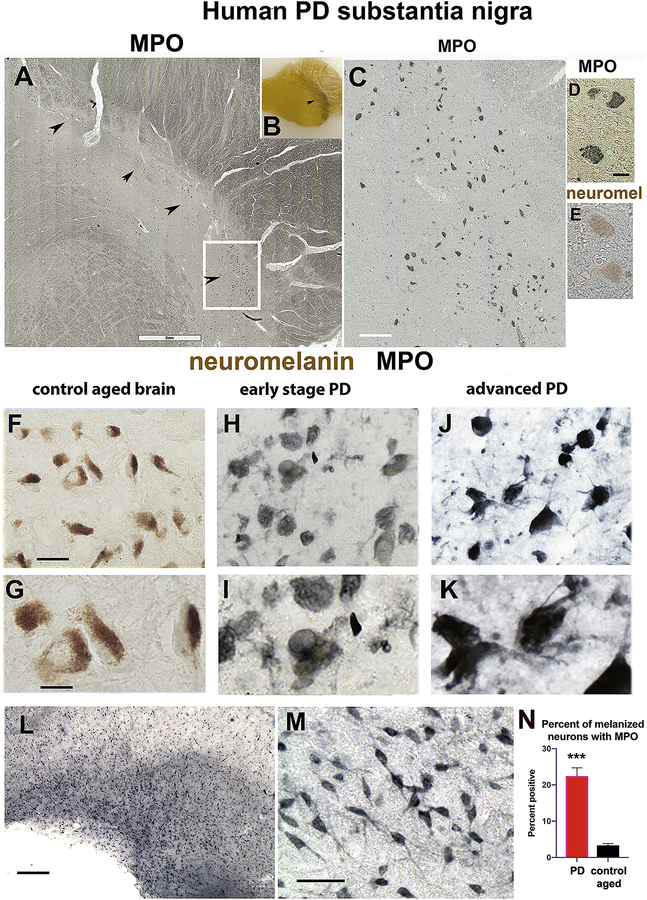
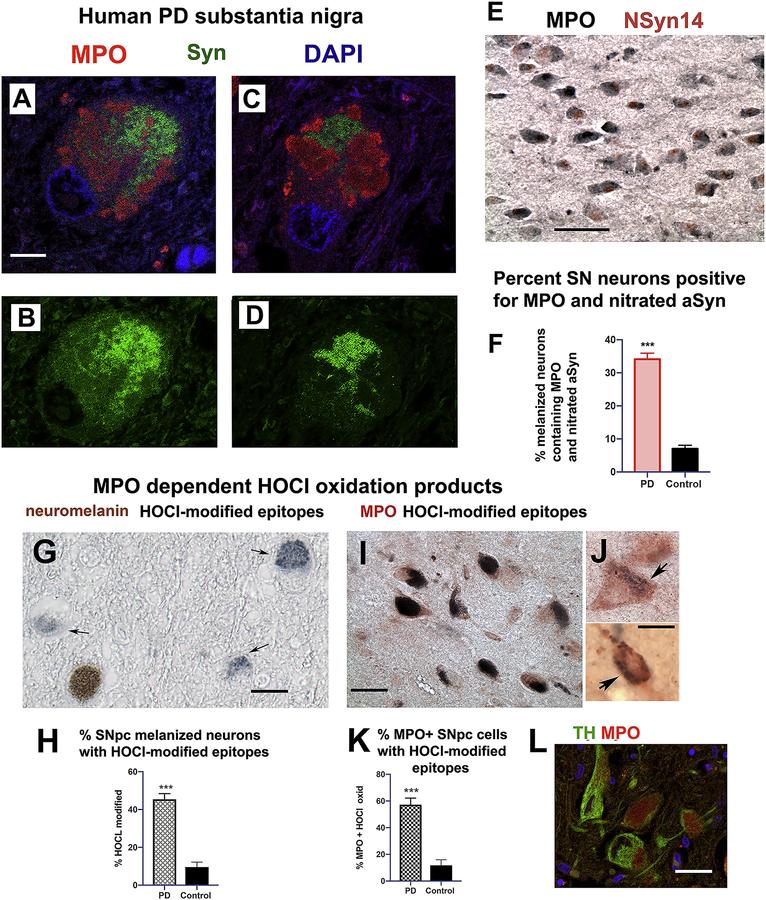
α-Synuclein (αSyn) is central to the neuropathology of Parkinson's disease (PD) due to its propensity for misfolding and aggregation into neurotoxic oligomers. Nitration/oxidation of αSyn leads to dityrosine crosslinking and aggregation. Myeloperoxidase (MPO) is an oxidant-generating enzyme implicated in neurodegenerative diseases. In the present work we have examined the impact of MPO in PD through analysis of postmortem PD brain and in a novel animal model in which we crossed a transgenic mouse expressing the human MPO (hMPO) gene to a mouse expressing human αSyn-A53T mutant (A53T) (hMPO-A53T). Surprisingly, our results show that in PD substantia nigra, the hMPO gene is expressed in neurons containing aggregates of nitrated αSyn as well as MPO-generated HOCl-modified epitopes. In our hMPO-A53T mouse model, we also saw hMPO expression in neurons but not mouse MPO. In the mouse model, hMPO was expressed in neurons colocalizing with nitrated αSyn, carbamylated lysine, nitrotyrosine, as well as HOCl-modified epitopes/proteins. RNAscope in situ hybridization confirmed hMPO mRNA expression in neurons. Interestingly, the hMPO protein expressed in hMPO-A53T brain is primarily the precursor proMPO, which enters the secretory pathway potentially resulting in interneuronal transmission of MPO and oxidative species. Importantly, the hMPO-A53T mouse model, when compared to the A53T model, exhibited significant exacerbation of motor impairment on rotating rods, balance beams, and wire hang tests. Further, hMPO expression in the A53T model resulted in earlier onset of end stage paralysis. Interestingly, there was a high concentration of αSyn aggregates in the stratum lacunosum moleculare of hippocampal CA2 region, which has been associated in humans with accumulation of αSyn pathology and neural atrophy in dementia with Lewy bodies. This accumulation of αSyn aggregates in CA2 was associated with markers of endoplasmic reticulum (ER) stress and the unfolded protein response with expression of activating transcription factor 4 (ATF4), C/EBP homologous protein (CHOP), MPO, and cleaved caspase-3. Together these findings suggest that MPO plays an important role in nitrative and oxidative damage that contributes to αSyn pathology in synucleinopathies.

Keywords: Alpha synuclein; Carbamylation; Dementia with lewy bodies; ER stress; Hippocampus CA2 region; Hypochlorous acid; MPO-H(2)O(2)-chloride system; Myeloperoxidase; Nitration; Parkinson's disease; Reactive oxygen species; Synucleinopathies; Unfolded protein response.


Figures

Figure 1.
Figure 1.. hMPO is expressed in neurons in the hMPO-A53T mouse model of PD.
(A-E) Representative photomicrographs showing MPO immunostaining in brain sections from the hMPO-A53T mice in (A) cortex, (B) hippocampus, (C) midbrain, (D) cerebellum and (E) spinal cord. (F – J) The same regions of A53T brain sections were immunostained for MPO. Due to low levels of immunostaining for mouse MPO, sections F-J were stained with nuclear fast red to show tissue architecture. Scale bar for A-J is in panel A (50 mm). (K and L) Representative dual color photomicrograph of immunofluorescence staining of MPO (red) and MAP2 (green) in hippocampal (K) and cortical (L) regions from the hMPO-A53T mouse. Single channel images for the green or red fluorescence are shown below the merged images. Arrows indicate green MAP2 stained projections extending from red MPO stained soma in both hippocampus (K) and cortex (L). Scale bars for K and L are 10 μm. (M) Representative immunofluorescence staining of MPO (green) and NeuN (red) in the cortex. (N) Single channel green immunofluorescence staining of MPO in the cortex. (O) Image analysis of representative sections to estimate the percent of cells showing colocalization with MPO and NeuN. Scale bar for M,N is in M (10 μm). All mice used in these studies were males.
Figure 2.
Figure 2.. MPO is expressed as the precursor 90 kDa Pro-MPO secretory form
(A). Immunoprecipitation of MPO from different brain regions. Antibodies to MPO (DAKO, rabbit) were added to extracts of isolated regions of mouse brains and bound proteins pulled down with magnetic protein A/G beads. Bound proteins were eluted and fractionated by SDS-PAGE (4–12%). Western blots were probed with HRP-conjugated goat anti-MPO antibodies (R&D) to reveal immunoprecipitated proteins from hMPO-A53T cortex/hippocampus (C) (lane1), midbrain including thalamus, striatum, substantia nigra (MB) (lane 2), or cerebellum/brainstem (CB) (lane 3). The control pulldown from the hMPO-A53T cortical extract with Protein A/G beads in absence of antibodies to MPO is in lane 4 (pag). Proteins were also pulled down from extracts of A53T cortex (C) (lane 5), midbrain (MB) (lane 6), and cerebellum/brainstem (CB) (lane 7). (n= 4 MPO-A53T brains and 4 A53T brains separated into cortex/hippocampus, midbrain, and cerebellum/brainstem, the regions combined and extracts prepared for immunoprecipitation). The Western blot was probed for rabbit IgG heavy chain as a loading control (IgG HC). (B) Immunoprecipitation of MPO from brain of other mouse strains revealed that proMPO is predominantly expressed in several mouse models in which the humanized MPO mouse was crossed to neurodegenerative disease models including the PD model expressing A53T (MPO-A53T) (lane1), an AD model expressing the human amyloid precursor protein (MPO-APP23) (lane 2), and the PD model expressing wild-type (WT) hαSyn (MPO-Syn61) (lane 4). Mouse WT bone marrow (WT BM) (lane 3) was included as a myeloid control expressing the MPO 59 kDa heavy chain. The Western blot was probed for rabbit IgG heavy chain as a loading control (IgG HC). (C) MPO was quantified by ELISA in brain extracts prepared from hMPO tg, hMPO-A53T, A53T, C57Bl/6 WT and human PD SN. Protein levels were determined by BCA. For the mouse samples each bar represents the average +/− S.E.M. (n=6). For the human PD samples the bar represents the average +/− S.E.M. (n=3). The mouse data were analyzed using one-way ANOVA with post hoc Dunnett’s test. The asterisks indicate a significant difference (p<0.0001) between the hMPO tg and hMPO-A53T as compared to A53T or C57Bl/6 WT mice. (D) MPO was immunoprecipitated as above from human PD SN and compared to hMPO tg, MPO-A53T, WT, and A53T whole brain extracts. The proMPO 90 kDa band is present in PD SN comigrating with the 90 kDa band in hMPO tg and MPO-A53T, but lacking in WT and A53T brain. The PD SN sample also had the 55–59 kDa MPO heavy chain as well as a 70 kDa band which may be a processing intermediate. The Western blot was probed for rabbit IgG heavy chain as a loading control (IgG HC). All mice used in these studies were males.
Figure 3.
Figure 3.. hMPO mRNA is expressed in neurons in the hMPO-A53T mice while mMPO mRNA is low to nondetectable.
(A)Immunofluorescence detection of hMPO mRNA transcripts in puncta in CA2 neurons of the hMPO-A53T mice at low power (AlexaFluor 594, red) as detected by RNAscope in situ hybridization. (B) Higher resolution confocal image of a single central CA2 neuron with an oil immersion 63x objective showing distinct puncta of hMPO mRNA (red) with nuclei counterstained with DAPI. (C) hMPO mRNA transcripts detected in cortical neurons of the hMPO-A53T mice with boxed area enlarged at corner. (D) hMPO mRNA detected by blue peroxidase chromagen over dentate gyrus neurons at low magnification. Scale bar A (30 μm); B (5 μm); (C 40 μm); D (30 μm). H,I,J (10 μm). (E,F) qPCR measures hMPO mRNA and mMPO mRNA extracted from bone marrow or brains of hMPO transgenic or hMPO-A53T mice. hMPO expression in hMPO A53T bone marrow is set at 100 on the relative scale (E) with the quantitation cycle (Ct) of Ct 25 for hMPO (lane 1) and Ct 25 for mMPO (lane 2). In brain tissue mRNA levels declined considerably (E lanes 3–6 enlarged in F with hMPO (lane 4) set at 100 on the relative scale). hMPO expression is at Ct 31.3 in hMPO-A53T brain and 31.8 in hMPO transgenic brain (lanes 3 and 4). Mouse MPO expression is at Ct 39 in hMPO-A53T brain and Ct 37.6 in hMPO transgenic brain (lanes 5 and 6). Each increase of one Ct is equal to a twofold decrease in expression levels. Results were analyzed using GraphPad Prism ANOVA. (G) In embryonic cultured neurons, hMPO mRNA expression was at Ct 30 (lane 7), similar to expression levels in brain (lane 4) while mMPO expression was at Ct 38 (lane 8), equivalent to levels in brain (lane 6). The qPCR results are shown as the mean Ct ± S.E.M. of three independent experiments performed in duplicate. Results in panel G were analyzed using GraphPad Prism and Student’s t-test. (H-J) Immunostaining of a cultured embryonic neuron from MPO-A53T model showing neuron marker GluR1 (H), MPO (I), and the merged image showing colocalization (J). Scale bar 10 μm. All mice used in these studies were males.
Figure 4.
Figure 4.. hMPO expression in neurons in the hMPO-A53T model is associated with increased nitration of αSyn.
(A) Immunostaining of dystrophic midbrain neurons containing αSyn (red, Syn505) and hMPO (black) (boxed region enlarged in B). (C) In cortical neurons, MPO is immunodetected in neuronal soma (red) while nitroTyr modified proteins are detected in neurite projections (green), seen more clearly in the single channel green (C’). (D) Quantitation of the percentage of hippocampal neurons in CA2/3 region that costain for both MPO and nSyn14 are shown for MPO A53T and A53T. (n = 3 mice of each genotype, three sections per brain, and 4 images per section were analyzed.) (E-I) Immunostaining of the hippocampal CA2/3 region for MPO (E), nitrated αSyn (monoclonal antibody nSyn14 specific to nitrated αSyn) (G) and the merged image (I). Boxed area in panel I and the equivalent regions in E,G are enlarged below in F,H,J. The boxed area in merged J is enlarged in L (both MPO and nSyn14). The boxed area in H is enlarged in K (nSyn14 alone). All mice used in these studies were males. Scale bar A (30 μm), B (10 μm), C and C’ (30 μm), E,G,I (30 μm), F,H,J (10 μm), K,L (15 μm).
Figure 5.
Figure 5.. NitroTyr levels are higher in the hippocampus and cortex of hMPO-A53T mice as compared to the A53T mice.
(A,B,C,D) Immunohistochemical staining of nitroTyr in the hippocampus of the hMPO-A53T mice (A, boxed area enlarged in B) and the A53T mice (C, boxed area enlarged in D) (Millipore rabbit anti-nitrotyrosine, 1/200). (E,F,G,H) Immunohistochemical staining of nitroTyr in the cortex of the hMPO-A53T mice (E, enlarged in F) and the A53T mice (G, enlarged in H). (I,J) Quantitation of relative levels of nitrotyrosine staining in hippocampus (I) and in cortex (J). Fluorescence signal was measured as integrated density after background subtraction using Image J/Fiji software. Quantitation was performed on five biological replicates of each genotype using three paraffin sections of each, and analysis of four regions within each section of hippocampal CA2/3 and four regions from the cortex (**p <0.005, Student’s t-test). Scale bar 30 mm. All mice used in these studies were males.
Figure 6.
Figure 6.. MPO colocalizes with HOCl-modified epitopes in hMPO-A53T brain.
(A)MPO immunostaining of cortical neurons in hMPO-A53T brain showing speckled vesicular pattern (AlexaFluor488, green). (B) Immunostaining for HOCl-modified epitopes using monoclonal antibody clone 2D10G9 (AlexaFluor 594, red). (C) Merged image with boxed central neuron enlarged at lower left inset, and same for panels A and B. (D) Left upper inset in panel C enlarged to show region of colocalization of HOCl epitopes and MPO (yellow, arrow) in neuron with unstained nucleus (arrowhead). The no primary antibody control image for merged green and red channels is shown in panel E. Scale bar A 10 mm. Scale bar insets 5 mm. Scale bar E 5 μm. Representative immunoperoxidase images show MPO-generated HOCl-modified epitopes detected in cortical neurons from MPO A53T (F) or A53T (G) with monoclonal antibody 2D10G9. (H) Image analysis of levels of 2D10G9 immunoreactivity expressed as corrected optical density analyzed by ImageJ/Fiji software (Student’s t-test). N = 5 mice of each genotype, 3 sections analyzed, 4 images analyzed per section. All mice used in these studies were male.
Figure 7.
Figure 7.. Carbamylated αSyn and MPO colocalize in hippocampal neurons of the hMPO-A53T mice.
(A)Immunostaining of MPO (red) and carbamylated αSyn (green) in mouse hippocampus (merged confocal image). (B) Boxed area in A is enlarged. (C) Green channel shows carbamylated αSyn alone. (D) Red channel shows MPO alone. (E,F) Carbamylated αSyn staining in MPO-A53T (E) and A53T (F) in the CA3 region of the hippocampus. (G) Quantitation of numbers of CA3 neurons positive for carbamylated αSyn in MPO-A53T and A53T hippocampus. (H) Mass spectrometry quantitation of levels of carbamylated lysine (homocitrulline) in the A53T mouse brain as compared to the hMPO-A53T mouse brain (**p <0.005). (I) Characterization of the carbsyn-1 antibody. The carbsyn-1 antibody recognizes carbamylated αSyn (Lane 1) but not αSyn (Lane 2). Both carbamylated αSyn and αSyn are recognized by the antibody to αSyn (BD). When the carbsyn-1 antibody was neutralized with a-Syn peptide #1 neither carbamylated αSyn (Lane 5) nor αSyn (Lane 6) were recognized by the carbsyn-1 antibody. For both carbamylated αSyn and αSyn, 0.2 micrograms of sample was loaded on the gel. Data represent mean ± S.E.M. (Student’s t test. ***p <0.001). Scale bar A (50 μm), B-D (15 μm), E,F (10 μm). All mice used in these studies were male. N = 5 mice of each genotype, three sections from each brain, four images analyzed per section.
Figure 8.
Figure 8.. MPO nitrates and carbamylates αSyn in vitro giving rise to dimers and oligomers.
(A)(Lane 1–3) αSyn was incubated with MPO, glucose oxidase, and glucose (MPO-GO) and nitrite and subjected to SDS-PAGE (4–12%). Western blots were performed using an antibody to nitroTyr (Millipore) demonstrating the presence of nitrated monomer, dimers, trimers and oligomers (lane 2). The MPO-GO system (lane 1) or unmodified αSyn (lane 3) were used as controls. (B)(Lane 47) αSyn was incubated with the MPO-GO system in the presence of cyanate (SCN) (lane 5) or nitrite (lane 6). Samples were again subjected to SDS-PAGE and Western blots were performed using an affinity purified mAb to nonmodified αSyn (BD). Evidence of dimers was observed when αSyn was incubated with the MPO-GO system and SCN (lane 5) or dimers and oligomers when incubated with nitrite (lane 6). The MPO-GO system (lane 4) or unmodified αSyn (lane 7) were used as controls. (C) Schematic depiction of amino acid sequence of αSyn and identified sites of oxidation by MPO carbamylation (blue boxes) and nitration (red boxes) identified by mass spectrometry. (D) Model of carbamylation and nitration sites in αSyn (PDB ID:1XQ8) [84, 85]. (E) Synaptosome preparations from A53T and hMPO-A53T mouse brains were diluted in PBS + 1% NP40 for 1 h prior to mild suction through cellulose acetate filters (0.2 μm) and washed with PBS + 1% SDS prior to being probed with antibody LB509 that was generated against Lewy bodies and recognizes human but not mouse αSyn. Detection was with HRP labeled anti-mouse IgG. (F) Bar-graph of densitometric quantification of LB509 bands in E. Quantitation of band intensity was performed with Image Studio Lite software. Analysis of statistical significance was performed with GraphPad Prism (**p <0.001, Student’s t-test). All mice used in this study were males.
Figure 9.
Figure 9.. Impaired motor abilities in hMPO-A53T mice compared to A53T.
(A) Rotarod analysis was performed with the indicated genotypes A53T, hMPO-A53T, hMPO transgenics (MPO), and wild-type (WT, C57Bl/6) (n = 47 A53T, 40 hMPO-A53T, 10 hMPO, 23 WT). Only male mice were used in these experiments. Three consecutive trials (T1 – T3) with rest intervals were performed for each group. Only the third trial is shown for WT and hMPO mice. (B) The wire hang was performed with the indicated genotypes as in (A) (n = 38 A53T, 32 hMPO-A53T, 13 hMPO, 13 WT). Three trials with rest intervals were performed for each group. Only the third trial is shown for WT and MPO mice. (C) Balance beam was performed with the genotypes indicated (n = 6–11 for each group). Behavior data were analyzed using a one-way analysis of variance (ANOVA) followed by Dunnets post-hoc test using GraphPad Prism v8. Data are represented as mean +/− S.E.M. (**p, < 0.005, ***p, <0.001, ****p, <0.0001). (D) hMPO-A53T mice reach end stage paralysis earlier than A53T mice. This is shown for the hMPO-A53T, A53T, hMPO, and WT mice (n = 23 hMPO-A53T, 23 A53T, 10 hMPO, 10 WT). Onset of hind limb paralysis was the end point. Statistical significance determined by Kaplan-Meier survival analysis (Mantel-Cox) for hMPO-A53T and A53T (***P = 0.0002).
Fig. 10.
Fig. 10.. Accumulation of αSyn aggregates in hippocampal CA2 region associated w ith ATF4 expression in dendrites.
(A) A sagittal section of MPO-A53T brain was immunostained with αSyn505 (green) and ATF4 (red). An arrow points to the hippocampal CA2 region with red and green staining. (B) Higher magnification of the CA2 region shows the dentate gyrus (DG), CA3, and CA2 regions. ATF4 immunostaining (red) is seen in CA2 neurites terminating in a region of αSyn aggregates (green) in the stratum lacunosum moleculare (SLM). (C,D,E) Higher definition confocal image (C) shows two boxed regions in CA2 that are magnified in D and E. (D) ATF4 present in punctate vesicles (red) in CA2 neurites passing through the mossy fiber tract (MF). (E) CA2 neurites with ATF4 (red) passing through larger bead-like aggregates of αSyn (Syn505) (green) in the SLM. (F,G,H) This staining pattern for ATF4 and αSyn aggregates is also seen in A53T brain lacking hMPO, though staining is less intense (F), as well as in the hMPO-Syn61 model (G), and in the PDGF-αSyn model (H). (I) The hMPO-MSA model shows lower level of ATF4 staining in CA2 neurites (red) but lacks the αSyn aggregates (green). (J) CA2 region from wild-type mice lacks both ATF4 staining and αSyn aggregates. (K) The CA2 region of hMPO-A53T brain is stained with hematoxylin and eosin showing pyknotic neurons. (L,M,N) Immunostaining of MPO-A53T CA2 region for MPO (L), CHOP (M), and cleaved caspase-3 (N). (O) A low magnification image of the hippocampus shows ATF4 immunostaining (black) throughout the CA2 and CA3 soma while only CA2 apical dendrites (AP) express significant ATF4. (P,Q,R) Confocal images show immunostaining of the CA2 region for RGS14 (R), a specific marker for CA2 neurons, ATF4 (Q), and the merged images (P). Scale bars A 1 mm, B 40 μm, C 70 μm, D 15 μm, E 15 μm, F-J 100 μm, K 25 μm, O 30 μm P-R 30 μm. All mice used in these studies were males.
Figure 11.
Figure 11.. MPO is expressed in neurons in PD substantia nigra.
(A) Sections of PD SNpc were immunostained with anti-MPO antibodies (rabbit polyclonal, Dako) followed by biotinylated secondary antibodies and developed with Vector SG peroxidase substrate (black). Arrowheads denote the tract of melanized neurons. Boxed area is enlarged in panel C. (B) Paraffin block containing control human SNpc with arrow indicating the melanized tract. (C) MPO immunostaining of melanized neurons in PD SNpc at higher magnification. (D) Magnification of MPO immunostained neurons from the melanized tract. (E) Melanized neurons lacking MPO immunostaining showing brown neuromelanin. (F,G) MPO immunostaining (black) of melanized neurons (brown) in control aged brain tissue (F) with higher magnification in G. (H,I) MPO immunostaining (black) in melanized (brown) neurons in the SNpc from early stage PD (H), shown at higher magnification in I. (J,K) MPO immunostaining (black) in dystrophic SNpc neurons exhibiting fibrous dystrophic morphology in advanced stage PD (J), with higher magnification in K. (L) Low magnification image of an adjacent region showing MPO immunostaining of a different subset of neurons, shown at higher magnification in (M). (N) A minimum of three sections from eight PD and eight normal control SN were analyzed by counting the numbers of melanized neurons with MPO immunostaining, with four areas imaged per section. Representative examples are shown. Scale bar A (2 mm), C (200 μm), D,E (5 μm), F, (20 μm), G (10 μm), L (250 μm), M (50 μm).
Figure 12.
Figure 12.. MPO specific HOCl-modification products in melanized neurons in PD SNpc.
(A-D) Two representative examples (A and C) of confocal immunofluorescence staining of neurons from PD SNpc showing MPO (Dako rabbit anti-hMPO, Alexafluor 594, red), αSyn (mouse monoclonal antibody Syn505, Alexafluor 488, green), and DAPI (blue) (63x objective). (B and D) The single green channel immunofluorescence shows αSyn from A and C respectively. (E) Immunoperoxidase staining of MPO (Dako rabbit) and nitrated αSyn (nSyn14)(red) in melanized neurons in human PD SNpc. (F) Quantitation of percent of melanized neurons in human PD SNpc and aged control SN that costain for both MPO and nitrated αSyn. (G, I, J) Monoclonal antibody 2D10G9 detects HOCl-modified epitopes (black, arrows) in melanized neurons (G). (H) Quantitation of neuromelanin containing neurons positive for HOCl-modified epitopes in PD SNpc versus control SNpc. (I,J) Immunostaining for MPO (red) in melanized neurons that also show positive staining for HOCl-modified epitopes using 2D10G9 (black) (arrows denote small vesicles positive for HOCl epitopes). (K) Quantitation of MPO positive neurons with HOCl epitopes in PD SNpc versus control aged SNpc. (L) Confocal image of MPO immunostaining (red, AlexaFluor 594) in neurons with tyrosine hydroxylase (green, AlexaFluor 488), a marker for dopaminergic neurons. These immunohistological studies assayed eight PD SN and eight normal control SN. In E and F, percent of immunopositive cells was determined from a minimum of three sections from each donor, spaced by five sections, with four digital images analyzed from each section. Counting of immunopositive neurons was performed by investigators blinded to PD or control status. Statistical significance in F, H, and K was determined by Student’s t test. Scale bars A (5 μm), C (10 μm), E (40 μm), G (5 μm), I (15 μm), J (10 μm), L (15 μm).

Similar articles

Cited by

References

    1. Goetz CG, McGhiey A. The movement disorder society and movement disorders: a modern history. Mov Disord. 2011;26(6):939–46. doi: 10.1002/mds.23689. - DOI - PubMed
    1. Poewe W, Seppi K, Tanner CM, Halliday GM, Brundin P, Volkmann J, et al. Parkinson disease. Nat Rev Dis Primers. 2017;3:17013. doi: 10.1038/nrdp.2017.13. - DOI - PubMed
    1. Spillantini MG, Schmidt ML, Lee VM, Trojanowski JQ, Jakes R, Goedert M. Alpha-synuclein in Lewy bodies. Nature. 1997;388(6645):839–40. doi: 10.1038/42166. - DOI - PubMed
    1. Rosborough K, Patel N, Kalia LV. alpha-Synuclein and Parkinsonism: Updates and Future Perspectives. Curr Neurol Neurosci Rep. 2017;17(4):31. doi: 10.1007/s11910-017-0737-y. - DOI - PubMed
    1. Konno T, Ross OA, Puschmann A, Dickson DW, Wszolek ZK. Autosomal dominant Parkinson’s disease caused by SNCA duplications. Parkinsonism Relat Disord. 2016;22 Suppl 1:S1–6. doi: 10.1016/j.parkreldis.2015.09.007. - DOI - PMC - PubMed

Publication types

MeSH terms