. 2019 Aug:26:5-17.
doi: 10.1016/j.molmet.2019.05.008. Epub 2019 May 18.

Global transcriptomic analysis of the arcuate nucleus following chronic glucocorticoid treatment

Affiliations

Global transcriptomic analysis of the arcuate nucleus following chronic glucocorticoid treatment

Jonathan R Wray et al. Mol Metab. 2019 Aug.

Abstract

Objective: Glucocorticoids (GCs) are widely prescribed medications that are well recognized to cause adverse metabolic effects including hyperphagia, obesity, and hyperglycemia. These effects have been recapitulated in a murine model of GC excess, and we hypothesize that they are mediated, in part, through central mechanisms. This study aimed to identify genes in the hypothalamic arcuate nucleus (ARC) that are altered with GC treatment and evaluate their contribution to GC-induced metabolic abnormalities.

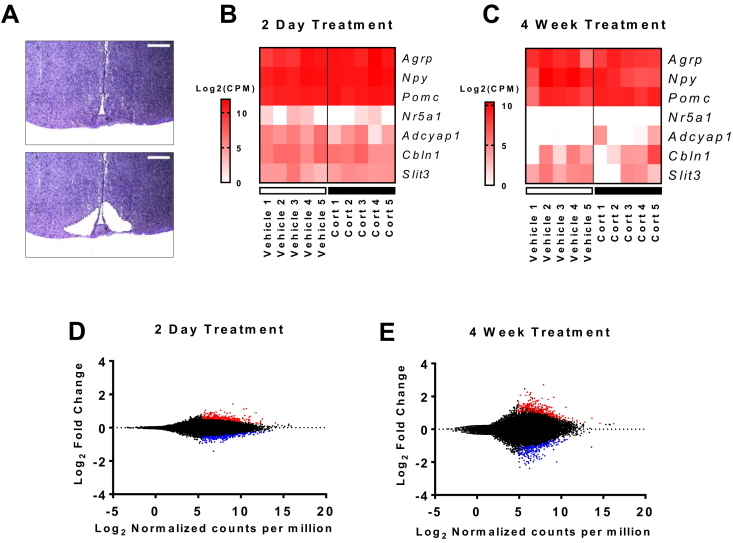
Methods: Corticosterone (Cort; 75 μg/ml) was administered in the drinking water to male C57Bl/6J mice for 2 days or 4 weeks. Phenotypic analysis of each group was undertaken and central and peripheral tissues were collected for biochemical and mRNA analyses. Arcuate nuclei were isolated by laser capture microdissection and tissue analyzed by RNA-seq.

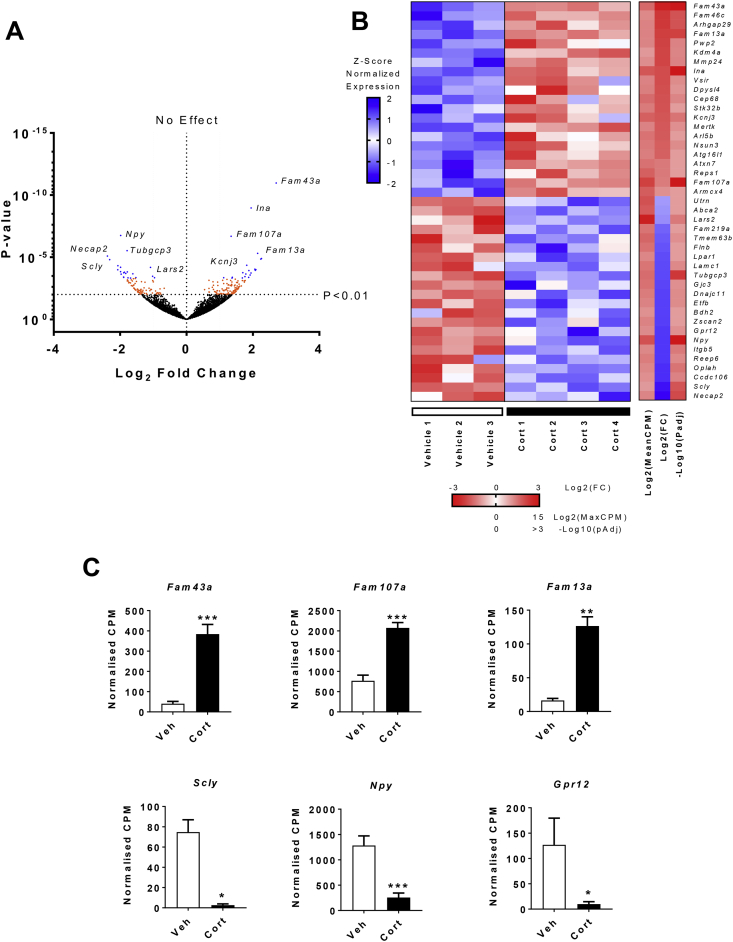
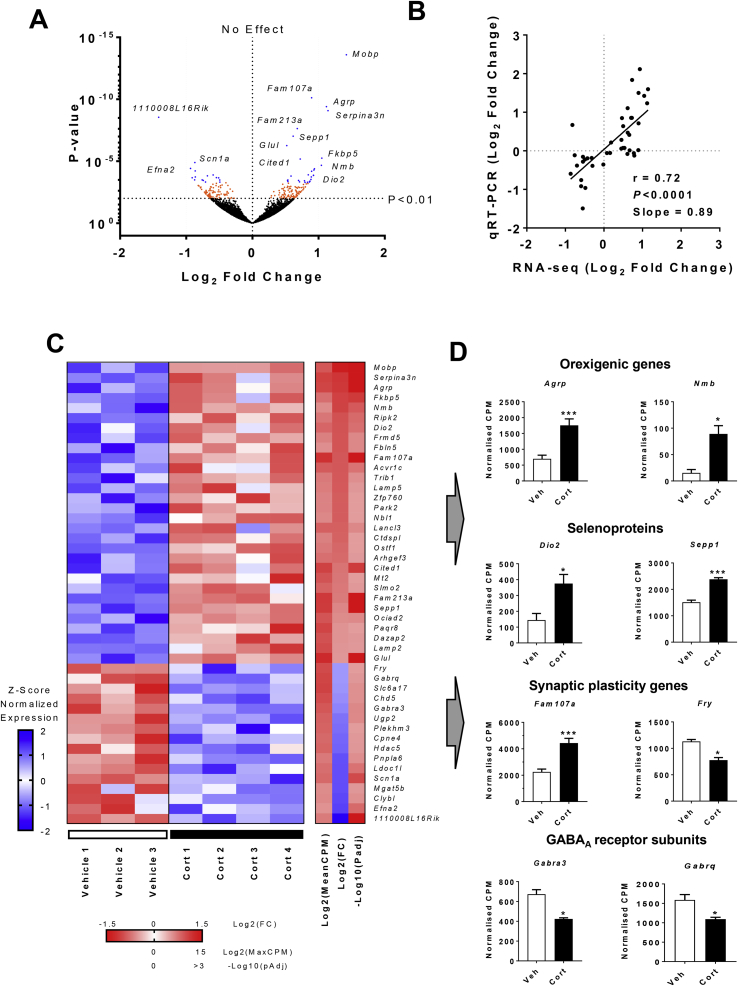
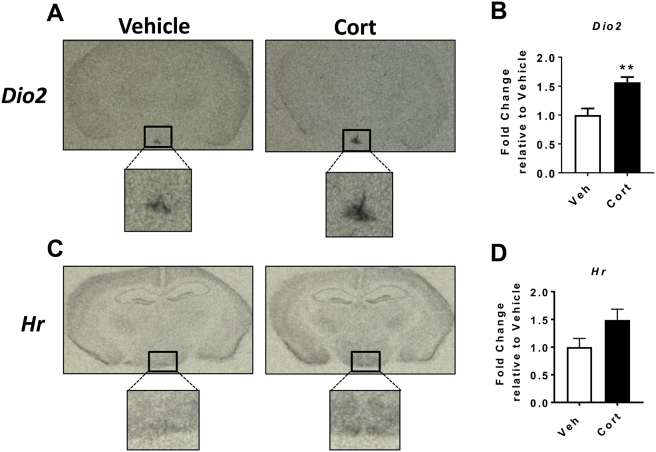
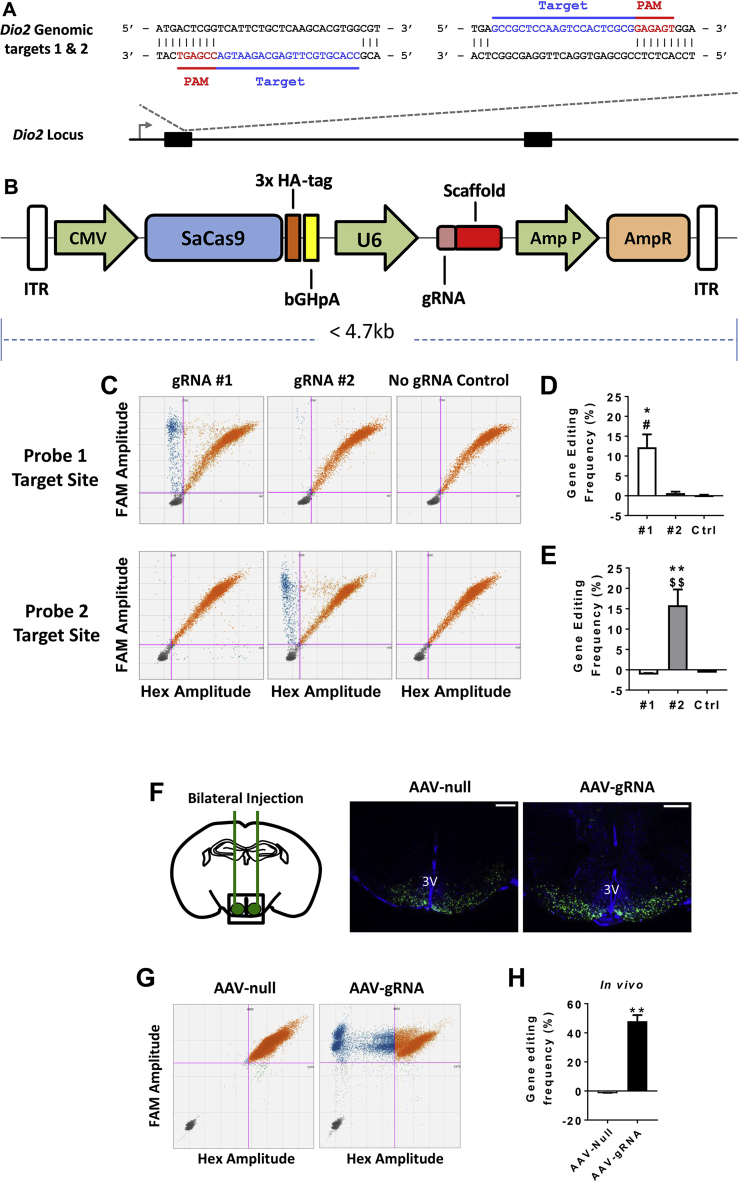
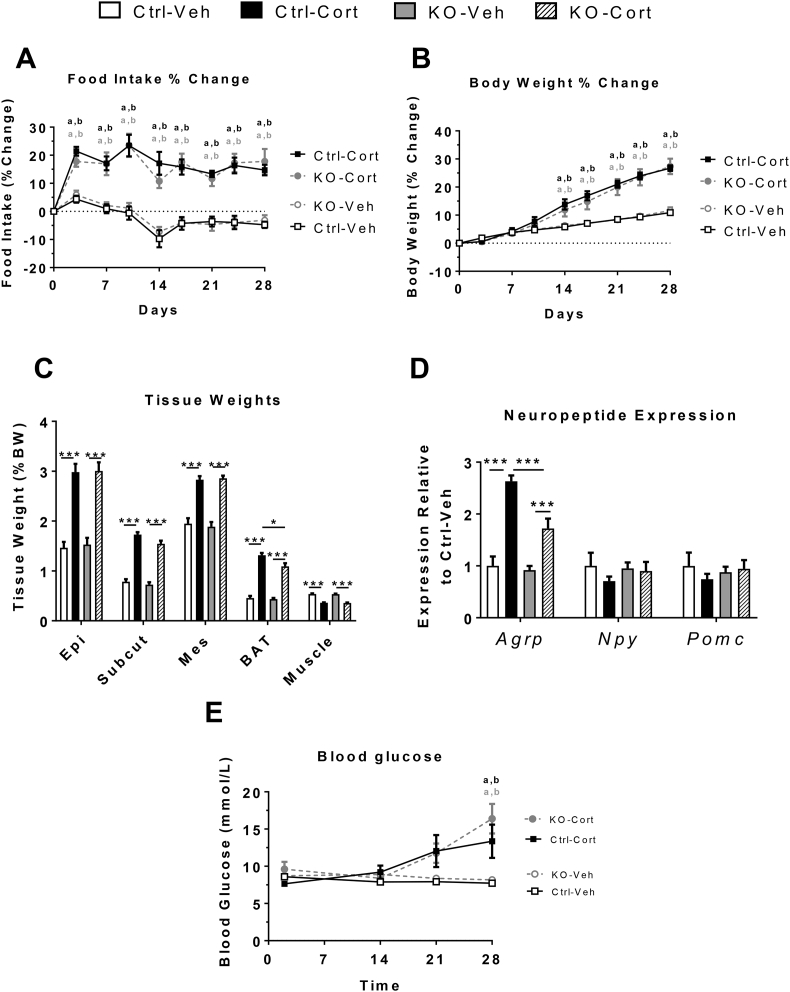
Results: RNA-seq analysis of ARC tissue from 4 week Cort treated mice revealed 21 upregulated and 22 downregulated genes at a time when mice had increased food intake, expansion of adipose tissue mass, and insulin resistance. In comparison, after 2 days Cort treatment, when the main phenotypic change was increased food intake, RNA-seq identified 30 upregulated and 16 downregulated genes. Within the genes altered at 2 days were a range of novel genes but also those known to be regulated by GCs, including Fkbp5, Mt2, Fam107a, as well as some involved in the control of energy balance, such as Agrp, Sepp1, Dio2, and Nmb. Of the candidate genes identified by RNA-seq, type-II iodothyronine deiodinase (Dio2) was chosen for further investigation as it was increased (2-fold) with Cort, and has been implicated in the control of energy balance via the modulation of hypothalamic thyroid hormone availability. Targeted knockdown of Dio2 in the MBH using AAV-mediated CRISPR-Cas9 produced a mild attenuation in GC-induced brown adipose tissue weight gain, as well as a 56% reduction in the GC-induced increase in Agrp. However, this conferred no protection from GC-induced hyperphagia, obesity, or hyperglycemia.

Conclusions: This study identified a comprehensive set of genes altered by GCs in the ARC and enabled the selection of key candidate genes. Targeted knockdown of hypothalamic Dio2 revealed that it did not mediate the chronic GC effects on hyperphagia and hyperglycemia.

Keywords: Arcuate nucleus; CRISPR-Cas9; Dio2; Glucocorticoid; RNA-Seq.


Figures

Figure 1
Figure 1
Validation of RNA-seq datasets from the arcuate nuclei of 2 day and 4 week Cort treated mice. (A) Representative hypothalamic sections stained with cresyl violet to allow visualization of hypothalamic cytoarchitecture and isolation of the ARC by laser capture microdissection. Scale bar = 300 μm. (B) Heatmap showing ARC and VMH enriched genes across all 2 day (n = 5/group) and (C) 4 week (n = 5/group) treated samples. (D) Scatter plot showing the expression and fold change of all genes in 2 day (n = 3–4/group), and (E) 4 week treated (n = 3–4/group) datasets. (D, E) Red dots, upregulated genes (P < 0.01); blue dots, downregulated genes (P < 0.01). Wald test.
Figure 2
Figure 2
Global gene expression changes in the arcuate nucleus of 4 week Cort treated mice. (A) Volcano plot of all genes found by RNA-seq. Orange (P < 0.01) and blue (Padj < 0.1) dots represent genes with significant change in expression. The position of select genes is illustrated by the gene symbol (n = 3–4/group). (B) Heatmap showing all 43 genes differentially expressed (Padj) in the ARC after 4 weeks of Cort treatment. Left panel, each row corresponds to transcripts where the expression is normalized to the mean expression on the row (Z-scaled). Right panel, the mean expression across all samples [Log2(MeanCPM)], fold change [Log2(FC)], and significance for each gene [-Log10(Padj)] (n = 3–4/group). (C) Examples of different genes altered in the ARC with Cort treatment. White bars, vehicle (Veh); black bars, 75 μg/ml corticosterone (Cort) treated (n = 3–4/group; Fam43a, Padj = 9.54e-8; Fam107a, Padj = 4.63e-4; Fam13a, Padj = 0.0073; Scly, Padj = 0.014; Npy, Padj = 1.75e-7; Gpr12, Padj = 0.071). *Padj < 0.1, **Padj < 0.01, ***Padj < 0.001. (A) Wald test, (B, C) Benjamini-Hochberg adjusted P value.
Figure 3
Figure 3
Global gene expression changes in the arcuate nucleus of 2 day Cort treated mice. (A) Volcano plot of all genes found by RNA-seq. Orange (P < 0.01) and blue (Padj < 0.1) dots represent genes with significant change in expression. The position of select genes is illustrated by the gene symbol (n = 3–4/group). (B) Biological and technical correlation between RNA-seq and qRT-PCR in 37 differentially expressed genes (RNA-seq, n = 3–4/group; qRT-PCR, n = 6–7/group). (C) Heatmap showing all 46 genes differentially expressed (Padj) in the ARC after 2 days of Cort treatment. Left panel, each row corresponds to transcripts where the expression is normalized to the mean expression on the row (Z-scaled). Right panel, the mean expression across all samples [Log2(MeanCPM)], fold change [Log2(FC)], and significance for each gene [-Log10(Padj)] (n = 3–4/group). (D) Examples of genes altered in the ARC with Cort treatment (n = 3–4/group; Agrp, Padj = 1.21e-6; Nmb, Padj = 0.016; Dio2, Padj = 0.031; Sepp1, Padj = 1.24e-4; Fam107a, Padj = 3.52e-7; Fry, Padj = 0.0995; Gabra3, Padj = 0.061; Gabrq, Padj = 0.089). White bars, vehicle (Veh); black bars, 75 μg/ml corticosterone (Cort) treated. *Padj < 0.1, **Padj < 0.01, ***Padj < 0.001. (A) Wald test, (B) Pearson's correlation, (C, D) Benjamini-Hochberg adjusted P value.
Figure 4
Figure 4
Cort treatment increases Dio2 mRNA expression in the mediobasal hypothalamus. Mice were treated with either corticosterone or vehicle in the drinking water for 2 days. (A, C) Representative autoradiographic images and (B, D) densitometric quantification of coronal brain sections incubated with riboprobes targeting Dio2 and Hr, respectively (n = 6/group; Dio2: P = 0.0022; Hr: P = 0.0931). White bars, vehicle (Veh); black bars, 75 μg/ml corticosterone (Cort) treated. **P < 0.01. (B, D) Mann–Whitney test.
Figure 5
Figure 5
Validation of AAV-gRNA for targeted disruption of Dio2 in the mediobasal hypothalamus. (A) Schematic representation of the Dio2 locus showing the location of the gRNA target sequences. Target sequence in blue, protospacer adjacent motif sequence in red. (B) Schema of the single vector AAV delivery construct containing SaCas9 and gRNA. (C)In vitro confirmation of gRNA efficiency using droplet digital PCR (ddPCR; n = 3–4/group). (D) Quantification of gRNA1 (#1) editing frequency (n = 3–4/group; F2, 7 = 9.057, P = 0.0114). (E) Quantification of gRNA2 (#2) editing efficiency (n = 3–4/group; F2, 7 = 21.62, P = 0.001). (F) Representative immunofluorescent images showing bilateral targeting of the MBH. Scale bar = 500 μm. (G) Confirmation and (H) quantification of in vivo AAV-gRNA gene editing efficiency (n = 4–6/group; P = 0.0095). All ddPCR scatter plots represent merged replicates. Reference probe, FAM; InDel + probe, Hex. Pink bars indicate manually set thresholds. Orange dots, wild type DNA; blue dots, DNA containing InDels; grey dots; empty droplets. *P < 0.05, **P < 0.01 vs Ctrl (no gRNA). #P < 0.05 vs gRNA2, $$P < 0.01 vs gRNA1, ***P < 0.001. (D, E) One-way ANOVA with Tukey's post-hoc comparison, (H) Mann–Whitney test.
Figure 6
Figure 6
Targeted knockdown of Dio2 in the MBH does not alleviate the metabolic effects of chronic Cort treatment. (A) Percent change in food intake (n = 9–14/group; time: F8, 320 = 19.39, P < 0.0001; interaction: F24, 320 = 5.466, P < 0.0001; treatment: F3, 40 = 34.52, P < 0.0001) and (B) body weight across the 4 week Cort treatment period (n = 9–14/group; time: F8, 320 = 268.6, P < 0.0001; interaction: F24, 320 = 21.23, P < 0.0001; treatment: F3, 40 = 10.52, P < 0.0001). (C) Individual adipose tissue bed and muscle weight after 4 weeks of Cort treatment (n = 8–14/group; Epi: F3, 38 = 31.22, P < 0.0001; Subcut: F3, 39 = 85.87, P < 0.0001; Mes: F3, 38 = 39.67, P < 0.0001; BAT: F3, 39 = 88.7, P < 0.0001; Muscle: F3, 39 = 1.945, P = 0.1382). (D) Expression of ARC neuropeptides in MBH micropunches after 4 weeks of Cort treatment (n = 8–14/group; Agrp: F3, 37 = 26.69, P < 0.0001; Npy: F3, 38 = 0.4874, P = 0.6931; Pomc: F3, 37 = 0.379, P = 0.7687). (E) Blood glucose measurements (n = 9–14/group; time: F3, 120 = 10.7, P < 0.0001; interaction: F9, 120 = 6.501, P < 0.0001; treatment: F3, 40 = 4.992, P = 0.0049). Epi, epididymal; Subcut, subcutaneous; Mes, mesenteric. Ctrl, AAV-Null injected; KO; AAV-gRNA injected; Veh, 1% ethanol; Cort, 75 μg/ml corticosterone. a, significance vs Ctrl-Veh; b, significance vs KO-Veh. *P < 0.05, **P < 0.01, ***P < 0.001. (A, B, E) Two-way ANOVA with Tukey's post-hoc compassion (C, D) one-way ANOVA with Tukey's post-hoc comparison.

References

    1. Overman R.A., Yeh J.-Y., Deal C.L. Prevalence of oral glucocorticoid usage in the United States: a general population perspective. Arthritis Care & Research. 2013;65(2):294–298. - PubMed
    1. van Staa T.P., Leufkens H.G., Abenhaim L., Begaud B., Zhang B., Cooper C. Use of oral corticosteroids in the United Kingdom. QJM: Monthly Journal of the Association of Physicians. 2000;93(2):105–111. - PubMed
    1. Fardet L., Petersen I., Nazareth I. Prevalence of long-term oral glucocorticoid prescriptions in the UK over the past 20 years. Rheumatology. 2011;50(11):1982–1990. - PubMed
    1. Fardet L., Flahault A., Kettaneh A., Tiev K.P., Généreau T., Tolédano C. Corticosteroid-induced clinical adverse events: frequency, risk factors and patient?s opinion. British Journal of Dermatology. 2007;157(1):142–148. - PubMed
    1. Curtis J.R., Westfall A.O., Allison J., Bijlsma J.W., Freeman A., George V. Population-based assessment of adverse events associated with long-term glucocorticoid use. Arthritis & Rheumatism. 2006;55(3):420–426. - PubMed

Publication types

MeSH terms