Comparative Study
. 2019 Jul;68(7):1195-1209.
doi: 10.1007/s00262-019-02354-4. Epub 2019 Jun 8.

Comparison of IL-2 vs IL-7/IL-15 for the generation of NY-ESO-1-specific T cells

Affiliations
Comparative Study

Comparison of IL-2 vs IL-7/IL-15 for the generation of NY-ESO-1-specific T cells

Wenjie Gong et al. Cancer Immunol Immunother. 2019 Jul.

Abstract

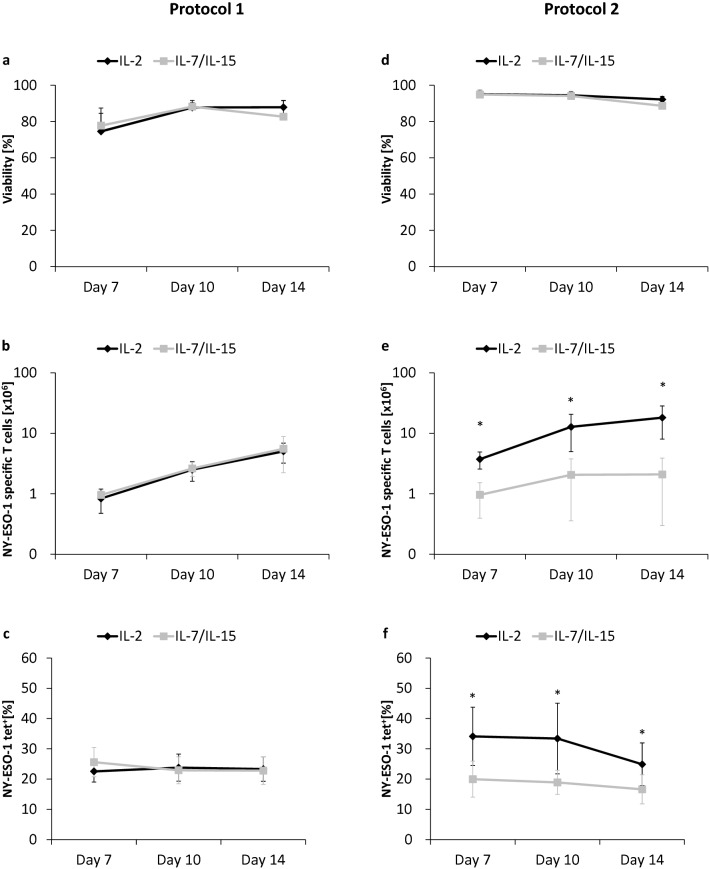
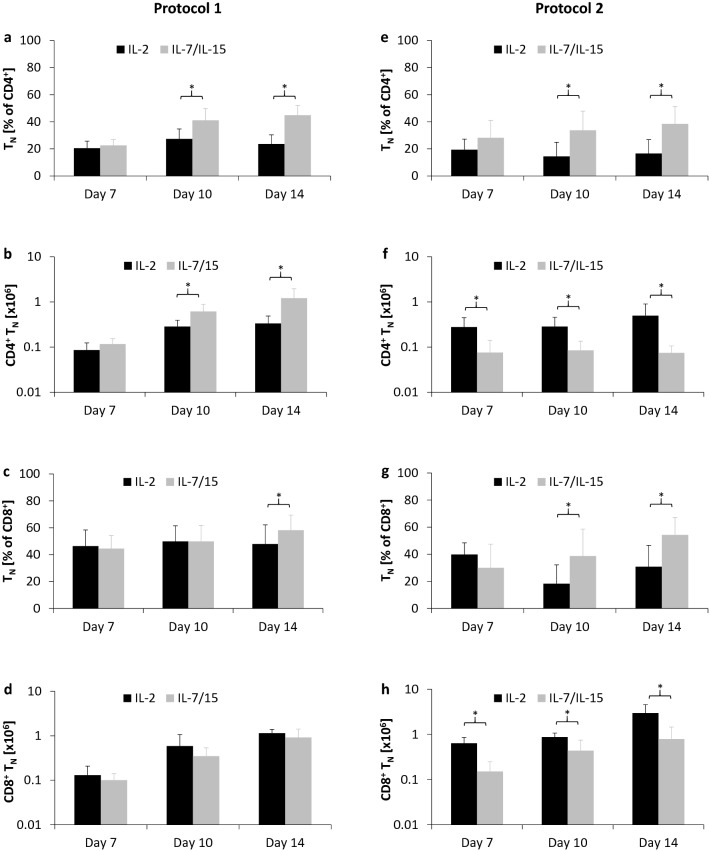
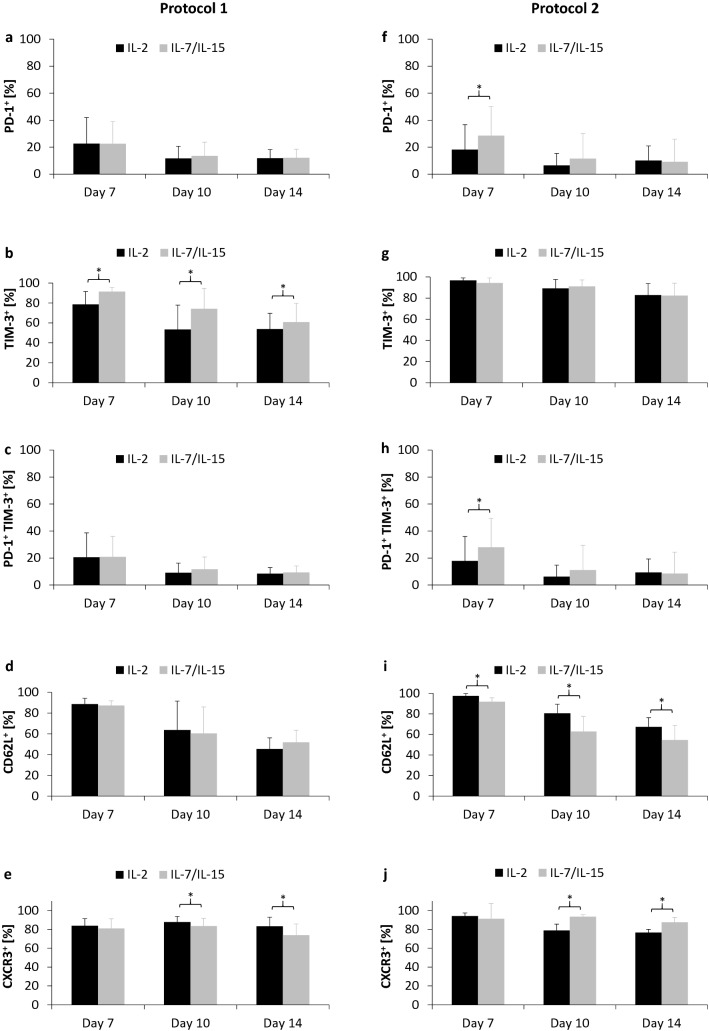
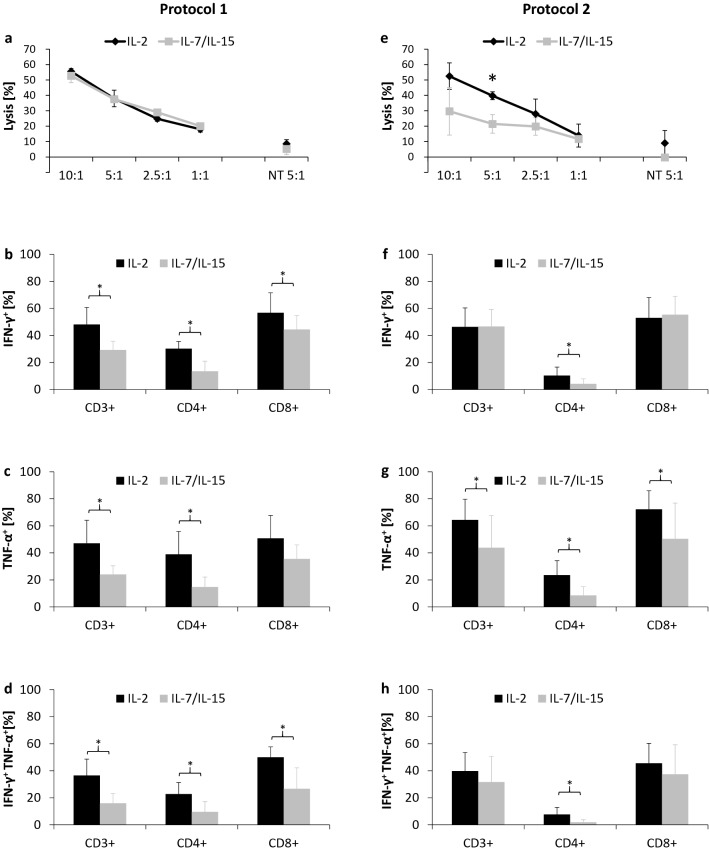
The anti-tumor efficacy of TCR-engineered T cells in vivo depends largely on less-differentiated subsets such as T cells with naïve-like T cell (TN) phenotypes with greater expansion and long-term persistence. To increase these subsets, we compared the generation of New York esophageal squamous cell carcinoma-1 (NY-ESO-1)-specific T cells under supplementation with either IL-2 or IL-7/IL-15. PBMCs were transduced with MS3II-NY-ESO-1-siTCR retroviral vector. T cell generation was adapted from a CD19-specific CART cell production protocol. Comparable results in viability, expansion and transduction efficiency of T cells under stimulation with either IL-2 or IL-7/IL-15 were observed. IL-7/IL-15 led to an increase of CD4+ T cells and a decrease of CD8+ T cells, enriched the amount of TN among CD4+ T cells but not among CD8+ T cells. In a 51Cr release assay, similar specific lysis of NY-ESO-1-positive SW982 sarcoma cells was achieved. However, intracellular cytokine staining revealed a significantly increased production of IFN-γ and TNF-α in T cells generated by IL-2 stimulation. To validate these unexpected findings, NY-ESO-1-specific T cell production was evaluated in another protocol originally established for TCR-engineered T cells. IL-7/IL-15 increased the proportion of TN. However, the absolute number of TN did not increase due to a significantly slower expansion of T cells with IL-7/IL-15. In conclusion, IL-7/IL-15 does not seem to be superior to IL-2 for the generation of NY-ESO-1-specific T cells. This is in sharp contrast to the observations in CD19-specific CART cells. Changes of cytokine cocktails should be carefully evaluated for individual vector systems.

Keywords: Adoptive T cell transfer; Interleukin; NY-ESO-1; T cell receptor.


Conflict of interest statement

The authors declare that there are no conflicts of interest.

Figures

Fig. 1
Fig. 1
Culture conditions and main procedures of two different protocols for the generation of NY-ESO-1-specific T cells. Major differences are displayed for culture conditions (a) and time schedule (b) according to protocol 1 and protocol 2. P1 protocol 1, P2 protocol 2, CM culture medium
Fig. 2
Fig. 2
Viability, expansion, and transduction efficiency. The figure shows results for protocol 1 (ac; n = 7) and for protocol 2 (df; n = 7) with either IL-2 (black lines) or IL-7/IL-15 (gray lines). Viability (a, d), cell expansion (b, e) and transduction efficiency (c, f) were assessed on days 7, 10, and 14 of T cell culture. Mean values were calculated for each group. Error bars indicate standard deviation. Statistical significance was calculated using a paired two-way student t test. Significance (p values < 0.05) is indicated by an asterisk (*)
Fig. 3
Fig. 3
Distribution of different NY-ESO-1-specific T cell subsets. Evolution of CD3+/CD4+ (solid lines) and CD3+/CD8+ (dashed lines) NY-ESO-1-specific T cells (n = 7) was assessed on days 7, 10, and 14 of T cell culture following protocol 1 and 2 (a, c). NY-ESO-1-specific T cell subsets were defined by CCR7 and CD45RA expression (n = 7). TN were defined as CD45RA+CCR7+, TCM as CD45RACCR7+, TEM as CD45RACCR7, and TE as CD45RA+CCR7 T cells. Differences in the proportion of TN (dark black block), TCM (light gray block), TEM (dark gray block) and TE (light black block) were compared between IL-2 and IL-7/IL-15-based T cell culture using protocol 1 and 2 (b, d). Mean values were calculated for each group. Error bars indicate standard deviation. Statistical significance was calculated using a paired two-way student t test. Significance (p values < 0.05) is indicated by an asterisk (*)
Fig. 4
Fig. 4
Relative distribution and absolute number of TN. Differences in the amount of NY-ESO-1-specific TN (n = 7) were compared for different culture conditions containing IL-2 (black bars) or IL-7/IL-15 (gray bars) for CD3+/CD4+ (%, a, e; absolute number, b, f) and CD3+/CD8+ (%, c, g; absolute number, d, h) T cells. Mean values were calculated for each group. Error bars indicate standard deviation. Statistical significance was calculated using a paired two-way student t test. Significance (p values < 0.05) is indicated by an asterisk (*)
Fig. 5
Fig. 5
Exhaustion and homing markers of NY-ESO-1-specific T cells. NY-ESO-1-specific T cells (n = 7) cultured in media supplemented with either IL-2 (black bars) or IL-7/IL-15 (gray bars) were compared for expression of exhaustion and homing markers. The exhaustion markers PD-1 (a, f) and TIM-3 (b, g), co-expression of PD-1 and TIM-3 (c, h) as well as expression of the homing markers CD62L (d, i) and CXCR3 (e, j) were assessed on days 7, 10, and 14. Mean values were calculated for each group. Error bars indicate standard deviation. Statistical significance was calculated using a paired two-way student t test. Significance (p values < 0.05) is indicated by an asterisk (*)
Fig. 6
Fig. 6
Functional evaluation of NY-ESO-1-specific T cells. Cytotoxicity of NY-ESO-1-specific T cells (n = 3) was evaluated by 51Cr release assay after co-culture with SW982 target cells (HLA-A2-positive NY-ESO-1-positive) for 12 h. Average lysis was assessed at different effector (NY-ESO-1-specific T cells) to target (SW982 cells) ratios (10:1, 5:1, 2.5:1, and 1:1). Non-transduced T cells and SW982 cells at a ratio of 5:1 were used as control. Each experiment was performed in triplicate (a, e). Intracellular production of IFN-γ and TNF-α (protocol 1: n = 4, protocol 2: n = 7) was measured after stimulation with SW982 cells for 6 h. Overall IFN-γ (b, f) and TNF-α production (c, g) as well as multifunctional NY-ESO-1-specific T cells producing both TNF-α and IFN-γ (d, h) were determined in CD3+, CD3+/CD4+, and CD3+/CD8+ cells. Mean values were calculated for each group. Error bars indicate standard deviation. Statistical significance was calculated using a paired two-way student t test. Significance (p values < 0.05) is indicated by an asterisk (*). NT non-transduced T cells

References

    1. Rosenberg SA, Restifo NP. Adoptive cell transfer as personalized immunotherapy for human cancer. Science. 2015;348(6230):62–68. doi: 10.1126/science.aaa4967. - DOI - PMC - PubMed
    1. Kunert A, Straetemans T, Govers C, Lamers C, Mathijssen R, Sleijfer S, Debets R. TCR-engineered T cells meet new challenges to treat solid tumors: choice of antigen, T cell fitness, and sensitization of tumor milieu. Front Immunol. 2013;4:363. doi: 10.3389/fimmu.2013.00363. - DOI - PMC - PubMed
    1. Park TS, Groh EM, Patel K, Kerkar SP, Lee CC, Rosenberg SA. Expression of MAGE-A and NY-ESO-1 in primary and metastatic cancers. J Immunother. 2016;39(1):1–7. doi: 10.1097/CJI.0000000000000101. - DOI - PMC - PubMed
    1. Barrow C, Browning J, MacGregor D, Davis ID, Sturrock S, Jungbluth AA, Cebon J. Tumor antigen expression in melanoma varies according to antigen and stage. Clin Cancer Res. 2006;12(3 Pt 1):764–771. doi: 10.1158/1078-0432.CCR-05-1544. - DOI - PubMed
    1. Endo M, de Graaff MA, Ingram DR, Lim S, Lev DC, Briaire-de Bruijn IH, Somaiah N, Bovee JV, Lazar AJ, Nielsen TO. NY-ESO-1 (CTAG1B) expression in mesenchymal tumors. Mod Pathol. 2015;28(4):587–595. doi: 10.1038/modpathol.2014.155. - DOI - PubMed

Publication types

MeSH terms