. 2020 Mar;16(3):419-434.
doi: 10.1080/15548627.2019.1628520. Epub 2019 Jun 16.

PHB2 (prohibitin 2) promotes PINK1-PRKN/Parkin-dependent mitophagy by the PARL-PGAM5-PINK1 axis

Affiliations

PHB2 (prohibitin 2) promotes PINK1-PRKN/Parkin-dependent mitophagy by the PARL-PGAM5-PINK1 axis

Chaojun Yan et al. Autophagy. 2020 Mar.

Abstract

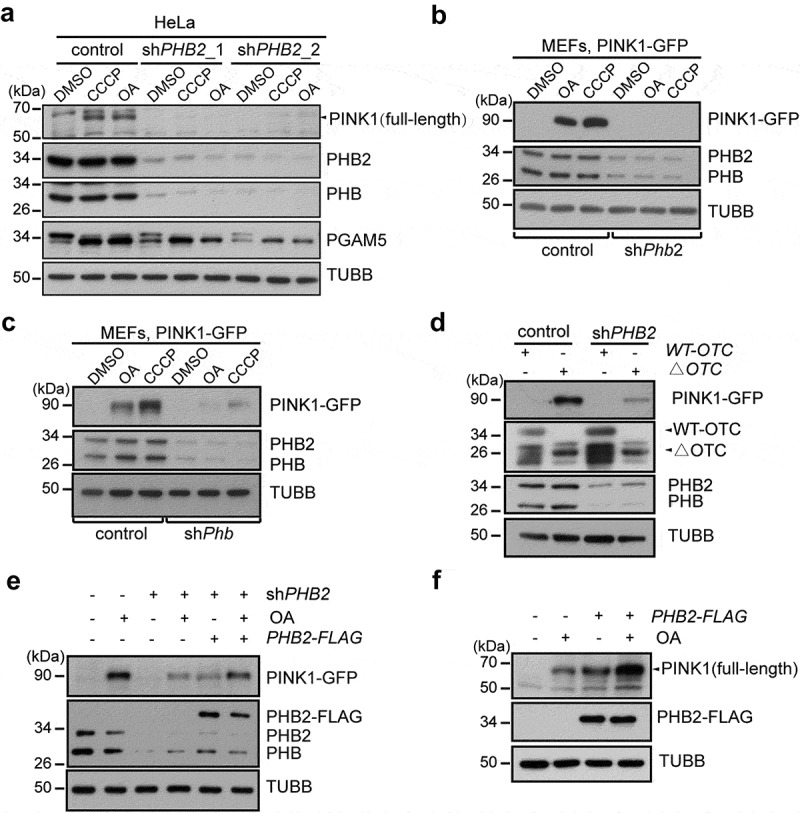
Mitophagy, which is a conserved cellular process for selectively removing damaged or unwanted mitochondria, is critical for mitochondrial quality control and the maintenance of normal cellular physiology. However, the precise mechanisms underlying mitophagy remain largely unknown. Prior studies on mitophagy focused on the events in the mitochondrial outer membrane. PHB2 (prohibitin 2), which is a highly conserved membrane scaffold protein, was recently identified as a novel inner membrane mitophagy receptor that mediates mitophagy. Here, we report a new signaling pathway for PHB2-mediated mitophagy. Upon mitochondrial membrane depolarization or misfolded protein aggregation, PHB2 depletion destabilizes PINK1 in the mitochondria, which blocks the mitochondrial recruitment of PRKN/Parkin, ubiquitin and OPTN (optineurin), leading to an inhibition of mitophagy. In addition, PHB2 overexpression directly induces PRKN recruitment to the mitochondria. Moreover, PHB2-mediated mitophagy is dependent on the mitochondrial inner membrane protease PARL, which interacts with PHB2 and is activated upon PHB2 depletion. Furthermore, PGAM5, which is processed by PARL, participates in PHB2-mediated PINK1 stabilization. Finally, a ligand of PHB proteins that we synthesized, called FL3, was found to strongly inhibit PHB2-mediated mitophagy and to effectively block cancer cell growth and energy production at nanomolar concentrations. Thus, our findings reveal that the PHB2-PARL-PGAM5-PINK1 axis is a novel pathway of PHB2-mediated mitophagy and that targeting PHB2 with the chemical compound FL3 is a promising strategy for cancer therapy.Abbreviations: AIFM1: apoptosis inducing factor mitochondria associated 1; ATP5F1A/ATP5A1: ATP synthase F1 subunit alpha; BAF: bafilomycin A1; CALCOCO2/NDP52: calcium binding and coiled-coil domain 2; CCCP: chemical reagent carbonyl cyanide m-chlorophenyl hydrazine; FL3: flavaglines compound 3; HSPD1/HSP60: heat shock protein family D (Hsp60) member 1; LC3B/MAP1LC3B: microtubule associated protein 1 light chain 3 beta; MEF: mouse embryo fibroblasts; MPP: mitochondrial-processing peptidase; MT-CO2/COX2: mitochondrially encoded cytochrome c oxidase II; MTS: mitochondrial targeting sequence; OA: oligomycin and antimycin A; OPTN: optineurin; OTC: ornithine carbamoyltransferase; PARL: presenilin associated rhomboid like; PBS: phosphate-buffered saline; PGAM5: PGAM family member 5, mitochondrial serine/threonine protein phosphatase; PHB: prohibitin; PHB2: prohibitin 2; PINK1: PTEN induced kinase 1; PRKN/Parkin: parkin RBR E3 ubiquitin protein ligase; Roc-A: rocaglamide A; TOMM20: translocase of outer mitochondrial membrane 20; TUBB: tubulin beta class I.

Keywords: Mitophagy; PARL; PGAM5; PHB2; PINK1-PRKN.


Figures

Figure 1.
Figure 1.
PHB2 controls PINK1-PRKN-mediated mitophagy. (a) HeLa cells stably co-expressing FLAG-PRKN and mito-Keima were infected with control (scrambled shRNA) or shPHB2 lentiviral particles. Four days later, cells were treated with OA (10 mM oligomycin plus 4 mM antimycin-A) or DMSO for 16 h. Intracellular mito-Keima excited at 448 nm (measuring mitochondria with a neutral pH) was shown in green color, while red color indicated the mito-Keima fluorescence excited at 552 nm (measuring mitochondria with an acidic pH) in the same cell. (b) Quantification of the relative ratio of fluorescence intensity (552 nm:448 nm) of the cells described in (a). Student’s t-test was used to determine p-values, ***p < 0.001. (c) HeLa cells with or without GFP-PRKN expression were transfected with control, PHB2-FLAG or PHB2[mLIR]-FLAG for 72 h, then immunostained with anti-HSPD1, anti-FLAG antibodies, and visualized by confocal microscopy. (d) Quantification of the percentage of decreased HSPD1 cells as described in (c). All data represent the means ± SD of 3 independent experiments (100 cells per independent experiment). Statistical significance was assessed by student’s t-test, *p < 0.05, **p < 0.01 versus control. (e) HeLa cells stably expressing GFP-PRKN were co-transfected with mitochondrial-targeted Red (mito-Red) and control, PHB2-FLAG or PHB2[mLIR]-FLAG. 24 h later, cells were incubated with bafilomycin A1 (BAF, 1 μM) for 6 h, and then immunostained with anti-MAP1LC3B, anti-FLAG antibodies, and visualized by confocal microscopy (right panels). Left panels showed the pixel intensity of mito-Red and MAP1LC3B from a line.
Figure 2.
Figure 2.
PHB2 regulates the mitochondrial recruitment of PRKN. (a) HeLa cells stably expressing GFP-PRKN were infected with control or shPHB2, treated with DMSO, CCCP (10 μM) or OA for 1 h, and then immunostained with an anti-TOMM20 antibody and DAPI, and analyzed by confocal microscopy. (b) Quantification of colocalization between PRKN and mitochondria in cells described in (a). (c-d) Control or shPHB2 HeLa cells stably expressing GFP-PRKN were transiently transfected with WT-OTC or △OTC. Cells were immunostained 48 h later with anti-OTC and anti-HSPD1 antibodies, and then imaged by confocal microscopy (c). Quantification of the mitochondrial PRKN-positive cells is shown in (d). (e) HeLa cells expressing GFP-PRKN were infected with control or shPHB2 lentiviral particles. Five days later, cells were treated with OA for 2 h, and then immunostained with anti-TOMM20 and anti-Ubiquitin antibodies. Cells were then visualized by confocal microscopy. (f) Quantification of the mitochondrial ubiquitin-positive cells described in (e). (g-h) HeLa cells expressing GFP-PRKN were treated with OA for 2 h, and immunostained with anti-OPTN and anti-TOMM20 antibodies. Cells were then assessed by confocal microscopy. Quantification of the mitochondrial OPTN-positive cells is shown in (h). Results shown were representative of at least 3 independent experiments. Error bars represent the mean ±SD (n = 3, 100 cells per independent experiment), Statistical significance was assessed by student’s t-test, *p < 0.05, **p < 0.01, ***p < 0.001.
Figure 3.
Figure 3.
PHB2 stabilizes PINK1 in mitochondria. (a) HeLa cells were infected with control, shPHB2_1 or shPHB2_2 lentiviral particles, and cultured for 5 days. Cells were then incubated with OA or CCCP for 2 h. Cell lysates were analyzed by western blotting with antibodies against PINK1, PGAM5, PHB2, PHB, or TUBB/β-Tubulin. The black arrowhead indicates the full-length PINK1. (b-c) Control, shPhb2 (b), or shPhb (c) MEFs stably expressing PINK1-GFP were treated with CCCP (10 μM) or OA for 3 h. Cell lysates were subjected to western blotting using the indicated antibodies. (d) HeLa cells expressing PINK1-GFP were infected with control or shPHB2 lentiviral particles, 4 days later, cells were then transiently transfected with WT-OCT or ΔOTC for additional 3 days. Cells lysates were analyzed by western blotting with the indicated antibodies. The black arrowheads pointed to the indicated protein. (e) HeLa cells expressing PINK1-GFP were infected with control or shPHB2 lentiviral particles, 4 days later, cells were transiently transfected with empty vector (control) or PHB2-FLAG (2 nucleotides of PHB2 cDNA in shPHB2 target sequence were mutated, but PHB2 amino acids remain unchanged) for an additional 2 days, and then the cells were treated with OA for 2 h. Cells lysates were analyzed by western blotting with the indicated antibodies. (f) HeLa cells were transiently transfected with control (empty vector) or PHB2-FLAG. Cells were treated 48 h later with or without OA for 3 h, and then cell lysates were analyzed by western blotting using the indicated antibodies.
Figure 4.
Figure 4.
PHB2[mLIR] mutant also induce mitophagy. (a) HeLa cells expressing GFP-PRKN were transiently transfected with control (empty vector) or PHB2[mLIR]-FLAG. After 24 h transfection, cells were immunostained with anti-TOMM20 and anti-FLAG antibodies, and then analyzed and imaged by confocal microscopy. (b) Quantification of the mitochondrial PRKN-positive cells described in (a). Error bars represent the mean ±SD (n = 3, 100 cells per independent experiment), statistical significance was assessed by student’s t-test, ***p < 0.001. (c) Control or shPHB2 HeLa cells stably expressing PINK1-GFP were transiently transfected with control (empty vector) or PHB2[mLIR]-FLAG. After 48 h transfection, cells were treated with or without OA for 2 h, cell lysates were then analyzed by western blotting using antibodies against GFP, PHB, PHB2, or TUBB/β-Tubulin. (d) HeLa cells were transiently transfected with control (empty vector) or PHB2[mLIR]-FLAG. 48 h later, cells were treated with or without OA for 3 h, cells lysates were analyzed by western blotting with the indicated antibodies. (e) MEFs expressing GFP-PRKN cells were infected with lentiviral particles containing control and shPhb2. Four days later, cells were transiently transfected control (empty vector), PHB2-FLAG, or PHB2[mLIR]-FLAG for an additional 2 days, then treated with or without OA for 2 h, and immunostained with the indicated antibodies. Cells were visualized and imaged by confocal microscopy.
Figure 5.
Figure 5.
PHB2 regulates PARL activity. (a-b) HCT116 Wild type (WT) or parl KO cells were infected by lentiviral particles containing control or shPHB2, and further cultured for 5 days. Cells were then treated with DMSO, CCCP or OA for 3 h. Cell lysates were examined by western blotting using the indicated antibodies (a). The black arrowhead indicated the full-length PINK1 and red arrowhead point to the band of PINK1 with MTS deleted after MPP cleaved. The asterisk indicated a nonspecific band. The relative protein levels were evaluated by densitometry analysis using ImageJ software and were quantified for the ratio of PINK1:TUBB/β-Tubulin (b). Error bars indicate the mean ±SD of 3 independent experiments, ***p < 0.001, n.s indicates none significance. (c) HCT116 WT and parl KO cells were infected with control and shPHB2 contained lentiviral particles. Five days after infection, cells were treated with or without CCCP for 4 h, and then harvested for the isolation of mitochondria. Mitochondria were lysed and analyzed by western blotting with the indicated antibodies. The asterisk indicates a nonspecific band. HSPD1 served as mitochondrial loading control. (d) Densitometric quantification of PARL:HSPD1 in (c). Error bars indicate the mean ±SD of 3 independent experiments, **p < 0.01. (E) HCT116 parl KO cells stably expressing PARL-FLAG were infected with control and shPHB2 contained lentiviral particles. Five days after infection, cells were treated with or without CCCP (10 μM) for 2 h. Cell lysates were analyzed by western blotting with anti-FLAG, anti-PHB, anti-PHB2, anti-PGAM5 or anti-TUBB antibodies. (f) Densitometric quantification of PARL-FLAG:TUBB in (e). Error bars indicate the mean ±SD of three independent experiments, **p < 0.01. (g) HCT116 parl KO cells complemented with PARL-FLAG were infected with control or shPHB2 contained lentiviral particles. 5 days after infection, cells were treated with fresh Cycloheximide (CHX, 50 μg/ml) for the indicated time. Cell lysates were analyzed by western blotting with anti-FLAG, anti-PHB, anti-PHB2, or anti-TUBB antibodies. (h) HCT116 parl KO cells or parl KO cells stably expressing PARL-FLAG were treated with or without CCCP for 2 h; cell lysates were then immunoprecipitated with anti-FLAG M2 affinity gel, followed by western blotting using anti-FLAG, anti-PHB, or anti-PHB2 antibodies.
Figure 6.
Figure 6.
The PARL-PGAM5 axis is involved in PHB2-mediated PINK1 stabilization. (a) HeLa cells were transfected with negative control (NC) or siRNA against PGAM5 for 72 h, and then treated with OA for 2 h. Cell lysates were analyzed by western blotting with the antibodies against PINK1, PGAM5, or TUBB. (b) HeLa cells stably expressing PINK1-GFP were transiently transfected with control (empty vector) or PGAM5-MYC. Cells were treated 48 h later with or without OA for 2 h. Then cell lysates were analyzed by western blotting with anti-GFP, anti-MYC, or anti-TUBB antibodies. (c) 293T cells were transiently co-transfected with PGAM5-MYC and PINK1-GFP. Cells were then harvested 48 h later for the isolation of mitochondria. Mitochondria were treated with the indicated doses of proteinase K for 30 min on the ice and then were analyzed by western blotting with anti-GFP, anti-MYC, anti-TOMM20, or anti-TIMM23 antibodies. (d) 293T cells were transiently co-transfected with control (empty vector) and PINK1-GFP, or PGAM5-MYC and PINK1-GFP. Cells were treated 48 h later with CCCP (10 μM) for 4 h. Cell lysates were used for immunoprecipitation with Dynabeads Protein G pre-coupled with anti-MYC antibody at 4°C overnight, followed by western blotting with anti-GFP or anti-MYC antibodies. (e) 293T cells were transiently transfected with control (empty vector) or PGAM5-MYC for 48 h, and then treated with CCCP for 4 h. Cells lysates were used for immunoprecipitation with anti-MYC antibody coupled Dynabeads Protein G at 4°C overnight, followed by western blotting using anti-PHB, anti-PHB2, or anti-MYC antibodies. (f) 293 cells were treated with or without CCCP for 4 h. Cells lysates were used for immunoprecipitation with Dynabeads Protein G coupled with anti-PHB2 antibody at 4°C overnight, followed by western blotting with the indicated antibodies. (g) 293T cells were transiently transfected with empty vector or plasmids coding for PHB2-FLAG and PGAM5-MYC for 48 h, and then treated with CCCP (10 μM) for the indicated time. Cells lysates were used for immunoprecipitation with anti-FLAG M2 affinity gel at 4°C overnight. Immunoprecipitates and cells lysates were analyzed by western blotting with anti-FLAG, anti-MYC, or anti-PARL antibodies. (h-i) HeLa cells expressing PINK1-GFP were transfected with control (empty vector), PGAM5-MYC, or MTS (AIFM1)-S-PGAM5-MYC for 48 h, and then treated with OA for 2 h. Cell lysates were analyzed by western blotting with anti-GFP, anti-MYC, or anti-TUBB antibodies. (i) Quantification of the ratio between full-length PINK1-GFP and cleaved-PINK1-GFP. Error bars indicate the mean ±SD of 3 independent experiments, **p < 0.01.
Figure 7.
Figure 7.
FL3 inhibits PINK1-PRKN mediated mitophagy by targeting PHBs. (a) HeLa cells expressing GFP-PRKN were treated with DMSO, CCCP (10 μM), OA for the indicated time periods, or treated with FL3 (50 nM) prior 24 h and then incubated with DMSO, CCCP, or OA for the indicated time periods. Cells were then immunostained with anti-TOMM20 and anti-HSPD1 antibodies, and analyzed by confocal microscopy. (b-c) Quantification of TOMM20 (b) or HSPD1 (c) puncta in cells described in (A). Error bars represent the mean ±SD (n = 3, 100 cells per independent experiment), *p < 0.05, **p < 0.01, ***p < 0.001. (D) HeLa cells expressing GFP-PRKN were pre-treated without or with FL3 (50 nM) for 24 h, and then were incubated with CCCP (10 μM) or OA for the indicated time periods. Cell lysates were subjected to western blotting using the indicated antibodies. (TOMM20, mitochondrial out membrane; MT-CO2, mitochondrial inner membrane; ATP5F1A and HSPD1, mitochondrial matrix). (e) HeLa cells expressing GFP-PRKN were pre-treated with FL3 (50 nM) for 24 h, and then were incubated with CCCP or OA for 1 h. Cells were stained with DAPI and immunostained with anti-TOMM20 antibody, and then visualized and imaged by confocal microscopy. (f) Quantification of mitochondrial PRKN-positive cells described in (e). Error bars represent the mean ±SD (n = 3, 100 cells per independent experiment), statistical significance was assessed by student’s t-test, ***p < 0.001. (g) HeLa cells stably expressing PINK1-GFP were pre-treated with or without FL3 (50 nM) for 24 h, then treated with CCCP for the indicated time periods. Cell lysates were analyzed by western blotting using antibodies against GFP or anti-TUBB. (h) parl KO HCT116 cells stably expressing PARL-FLAG were treated with DMSO, FL3 (50 nM) or Roc-A (50 nM) for 24 h. Cell lysates were then analyzed by western blotting with anti-FLAG, anti-PHB or anti-PHB2 antibodies. (i) parl KO HCT116 cells expressing PARL-FLAG were treated with DMSO, FL3 (50 nM) or RocA (50 nM) for 24 h, and then incubated with or without CCCP for 4 h. Cell lysates were immunoprecipitated with IgG (control) or anti-FLAG M2 affinity gel, the input and IP protein samples were analyzed by western blotting with anti-FLAG, anti-PHB or anti-PHB2 antibodies.
Figure 8.
Figure 8.
Model of a novel signal pathway for PHB2-mediated mitophagy. (a) PHBs interacts with PARL and regulates its protease proteolytic activity. Upon mitochondria depolarization or damage, PHBs binds to PARL to protect PGAM5 from cleavage. Full-length PINK1 protected by PGAM5 moves to OMM and then recruits PRKN to mitochondria. Mitochondrial outer membrane proteins are then ubiquitinated and degraded by the proteasome, resulting in mitochondrial OMM rupture. Then, exposed PHB2 is thus detected by MAP1LC3B in phagophores to initiate mitophagy. OMM, outer mitochondrial membrane; IMS, inner membrane space; IMM, inner mitochondrial membrane; ΔOTC, the mitochondrial-localized mutant ornithine carbamoyltransferase. (b) The depletion of PHBs promotes PARL proteolytic activity and the cleavage of its substrate, PGAM5. Without the help of full-length PGAM5 in the insertion of PINK1 to OMM, PINK1 imports into IMM and gets cleaved and degraded. Therefore, PINK1-PRKN-mediated mitophagy is inhibited.

References

    1. Singh R, Cuervo AM.. Autophagy in the cellular energetic balance. Cell Metab. 2011. May 4;13(5):495–504. PubMed PMID: 21531332; PubMed Central PMCID: PMC3099265. - PMC - PubMed
    1. Georgakopoulos ND, Wells G, Campanella M.. The pharmacological regulation of cellular mitophagy. Nat Chem Biol. 2017. January 19;13(2):136–146. PubMed PMID: 28103219. - PubMed
    1. Tatsuta T, Langer T. Quality control of mitochondria: protection against neurodegeneration and ageing. Embo J. 2008. January 23;27(2):306–314. PubMed PMID: 18216873; PubMed Central PMCID: PMCPmc2234350. eng. . - PMC - PubMed
    1. Youle RJ, Narendra DP. Mechanisms of mitophagy. Nat Rev Mol Cell Biol. 2011. January;12(1):9–14. PubMed PMID: 21179058; PubMed Central PMCID: PMCPMC4780047. eng. - PMC - PubMed
    1. Redmann M, Dodson M, Boyer-Guittaut M, et al. Mitophagy mechanisms and role in human diseases. Int J Biochem Cell Biol. 2014. August;53:127–133. PubMed PMID: 24842106; PubMed Central PMCID: PMC4111979. - PMC - PubMed

Publication types