. 2019 Jun 17;29(12):2083-2090.e4.
doi: 10.1016/j.cub.2019.05.034. Epub 2019 Jun 6.

Retrosplenial Cortical Representations of Space and Future Goal Locations Develop with Learning

Affiliations

Retrosplenial Cortical Representations of Space and Future Goal Locations Develop with Learning

Adam M P Miller et al. Curr Biol. .

Abstract

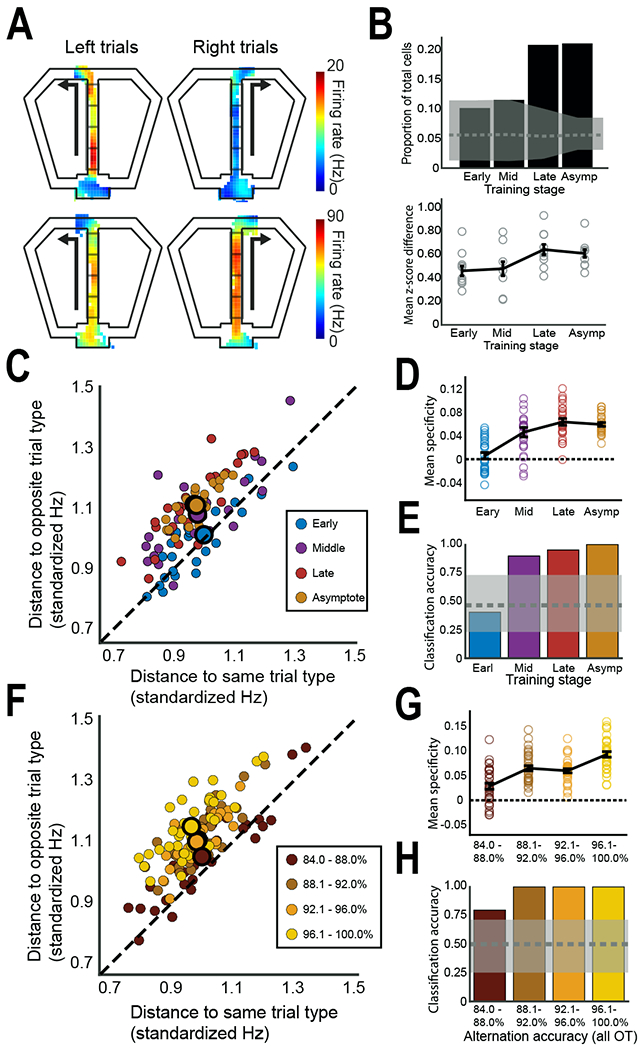
Recent findings suggest that long-term spatial and contextual memories depend on the retrosplenial cortex (RSC) [1-5]. RSC damage impairs navigation in humans and rodents [6-8], and the RSC is closely interconnected with brain regions known to play a role in navigation, including the hippocampus and anterior thalamus [9, 10]. Navigation-related neural activity is seen in humans [11] and rodents, including spatially localized firing [12, 13], directional firing [12, 14, 15], and responses to navigational cues [16]. RSC neuronal activity is modulated by allocentric, egocentric, and route-centered spatial reference frames [17, 18], consistent with an RSC role in integrating different kinds of navigational information [19]. However, the relationship between RSC firing patterns and spatial memory remains largely unexplored, as previous physiology studies have not employed behavioral tasks with a clear memory demand. To address this, we trained rats on a continuous T-maze alternation task and examined RSC firing patterns throughout learning. We found that the RSC developed a distributed population-level representation of the rat's spatial location and current trajectory to the goal as the rats learned. After the rats reached peak performance, RSC firing patterns began to represent the upcoming goal location as the rats approached the choice point. These neural simulations of the goal emerged at the same time that lesions impaired alternation performance, suggesting that the RSC gradually acquired task representations that contribute to navigational decision-making.

Keywords: attention; cingulate; consolidation; decision making; long term; memory; navigation; prediction; simulation; space.


Conflict of interest statement

Declaration of Interests

The authors declare no competing interests.

Figures

Figure 1.
Figure 1.. Neural populations in the retrosplenial cortex (RSC) developed a representation of the maze with learning.
(A) Schematic diagram of the continuous T-maze alternation task. After visiting one of the two reward locations (circles), rats returned to the stem and had to approach the opposite location for reward. (B) Behavioral performance across training stages, with average performance shown by the line plot (+/− SEM) and individual subjects indicated by circles. (C) RSC neuronal firing reliably distinguished maze regions. The firing of four example neurons illustrating the trial by trial firing as rats traversed the maze on left and right trials [17]. Red lines show maze section boundaries as depicted in a. Firing rate maps show the spatial distribution of firing rates for each example neuron. Neurons typically fired over large areas of the maze but differences in firing rates between spatial locations were quite reliable. (D) Bayesian decoding of the rat’s current location on the basis of RSC population firing patterns. Five decoded instances from one trial are shown. Colors indicate the probability of the rat being in each pixel given the instantaneous spiking activity, with warmer colors corresponding to higher probabilities. The actual location of the rat’s head is shown by the grey circle, and the rat’s current direction of travel is indicated by the arrow. Decoded locations (highest probability pixel) falling within the dashed circle (4.5 cm radius) were counted as correct. (E) RSC population encoding of spatial position improved with training. The decoder success rates for individual populations are plotted as open circles, with the mean indicated by the line. Decoding improved significantly with training and was always far more accurate than expected by chance (gray area shows the center 95% of the shuffle distribution). (F) Correlational analysis of RSC firing patterns also indicate that spatial representations improve with learning. A full lap around the maze was divided into 170 spatial bins (3 cm per bin) and correlation matrices were computed between firing rate vectors from the first and second half of each session at all spatial bins for each training stage. The black line connects the pixels of highest correlation between the two session halves at each spatial bin. Deviations from the diagonal indicate spatial coding errors. (G) Mean spatial coding error over all bins is plotted for each learning stage. Inset shows the mean population vector correlation for any two spatial locations as a function of the distance along the maze during asymptotic performance. Note that firing patterns from adjacent locations are well-correlated but the correlation decreases sharply with distance, indicating that population firing patterns are spatially specific. See also Figures S1–3.
Figure 2.
Figure 2.. Neurons in the RSC develop trial-type specific firing on the stem.
(A) Two examples of RSC neurons (rows) that fired differently on the stem depending on whether the rat was about to turn left or right. Firing rate maps are shown for left and right turn trials, with the analyzed sectors of the stem indicated. (B) Top, the overall proportion of RSC neurons (from all subjects) showing trial-type specific firing is plotted across learning. Gray shading shows the chance (shuffled) mean and range for each stage. Bottom, trial-type specific firing is shown for each subject (circles) along with the mean (line). (C) Trial-type specificity of RSC population activity increased with training. Each colored dot shows population activity from one trial (combined across subjects, see STAR Methods) plotted in terms of its distance from the mean of the same and opposite trial types. Points along the dotted line are equidistant to both trial types, indicating no preference for left or right trials, while points farther from the dotted line indicate stronger population preferences for one trial type over the other. Large dots outlined in black illustrate the mean for each learning stage (the Late mean is obscured). Note that population activity diverges from the unity line as learning progresses. (D) Trial-type specificity of the RSC population increased with training and was greater than chance by the middle training stage. Individual trials (small dots from C) are plotted as open circles, with the mean for each training stage illustrated by the line plot +/− SEM. (E) The ability to classify trials (left or right) solely on the basis of population firing patterns improved with learning, from chance (gray shading) early in learning, to perfect accuracy during asymptotic performance. (F-H) The trial-type specificity of RSC population firing was greater during sessions with better alternation performance. Plots are the same as C-E, except that all data were taken from asymptotic performance sessions that were grouped according to behavioral performance (% correct choices for the session). The mean of the 88.1-92.0% grouping is obscured. Note that population activity shows increased trial-type specificity and improved classification of left and right trials during sessions with superior behavioral performance. See also Figures S1 and S2.
Figure 3.
Figure 3.. RSC populations represent upcoming reward locations.
(A) Bayesian decoding was used to identify representation of the upcoming reward locations (arrows) as rats approached the choice point. Two examples are shown, one left and one right trial, of decoded instances when population firing patterns were more consistent with the upcoming reward area than the rat’s actual position (gray circle). (B) The analyses of decoded spatial information focused on the two reward locations and the distal part of the goal arms approaching each reward (black rectangles) but, importantly, was limited to time windows when the rat was located on the stem (red). (C) Heat maps illustrating the average decoded probability from all of the recorded populations from all of the rats, computed in 200 ms time bins as the rat traversed the stem, with separate heat maps shown for each learning stage. For illustration purposes, the data from the left trials are mirror reversed so that all the data are shown with the correct goal location to the right and the incorrect (previous) goal location shown to the left. Note the faint clouds of probability at the reward areas (i.e. decoding to the reward areas, arrows) during the early learning stage. This becomes more prominent through late learning and only becomes selective for the correct reward area during asymptotic performance. Stem locations are uniformly red because the decoding is most prevalent at the rat’s actual current location on the stem. (D) Decoding to the two reward areas increased with training and significantly exceeded chance levels (dashed line) only late in learning and during asymptotic performance. Individual populations are plotted as open circles, while average reward area decoding for each training stage is shown by the line plot +/− SEM. (E) Selective decoding to the correct reward area only became statistically significant during asymptotic performance. Future reward decoding was defined as the normalized difference between decoding to the correct reward area and the opposite (incorrect) reward area ((p(correct) − p(incorrect)) / p(correct) + p(incorrect)). Individual populations are plotted as open circles with the mean shown by the line plot. (F) Permanent lesions of the retrosplenial cortex selectively impaired spatial alternation performance after learning. Behavioral performance is plotted for the first (First), middle (Mid), and last (criterial, Crit) learning days, and asymptotic performance days (asymptotic performance, Aysmp). Performance for each control and lesion rat is shown as open circles, with the mean indicated by line plots. The inset illustrates asymptotic performance, along with the correlation between performance and lesion size. The inset illustrates asymptotic performance for control and lesion groups, and the lesion performance data plotted against lesion size. See also Figures S1–3.

References

    1. Corcoran KA, Donnan MD, Tronson NC, Guzman YF, Gao C, Jovasevic V, Guedea AL, and Radulovic J (2011). NMDA receptors in retrosplenial cortex are necessary for retrieval of recent and remote context fear memory. The Journal of neuroscience : the official journal of the Society for Neuroscience 31, 11655–11659. - PMC - PubMed
    1. Katche C, Dorman G, Gonzalez C, Kramar CP, Slipczuk L, Rossato JI, Cammarota M, and Medina JH (2013). On the role of retrosplenial cortex in long-lasting memory storage. Hippocampus 23, 295–302. - PubMed
    1. Cowansage KK, Shuman T, Dillingham BC, Chang A, Golshani P, and Mayford M (2014). Direct reactivation of a coherent neocortical memory of context. Neuron 84, 432–441. - PMC - PubMed
    1. de Sousa AF, Cowansage KK, Zutshi I, Cardozo LM, Yoo EJ, Leutgeb S, and Mayford M (2019). Optogenetic reactivation of memory ensembles in the retrosplenial cortex induces systems consolidation. - PMC - PubMed
    1. Milczarek MM, Vann SD, and Sengpiel F (2018). Spatial Memory Engram in the Mouse Retrosplenial Cortex. Current biology : CB 28, 1975–1980.e1976. - PMC - PubMed

Publication types

LinkOut - more resources