. 2019 Aug 6;30(2):343-351.e3.
doi: 10.1016/j.cmet.2019.05.010. Epub 2019 Jun 6.

Age Mosaicism across Multiple Scales in Adult Tissues

Affiliations

Age Mosaicism across Multiple Scales in Adult Tissues

Rafael Arrojo E Drigo et al. Cell Metab. .

Abstract

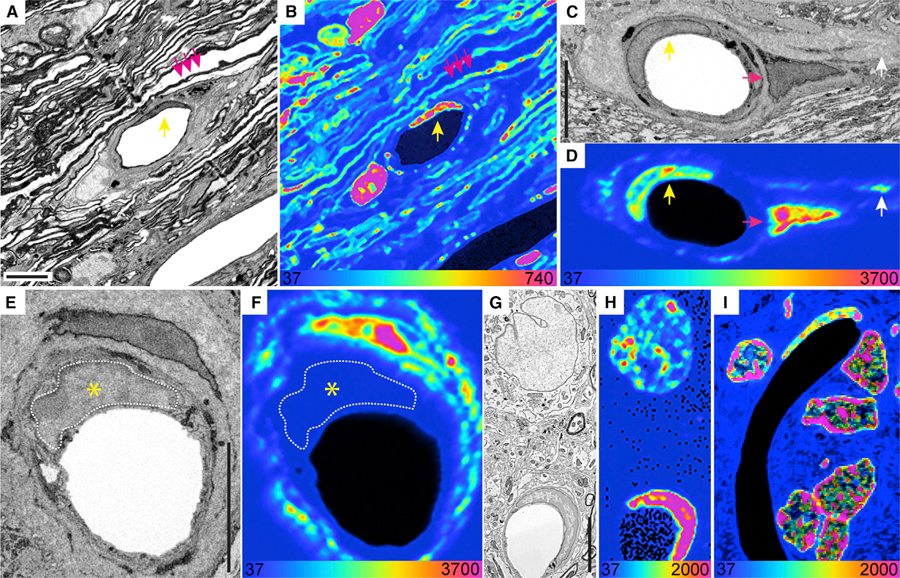
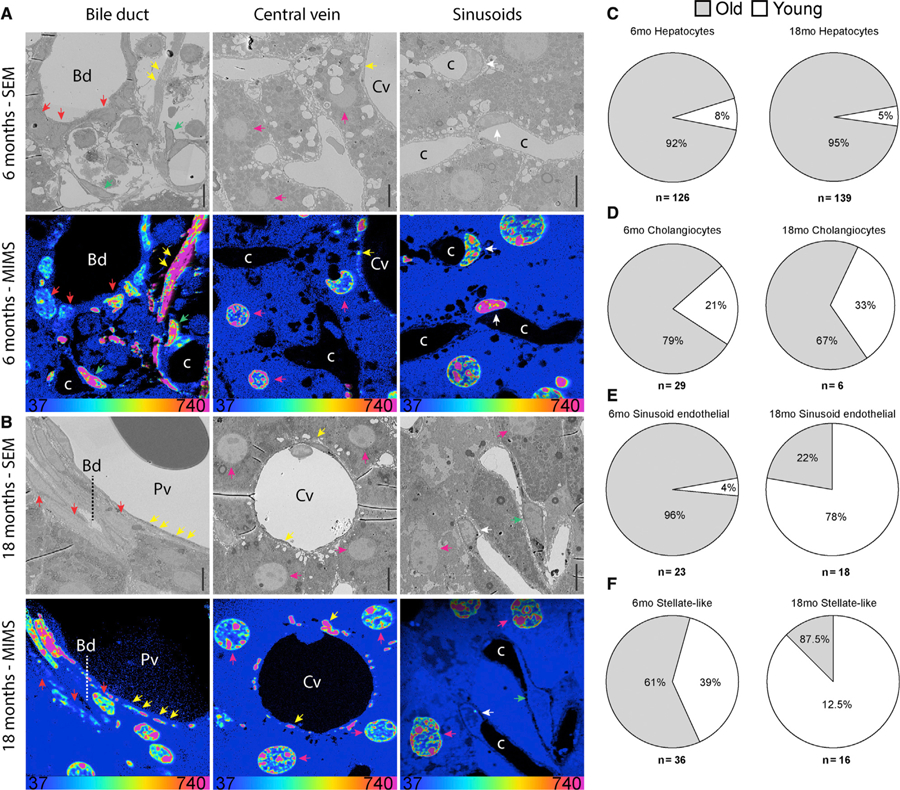
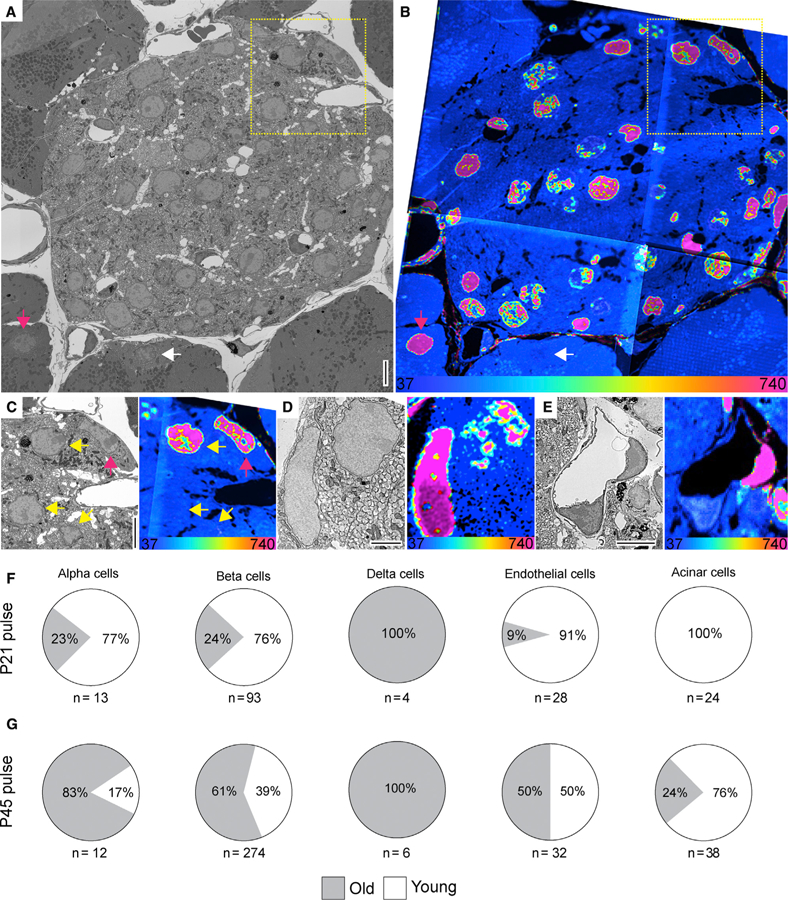
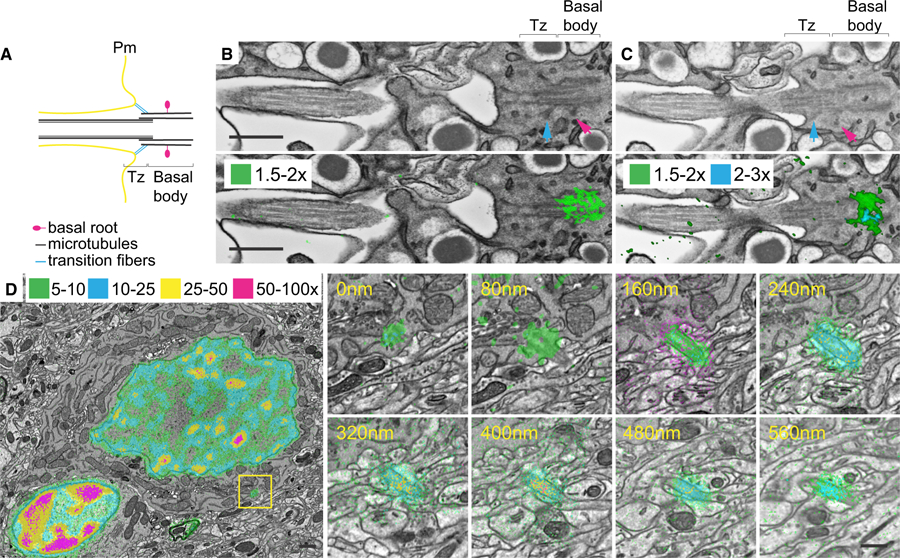
Most neurons are not replaced during an animal's lifetime. This nondividing state is characterized by extreme longevity and age-dependent decline of key regulatory proteins. To study the lifespans of cells and proteins in adult tissues, we combined isotope labeling of mice with a hybrid imaging method (MIMS-EM). Using 15N mapping, we show that liver and pancreas are composed of cells with vastly different ages, many as old as the animal. Strikingly, we also found that a subset of fibroblasts and endothelial cells, both known for their replicative potential, are characterized by the absence of cell division during adulthood. In addition, we show that the primary cilia of beta cells and neurons contains different structural regions with vastly different lifespans. Based on these results, we propose that age mosaicism across multiple scales is a fundamental principle of adult tissue, cell, and protein complex organization.

Keywords: aging; cell longevity; correlated multi-scale multi-modal microscopy; islets of Langerhans; multi-isotope imaging mass spectroscopy; primary cilium.


Conflict of interest statement

DECLARATION OF INTERESTS

The authors declare no competing interests.

Figures

Figure 1.
Figure 1.. MIMS-EM of LLCs and Structures in the CNS
(A and B) SEM (A) and MIMS (B) of two capillaries in the optic nerve head (ONH) of a 6-month chase mouse. An endothelial cell nucleus (yellow arrow) and myelin sheaths (pink arrows) are indicated. A pericyte nucleus is visible to the left the capillary lumen. (C and D) SEM (C) and MIMS (D) of a capillary in the ONH. An old endothelial cell nucleus (yellow arrow), a fibroblast (pink arrow) and 15N-rich extracellular matrix (ECM) (white arrow) are indicated. (E and F) SEM (E) and MIMS (F) of a capillary in the ONH, with an old fibroblast (top) and a young endothelial cell (nucleus delineated in white and indicated by the yellow asterisk). (G and H) SEM (G) and MIMS (H) of an L2 neuron (top) and an endothelial cell. (I) Close-up of granular cells in the rat cerebellum with an old endothelial cell visible. Full mosaic is shown in Figure S1B. Scale bars: 5 μm (A, C, E, and G) (SEM). At the bottom of the MIMS images, the heatmap shows the 15N/14N × 104 and scaled with a hue saturation intensity (HSI).
Figure 2.
Figure 2.. LLCs in the Liver
(A and B) SEM and MIMS of cells near bile ducts, central veins or capillary sinusoids from a 15N-SILAM P45 mouse chased for 6 months (A) or 18 months (B). ECM (yellow arrowheads), hepatocytes (pink arrowheads), cholangiocytes (red arrowheads), stellate-like (green arrowheads), and endothelial cells (white arrowheads) are indicated. Cv, central vein; Bd, bile duct; c, capillary. (C–F) Relative turnover of liver hepatocytes (C), cholangiocytes (D), sinusoid endothelial cells (E), and hepatic stellate-like cells (HSCs) (F) after a 6- or 18-month (mo) chase. The total number of cells analyzed for each cell type is indicated underneath each pie chart. At the bottom of the MIMS images, the heatmap shows the 15N/14N × 104 and scaled with a HSI. Scale bar, 10 μm.
Figure 3.
Figure 3.. LLCs in the Pancreas
(A and B) SEM (A) and MIMS (B) of a cross-section of the islets of Langerhans. Old and young acinar cells are indicated by pink and white arrow, respectively. Yellow dotted box highlights cells shown in (C). (C) Enlarged view of boxed region in (A) and (B). SEM and MIMS of beta cells (yellow arrows) and an old alpha cell (pink arrow). (D) An old delta cell (left) next to a younger beta cell (top right). (E) SEM and MIMS of a young (bottom) and an old (top right) endothelial cell. Old pancreatic stellate cells are seen in the top and lower right corners. (F) Relative turnover in percentages of cells that are as old (gray) or younger (white) than L2 neurons from 15N-SILAM P21 mouse chased for 26 months. (G) Same as in (F), but from a 15N-SILAM P45 mouse chased for 18 months. The total number of cells analyzed for each cell type is listed underneath each pie chart. At the bottom of the MIMS images, the heatmap shows the 15N/14N × 104 and scaled with an HSI. Scale bars: 5 μm (A, C, and E) and 2.5 μm (D).
Figure 4.
Figure 4.. Longevity of Primary Cilia in LLCs
(A) Cartoon of a primary cilium Bb. Microtubules (black), transition fibers (cyan), basal root (pink), transition zone (Tz), axoneme, and plasma membrane (Pm) are shown. (B and C) Two different sections of a beta cell primary cilium from a P21-15N-SILAM mouse chased for 26 months and imaged with MIMS-EM. Top rows: SEM micrographs with visible transition zone, Bb, transition fibers (cyan arrows), and basal root (pink arrows). Bottom rows: overlay of SEM micrographs and 15N/14N thresholds: 1.5×–2× (green) and 2×–3× (cyan) the natural 15N/14N of 37 × 104. (D) SEM micrograph overlaid with thresholded 15N/14N of an L2 neuron from a P45-15N-SILAM mouse chased for 6 months. The yellow box indicates the Bb. On the right are serial sections of the neuron Bb and primary cilium. 15N/14N thresholds: 5×–10× (green), 10×–25× (cyan), 25×–50× (yellow), and 50×–100× (magenta) the natural 15N/14N. At the bottom of the MIMS images, the heatmap shows the 15N/14N × 104 and scaled with a HSI. Scale bars: 300 nm (B), 1 μm (D), 500 nm (D, inset).

References

    1. Adams SR, Mackey MR, Ramachandra R, Palida Lemieux SF, Steinbach P, Bushong EA, Butko MT, Giepmans BNG, Ellisman MH, and Tsien RY (2016). Multicolor electron microscopy for simultaneous visualization of multiple molecular species. Cell Chem. Biol 23, 1417–1427. - PMC - PubMed
    1. Aguayo-Mazzucato C, van Haaren M, Mruk M, Lee TB, Crawford C, Hollister-Lock J, Sullivan BA, Johnson JW, Ebrahimi A, Dreyfuss JM, et al. (2017). Beta cell aging markers have heterogeneous distribution and are induced by insulin resistance. Cell Metab 25, 898–910. - PMC - PubMed
    1. Almaça J, Molina J, Arrojo e Drigo R, Abdulreda MH, Jeon WB, Berggren PO, Caicedo A, and Nam HG (2014). Young capillary vessels rejuvenate aged pancreatic islets. Proc. Natl. Acad. Sci. USA 111, 17612–17617. - PMC - PubMed
    1. Bader E, Migliorini A, Gegg M, Moruzzi N, Gerdes J, Roscioni SS, Bakhti M, Brandl E, Irmler M, Beckers J, et al. (2016). Identification of proliferative and mature b-cells in the islets of Langerhans. Nature 535, 430–434. - PubMed
    1. Basu R, Breda E, Oberg AL, Powell CC, Dalla Man C, Basu A, Vittone JL, Klee GG, Arora P, Jensen MD, et al. (2003). Mechanisms of the age-associated deterioration in glucose tolerance: contribution of alterations in insulin secretion, action, and clearance. Diabetes 52, 1738–1748. - PubMed

Publication types