. 2019 Jul 3;27(7):1275-1285.
doi: 10.1016/j.ymthe.2019.05.015. Epub 2019 May 30.

Effect of Cryopreservation on Autologous Chimeric Antigen Receptor T Cell Characteristics

Affiliations

Effect of Cryopreservation on Autologous Chimeric Antigen Receptor T Cell Characteristics

Sandhya R Panch et al. Mol Ther. .

Abstract

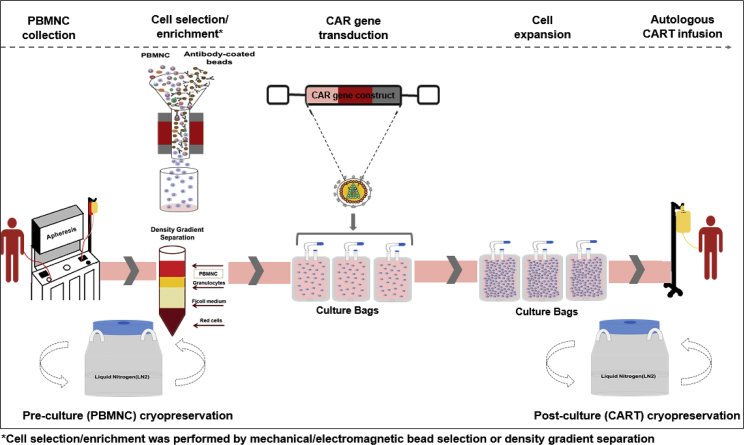
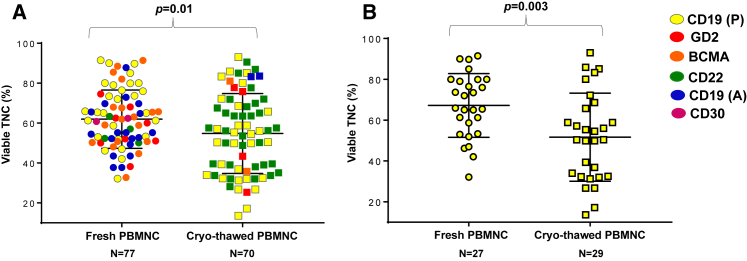
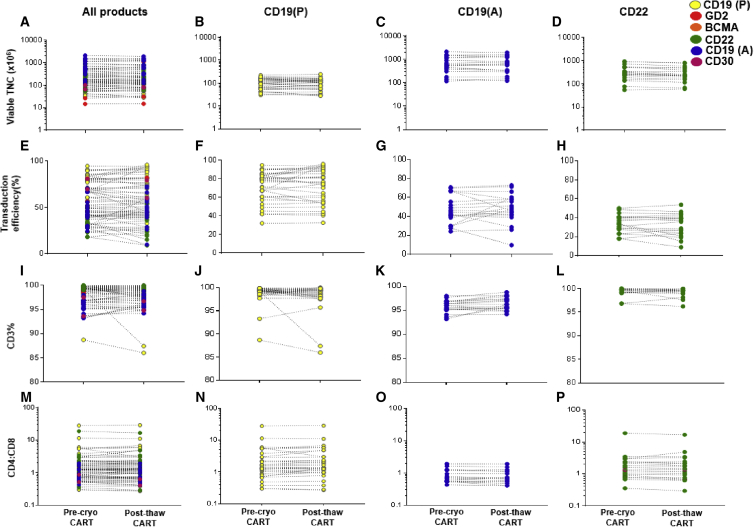
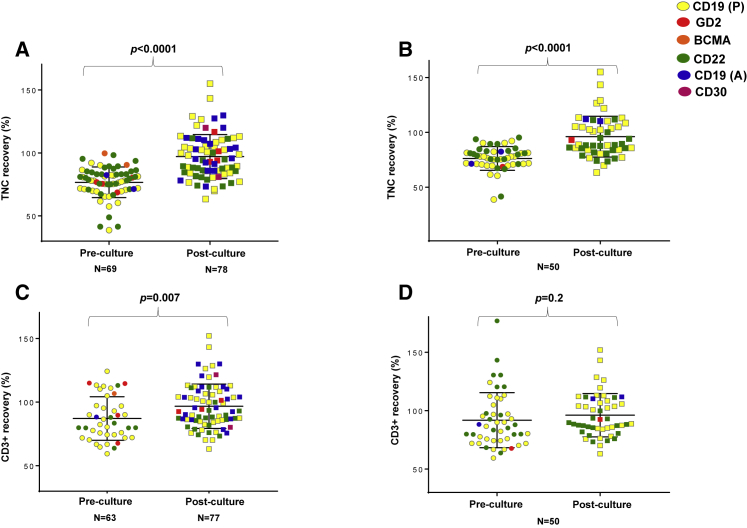
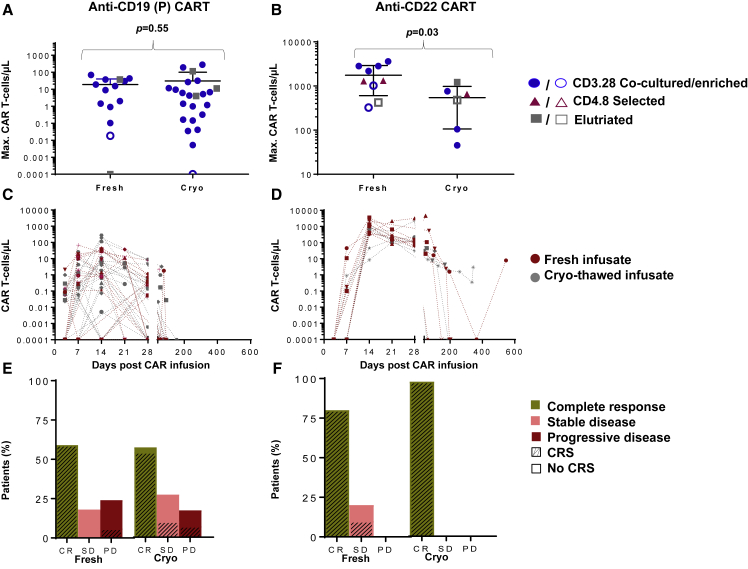
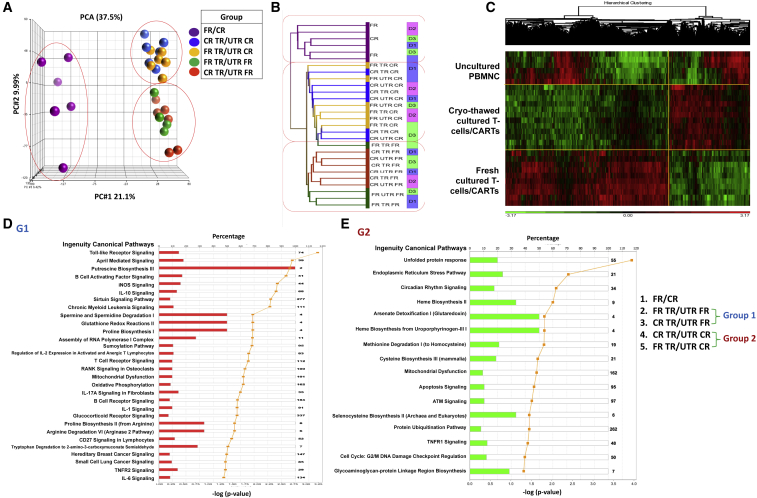
As clinical applications for chimeric antigen receptor T cell (CART) therapy extend beyond early phase trials, commercial manufacture incorporating cryopreservation steps becomes a logistical necessity. The effect of cryopreservation on CART characteristics is unclear. We retrospectively evaluated the effect of cryopreservation on product release criteria and in vivo characteristics in 158 autologous CART products from 6 single-center clinical trials. Further, from 3 healthy donor manufacturing runs, we prospectively identified differentially expressed cell surface markers and gene signatures among fresh versus cryopreserved CARTs. Within 2 days of culture initiation, cell viability of the starting fraction (peripheral blood mononuclear cells [PBMNCs]) decreased significantly in the cryo-thawed arm compared to the fresh arm. Despite this, PBMNC cryopreservation did not affect final CART fold expansion, transduction efficiency, CD3%, or CD4:CD8 ratios. In vivo CART persistence and clinical responses did not differ among fresh and cryopreserved final products. In healthy donors, compared to fresh CARTs, early apoptotic cell-surface markers were significantly elevated in cryo-thawed CARTs. Cryo-thawed CARTs also demonstrated significantly elevated expression of mitochondrial dysfunction, apoptosis signaling, and cell cycle damage pathways. Cryopreservation during CART manufacture is a viable strategy, based on standard product release parameters. The clinical impact of cryopreservation-related subtle micro-cellular damage needs further study.

Keywords: CAR T cells; PBMNC; chimeric antigen receptor T cells; cryopreservation; early apoptotic cells; gene expression profiling; leukemia; lymphoma; multiple myeloma; viability.


Figures

Figure 1
Figure 1
CART Manufacturing Schema A simplified diagram of the CART manufacturing process across the various manufacturing protocols at the NIH Center for Cellular Engineering. Starting with collection of PBMNCs by apheresis, the fresh or cryo-thawed cells (PBMNCs) are processed by mechanical or electromagnetic bead selection or density gradient centrifugation. Following the cell selection and enrichment process, CAR gene transduction, cell expansion, and harvest are performed over 7–9 days. After testing for sterility, the final CART product is either released fresh for infusion or cryopreserved again for future thaw and infusion. At the time of release, viability (post-thaw) and counts are repeated on cryo-thawed CARTs for cell dose calculations.
Figure 2
Figure 2
Comparison on Culture Day 2 of Viable TNC Quantities (%) between Fresh and Cryopreserved PBMNCs The results for PBMNCs from all protocols are shown in (A) [CD19 (P) CARTs, yellow; GD2 CARTs, red; BCMA CARTs, orange; CD22 CARTs, green; CD19 (A) CARTs, blue; and CD30 CARTs, magenta], and the results for PBMNCs from the CD19 CART (P) protocol are shown in (B) (yellow). The scatter dot plots with bars demonstrate mean + SD. p values were calculated for unpaired t tests.
Figure 3
Figure 3
Comparisons of CART Characteristics at Cryopreservation and Post-thaw Viable TNC (row 1), TE (row 2), CD3% (row 3), and CD4:CD8 ratio (row 4) are compared for the final CART product at cryopreservation and following thaw. Column 1 (A, E, I, and M) shows all CART products. Column 2 (B, F, J, and N) shows CD19-CART (P) products, column 3 (C, G, K, and O) shows CD19 CART(A) products, and column 4 (D, H, L, and P) shows CD22-CART products. The p values were calculated for paired t tests.
Figure 4
Figure 4
Comparison of Post-thaw Characteristics of PBMNCs and CARTs (A) The post-thaw TNC recovery of all PBMNCs (pre-culture) and all CARTs (post-culture). (B) The post-thaw TNC recovery only for pairs of PBMNCs and CARTs that underwent double-end cryopreservation, i.e., the PBMNCs were cryopreserved prior to culture (pre-culture) and the CARTs were again analyzed post-cryopreservation-thaw (post-culture). (C) The post-thaw CD3+ cell recovery of all PBMNCs (pre-culture) and all CARTs (post-culture). (D) The post-thaw CD3+ cell recovery for pairs of PBMNCs that were cryopreserved prior to culture (pre-culture) and CARTs that were analyzed post-cryopreservation (post-culture). To calculate cell recovery, viability was measured by the standard trypan blue assay as part of clinical release testing. The scatter dot plots with bars demonstrate mean + SD. p values were calculated for unpaired (A and C) and paired t tests (B and D).
Figure 5
Figure 5
Comparison of In Vivo Levels and Persistence of CARTs Infused Fresh or after Cryopreservation (A and B) The clinical risk stratification (solid shape, high disease burden; outline shape, low disease burden) and maximum levels of peripheral blood T cells expressing CD19 CARTs (A, n = 47) and CD22 CARTs (B, n = 15) in patients who received a first infusion of fresh or cryo-thawed product at a dose of 1 × 106 cells/kg. (C and D) The post-infusion persistence of CARTs in the peripheral blood of patients receiving CD19 CARTs (C) and CD22 CARTs (D). All patients received a dose of 1 × 106 CART cells/kg. Patients receiving fresh CARTs are indicated by pink shapes (CD19 CARTs, n = 17 and CD22 CARTs, n = 9). Patients receiving cryopreserved CARTs are indicated by gray shapes (CD19 CARTs, n = 30 and CD22 CARTs, n = 6). The limit of CART detection by FACS in the peripheral blood was determined for each protocol. For CD19 CARTs and CD22 CARTs, the limits of detection were defined as CART cell fractions of 0.01% and 0.001% of total T cells in the peripheral blood, respectively. In patients receiving fresh or cryopreserved CD19 CARTs (E) and CD22 CARTs (F), clinical response at day 28 and proportion of patients experiencing any grade CRS are shown. All patients received a dose of 1 × 106 CARTs/kg. A total of 17 patients received fresh and 30 received cryopreserved CD19 CARTs and 9 patients received fresh and 7 cryopreserved CD22 CARTs. CR, complete response; SD, stable disease; PD, progressive disease; CRS, cytokine release syndrome. p values were calculated for non-parametric tests, where applicable.
Figure 6
Figure 6
Viability and Apoptosis Analysis of Fresh and Cryopreserved CARTs CARTs were prepared from fresh or cryopreserved PBMNCs and were analyzed fresh or following cryopreservation. CARTs were prepared from 3 healthy subjects and were transduced (TR) with murine stem cell virus (MSCV)-CAR1922-woodchuck hepatitis virus (WHP) posttranscriptional regulatory element (WPRE) vector. Representative dot plots of fresh CARTs from donor 1 prepared from fresh PBMNCs (Fresh TR Fresh) for 7AAD expression is shown in (A) and for Annexin-V, Helix NP in (B). Dot plots of fresh CARTs from donor 1 prepared from cryopreserved PBMNCs (Cryo TR Fresh) for 7AAD expression is shown in (C) and for Annexin-V, Helix NP in (D). Dot plots of cryopreserved CARTs from donor 1 prepared from fresh PBMNCs (Fresh TR Cryo) for 7AAD expression is shown in (E) and for Annexin-V, Helix NP in (F). Dot plots of cryopreserved CARTs from donor 1 prepared from cryopreserved PBMNCs (Cryo TR Cryo) for 7AAD expression is shown in (G) and for Annexin-V, Helix NP in (H). The 7AADdim population in (A), (C), (E), and (G) was also the cells that were Annexin-V bright in the corresponding adjacent figures, likely representing early apoptotic cells. However, in column 1, the combined viable cell fraction, which included 7AADbright and 7AADdim populations, corresponded with the trypan blue viability used to test clinical products. (I and J) The results for combined analysis CARTs from all 3 donors tested and prepared under the 4 conditions are summarized. The results of the expressions of (I) 7AAD and (J) Annexin-V, Helix NP are shown. Bars in (I) and (J) represent means + SD.
Figure 7
Figure 7
Gene Expression Analysis of Fresh and Cryopreserved CARTs CARTs were manufactured from 3 healthy subjects, and fresh (C-FR) and cryopreserved (C-CR) CARTs were analyzed by global gene expression analysis. The CARTs were produced from both fresh PBMNCs (P-FR) and cryopreserved PBMNCs (P-FR), and they were transduced (TR) with MSCV-CAR1922-WPRE vector. Untransduced (UTR) fresh and cryopreserved PBMNCs and cultured PBMNCs were also analyzed as a control. The 28 samples were available for global gene expression profiling, and the results were analyzed by principal-component analysis (A) and unsupervised hierarchical clustering analysis (B, cluster dendrogram; C, hierarchical clustering heatmap). (D and E) Ingenuity pathway analysis of genes expressed by cryopreserved and fresh CARTs and cultured T cells are shown. A comparison of the transcriptome of cryopreserved CARTs (n = 6) and cultured T cells (n = 6) with that of fresh CARTs (n = 6) and cultured T cells revealed 2,124 differentially expressed genes. The results of ingenuity pathway analysis of 1,139 genes whose expression was greater in cryopreserved cells is shown in (D) and ingenuity pathway analysis of 985 genes whose expression was greater in fresh cells is shown in (E).

Comment in

References

    1. O’Leary M.C., Lu X., Huang Y., Lin X., Mahmood I., Przepiorka D., Gavin D., Lee S., Liu K., George B. FDA Approval Summary: Tisagenlecleucel for Treatment of Patients with Relapsed or Refractory B-Cell Precursor Acute Lymphoblastic Leukemia. Clin. Cancer Res. 2019;25:1142–1146. - PubMed
    2. O’Leary, M.C., Lu, X., Huang, Y., Lin, X., Mahmood, I., Przepiorka, D., Gavin, D., Lee, S., Liu, K., George, B., et al. (2019). FDA Approval Summary: Tisagenlecleucel for Treatment of Patients with Relapsed or Refractory B-Cell Precursor Acute Lymphoblastic Leukemia. Clin. Cancer Res. 25, 1142-1146. - PubMed
    1. Mullard A. Second anticancer CAR T therapy receives FDA approval. Nat. Rev. Drug Discov. 2017;16:818. - PubMed
    2. Mullard, A. (2017). Second anticancer CAR T therapy receives FDA approval. Nat. Rev. Drug Discov. 16, 818. - PubMed
    1. Ruella M., Xu J., Barrett D.M., Fraietta J.A., Reich T.J., Ambrose D.E., Klichinsky M., Shestova O., Patel P.R., Kulikovskaya I. Induction of resistance to chimeric antigen receptor T cell therapy by transduction of a single leukemic B cell. Nat. Med. 2018;24:1499–1503. - PMC - PubMed
    2. Ruella, M., Xu, J., Barrett, D.M., Fraietta, J.A., Reich, T.J., Ambrose, D.E., Klichinsky, M., Shestova, O., Patel, P.R., Kulikovskaya, I., et al. (2018). Induction of resistance to chimeric antigen receptor T cell therapy by transduction of a single leukemic B cell. Nat. Med. 24, 1499-1503. - PMC - PubMed
    1. Iyer R.K., Bowles P.A., Kim H., Dulgar-Tulloch A. Industrializing Autologous Adoptive Immunotherapies: Manufacturing Advances and Challenges. Front. Med. (Lausanne) 2018;5:150. - PMC - PubMed
    2. Iyer, R.K., Bowles, P.A., Kim, H., and Dulgar-Tulloch, A. (2018). Industrializing Autologous Adoptive Immunotherapies: Manufacturing Advances and Challenges. Front. Med. (Lausanne) 5, 150. - PMC - PubMed
    1. Vormittag P., Gunn R., Ghorashian S., Veraitch F.S. A guide to manufacturing CAR T cell therapies. Curr. Opin. Biotechnol. 2018;53:164–181. - PubMed
    2. Vormittag, P., Gunn, R., Ghorashian, S., and Veraitch, F.S. (2018). A guide to manufacturing CAR T cell therapies. Curr. Opin. Biotechnol. 53, 164-181. - PubMed

Publication types

MeSH terms