

The Effect of Calcium and Glucose Concentration on Corneal Epithelial Cell Lines Differentiation, Proliferation, and Focal Adhesion Expression
- PMID: 31179162
- PMCID: PMC6555176
- DOI: 10.1089/biores.2018.0036
The Effect of Calcium and Glucose Concentration on Corneal Epithelial Cell Lines Differentiation, Proliferation, and Focal Adhesion Expression
Abstract
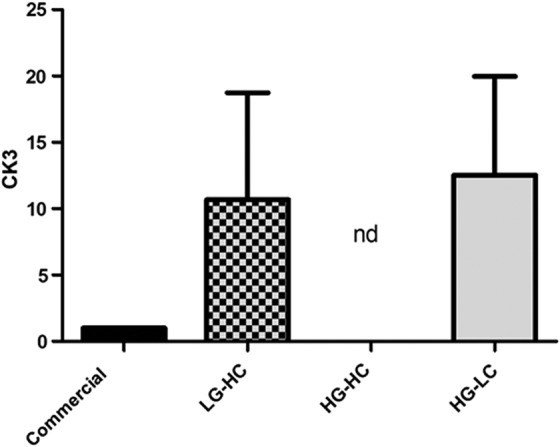
It is known that culture media composition can affect cell behavior, morphology, and gene expression. However, in the case of corneal epithelial cells, the combined role of calcium and glucose concentration in media has not previously been examined. In this study, a human immortalized corneal epithelial cell line was used to examine the effect of glucose and calcium concentrations on these cells. Cell metabolic activity, cell growth curve analysis, and relative gene and protein expression of proliferative marker extracellular related kinase (ERK) were used to study proliferation. Corneal epithelial stem cell marker NP63 and mature epithelial marker cytokeratin 3 (CK3) were analyzed by using reverse transcription polymerase chain reaction (RT-PCR) and immunocytochemistry. Focal adhesions were examined by using immunocytochemistry. Cells cultured in both low-glucose, high-calcium (LG-HC) media and high-glucose, low-calcium (HG-LC) media showed similar results in both RT-PCR and immunocytochemistry analysis. NP63 expression was significantly lower and CK3 expression was higher in these groups compared with cells cultured in commercial media. NP63 and CK3 expression was also analyzed by using immunocytochemistry, which confirmed these findings. The high-glucose, high-calcium-fed cells showed the lowest expression of all markers and no gene expression of CK3. This was deemed the most unsuitable media formulation for this cell line. Focal adhesion expression was the lowest in the high-calcium, high-glucose-fed cells, with the most even distribution of this among the commercial media group. Overall, this study showed that varying glucose and calcium concentrations can have significant effects on differentiation, proliferation, focal adhesions, and metabolic activity of this cell line. It seems that an LG-HC and HG-LC formulation were interchangeable with similar proliferative and differentiation effects.
Keywords: calcium; cornea; epithelium; glucose.
Conflict of interest statement
No competing financial interests exist.
Figures


Similar articles
-
A role for notch signaling in human corneal epithelial cell differentiation and proliferation.Invest Ophthalmol Vis Sci. 2007 Aug;48(8):3576-85. doi: 10.1167/iovs.06-1373. Invest Ophthalmol Vis Sci. 2007. PMID: 17652726
-
Differentiation of human amniotic epithelial cells into corneal epithelial-like cells in vitro.Int J Ophthalmol. 2013 Oct 18;6(5):564-72. doi: 10.3980/j.issn.2222-3959.2013.05.02. eCollection 2013. Int J Ophthalmol. 2013. PMID: 24195026 Free PMC article.
-
Differentiation of Stem Cells From Human Exfoliated Deciduous Teeth Toward a Phenotype of Corneal Epithelium In Vitro.Cornea. 2015 Nov;34(11):1471-7. doi: 10.1097/ICO.0000000000000532. Cornea. 2015. PMID: 26165791
-
Phenotypic Change and Induction of Cytokeratin Expression During In Vitro Culture of Corneal Stromal Cells.Invest Ophthalmol Vis Sci. 2015 Nov;56(12):7225-35. doi: 10.1167/iovs.15-17810. Invest Ophthalmol Vis Sci. 2015. PMID: 26544791
-
Autologous method for ex vivo expansion of human limbal epithelial progenitor cells based on plasma rich in growth factors technology.Ocul Surf. 2017 Apr;15(2):248-256. doi: 10.1016/j.jtos.2017.01.003. Epub 2017 Jan 20. Ocul Surf. 2017. PMID: 28115245 Review.
Cited by
-
Biological Compositions of Canine Amniotic Membrane and Its Extracts and the Investigation of Corneal Wound Healing Efficacy In Vitro.Vet Sci. 2022 May 9;9(5):227. doi: 10.3390/vetsci9050227. Vet Sci. 2022. PMID: 35622755 Free PMC article.
-
Culture and expansion of murine proximal airway basal stem cells.Stem Cell Res Ther. 2024 Jan 30;15(1):26. doi: 10.1186/s13287-024-03642-2. Stem Cell Res Ther. 2024. PMID: 38287366 Free PMC article.
-
Transmembrane Mucin 1 Blocks Fluorescein Ingress to Corneal Epithelium.Invest Ophthalmol Vis Sci. 2022 Feb 1;63(2):31. doi: 10.1167/iovs.63.2.31. Invest Ophthalmol Vis Sci. 2022. PMID: 35212722 Free PMC article.
-
Molecular and epigenetic alterations in normal and malignant myelopoiesis in human leukemia 60 (HL60) promyelocytic cell line model.Front Cell Dev Biol. 2023 Feb 2;11:1060537. doi: 10.3389/fcell.2023.1060537. eCollection 2023. Front Cell Dev Biol. 2023. PMID: 36819104 Free PMC article.
-
Glucose-impaired Corneal Re-epithelialization Is Promoted by a Novel Derivate of Dimethyl Fumarate.Antioxidants (Basel). 2021 May 22;10(6):831. doi: 10.3390/antiox10060831. Antioxidants (Basel). 2021. PMID: 34067436 Free PMC article.
References
-
- Pellegrini G, Traverso CE, Franzi AT, et al. . Long-term restoration of damaged corneal surfaces with autologous cultivated corneal epithelium. Lancet. 1997;349:990–993 - PubMed
-
- Takahashi H, Akiba K, Noguchi T, et al. . Matrix metalloproteinase activity is enhanced during corneal wound repair in high glucose condition. Curr Eye Res. 2000;21:608–615 - PubMed
LinkOut - more resources
Full Text Sources
Miscellaneous