

Fisher linear discriminant analysis for classification and prediction of genomic susceptibility to stomach and colorectal cancers based on six STR loci in a northern Chinese Han population
- PMID: 31179189
- PMCID: PMC6544021
- DOI: 10.7717/peerj.7004
Fisher linear discriminant analysis for classification and prediction of genomic susceptibility to stomach and colorectal cancers based on six STR loci in a northern Chinese Han population
Abstract
Objective: Gastrointestinal cancer is the leading cause of cancer-related death worldwide. The aim of this study was to verify whether the genotype of six short tandem repeat (STR) loci including AR, Bat-25, D5S346, ER1, ER2, and FGA is associated with the risk of gastric cancer (GC) and colorectal cancer (CRC) and to develop a model that allows early diagnosis and prediction of inherited genomic susceptibility to GC and CRC.
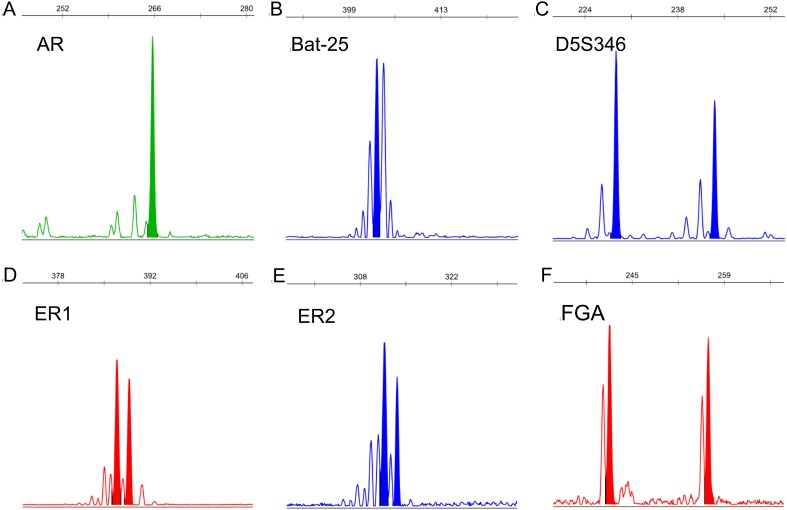
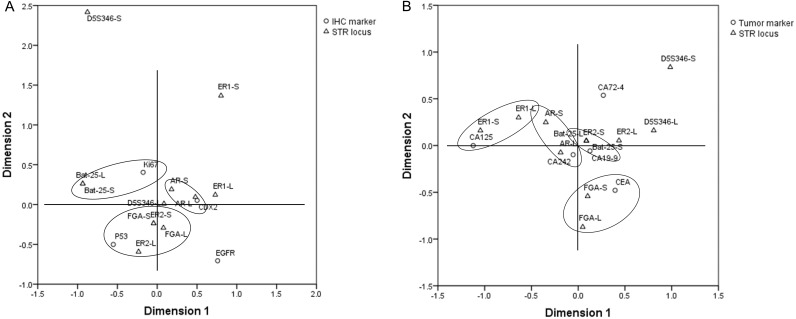
Methods: Alleles of six STR loci were determined using the peripheral blood of six colon cancer patients, five rectal cancer patients, eight GC patients, and 30 healthy controls. Fisher linear discriminant analysis (FDA) was used to establish the discriminant formula to distinguish GC and CRC patients from healthy controls. Leave-one-out cross validation and receiver operating characteristic (ROC) curves were used to validate the accuracy of the formula. The relationship between the STR status and immunohistochemical (IHC) and tumor markers was analyzed using multiple correspondence analysis.
Results: D5S346 was confirmed as a GC- and CRC-related STR locus. For the first time, we established a discriminant formula on the basis of the six STR loci, which was used to estimate the risk coefficient of suffering from GC and CRC. The model was statistically significant (Wilks' lambda = 0.471, χ2 = 30.488, df = 13, and p = 0.004). The results of leave-one-out cross validation showed that the sensitivity of the formula was 73.7% and the specificity was 76.7%. The area under the ROC curve (AUC) was 0.926, with a sensitivity of 73.7% and a specificity of 93.3%. The STR status was shown to have a certain relationship with the expression of some IHC markers and the level of some tumor markers.
Conclusions: The results of this study complement clinical diagnostic criteria and present markers for early prediction of GC and CRC. This approach will aid in improving risk awareness of susceptible individuals and contribute to reducing the incidence of GC and CRC by prevention and early detection.
Keywords: Fisher linear discriminant analysis; Gastrointestinal cancer; Genomic susceptibility prediction; Molecular diagnosis; STR.
Conflict of interest statement
The authors declare there are no competing interests.
Figures


Similar articles
-
Prediction of carotid plaque by blood biochemical indices and related factors based on Fisher discriminant analysis.BMC Cardiovasc Disord. 2022 Aug 15;22(1):371. doi: 10.1186/s12872-022-02806-3. BMC Cardiovasc Disord. 2022. PMID: 35965318 Free PMC article.
-
[Clinical application value of combined detection of serum miR-378 and miR-21 in gastric cancer].Zhonghua Zhong Liu Za Zhi. 2018 Jun 23;40(6):441-445. doi: 10.3760/cma.j.issn.0253-3766.2018.06.008. Zhonghua Zhong Liu Za Zhi. 2018. PMID: 29936770 Chinese.
-
Specificity of metabolic colorectal cancer biomarkers in serum through effect size.Metabolomics. 2020 Aug 13;16(8):88. doi: 10.1007/s11306-020-01707-w. Metabolomics. 2020. PMID: 32789702
-
Optimization of short tandem repeats (STR) typing method and allele frequency of 8 STR markers in referring to forensic medicine of Semnan Province.J Med Life. 2015;8(Spec Iss 4):180-185. J Med Life. 2015. PMID: 28316728 Free PMC article.
-
The Clinical Value of HSP60 in Digestive System Cancers: a Systematic Review and Meta-Analysis.Clin Lab. 2019 Oct 1;65(10). doi: 10.7754/Clin.Lab.2019.190523. Clin Lab. 2019. PMID: 31625354
Cited by
-
Fisher discriminant model based on LASSO logistic regression for computed tomography imaging diagnosis of pelvic rhabdomyosarcoma in children.Sci Rep. 2022 Sep 17;12(1):15631. doi: 10.1038/s41598-022-20051-8. Sci Rep. 2022. PMID: 36115914 Free PMC article.
-
Inflammation and Oxidative Stress Role of S100A12 as a Potential Diagnostic and Therapeutic Biomarker in Acute Myocardial Infarction.Oxid Med Cell Longev. 2022 Aug 25;2022:2633123. doi: 10.1155/2022/2633123. eCollection 2022. Oxid Med Cell Longev. 2022. Retraction in: Oxid Med Cell Longev. 2023 Dec 29;2023:9789872. doi: 10.1155/2023/9789872. PMID: 36062187 Free PMC article. Retracted.
References
-
- Esemuede I, Forslund A, Khan SA, Qin LX, Gimbel MI, Nash GM, Zeng Z, Rosenberg S, Shia J, Barany F, Paty PB. Improved testing for microsatellite instability in colorectal cancer using a simplified 3-marker assay. Annals of Surgical Oncology. 2010;17:3370–3378. doi: 10.1245/s10434-010-1147-4. - DOI - PMC - PubMed
LinkOut - more resources
Full Text Sources
Research Materials
Miscellaneous
