. 2020 Jan;51(1):234-249.
doi: 10.1002/jmri.26794. Epub 2019 Jun 9.

Tractography reproducibility challenge with empirical data (TraCED): The 2017 ISMRM diffusion study group challenge

Affiliations

Tractography reproducibility challenge with empirical data (TraCED): The 2017 ISMRM diffusion study group challenge

Vishwesh Nath et al. J Magn Reson Imaging. 2020 Jan.

Abstract

Background: Fiber tracking with diffusion-weighted MRI has become an essential tool for estimating in vivo brain white matter architecture. Fiber tracking results are sensitive to the choice of processing method and tracking criteria.

Purpose: To assess the variability for an algorithm in group studies reproducibility is of critical context. However, reproducibility does not assess the validity of the brain connections. Phantom studies provide concrete quantitative comparisons of methods relative to absolute ground truths, yet do no capture variabilities because of in vivo physiological factors. The ISMRM 2017 TraCED challenge was created to fulfill the gap.

Study type: A systematic review of algorithms and tract reproducibility studies.

Subjects: Single healthy volunteers.

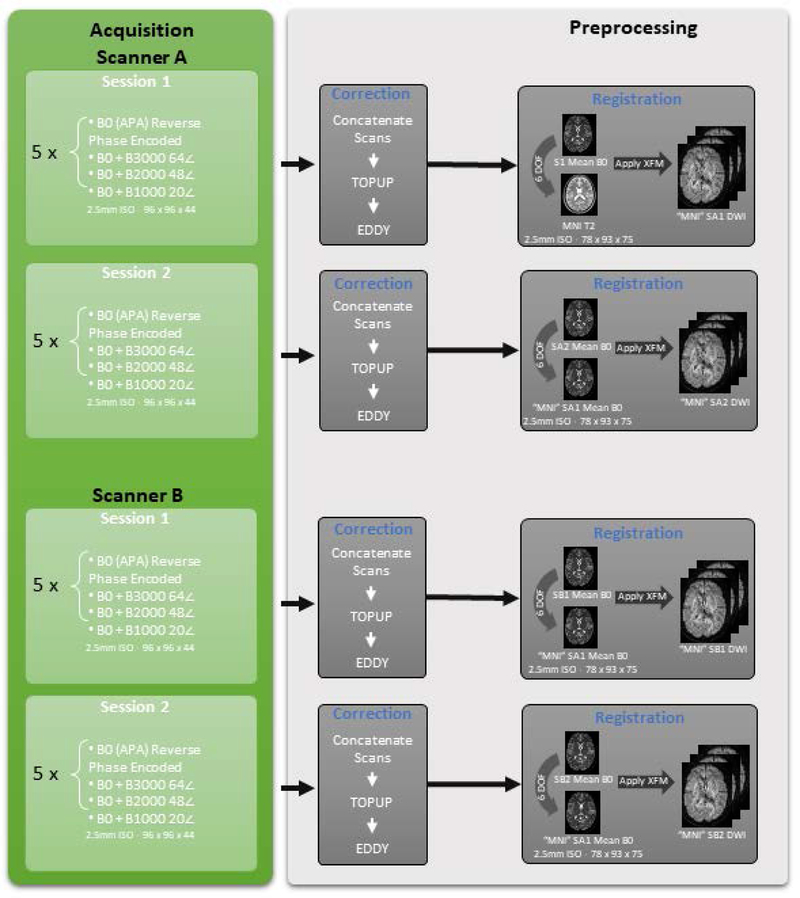
Field strength/sequence: 3.0T, two different scanners by the same manufacturer. The multishell acquisition included b-values of 1000, 2000, and 3000 s/mm2 with 20, 45, and 64 diffusion gradient directions per shell, respectively.

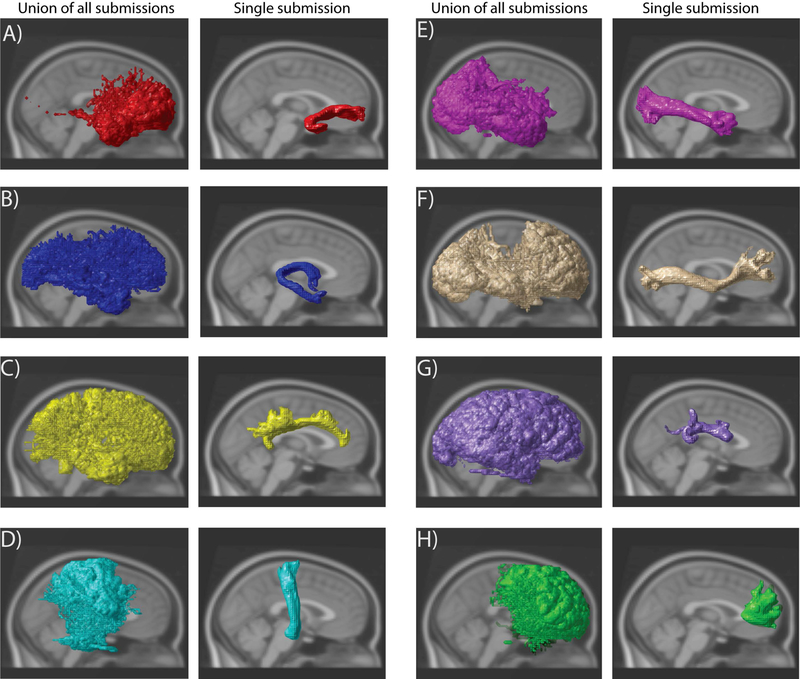
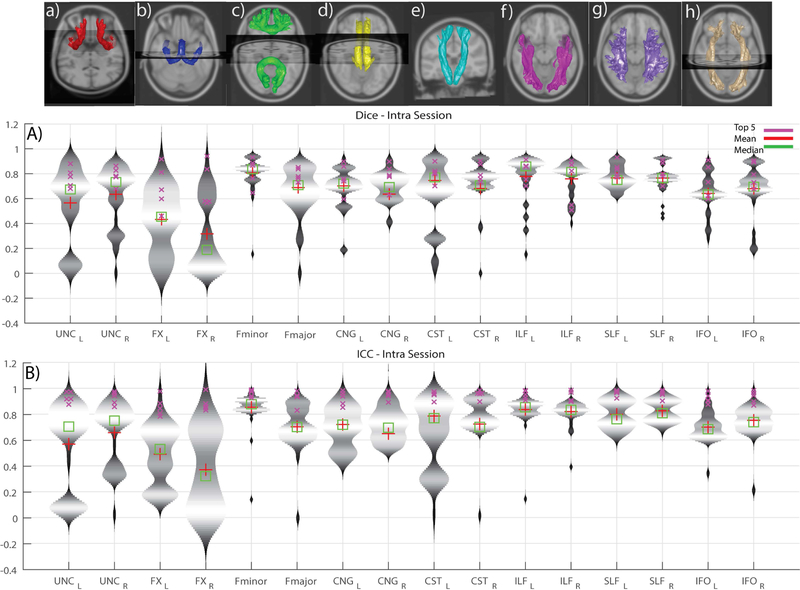
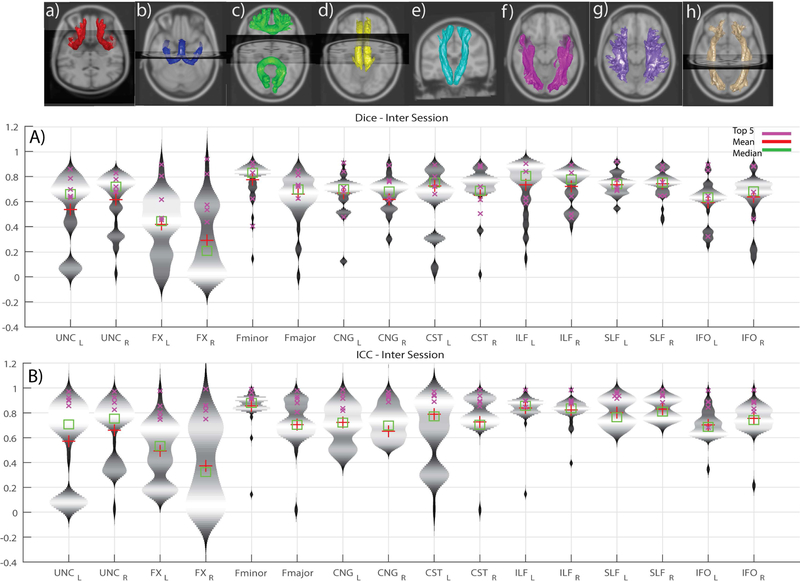
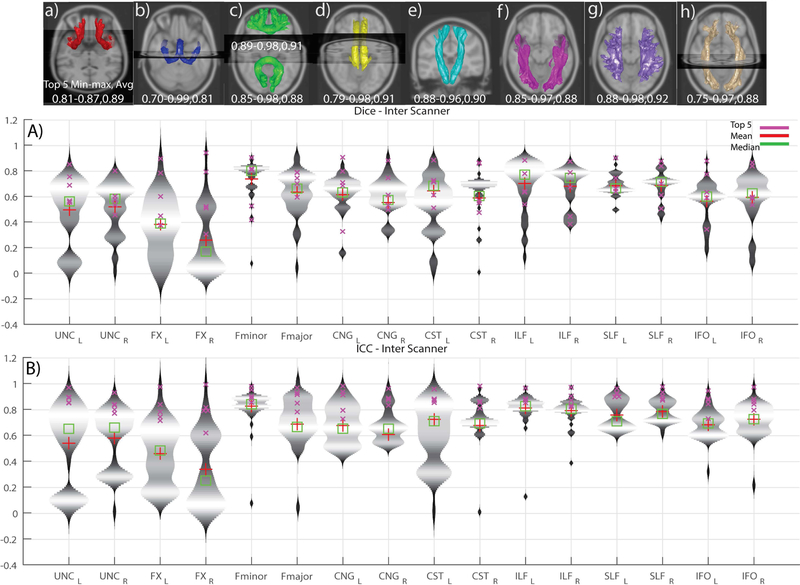
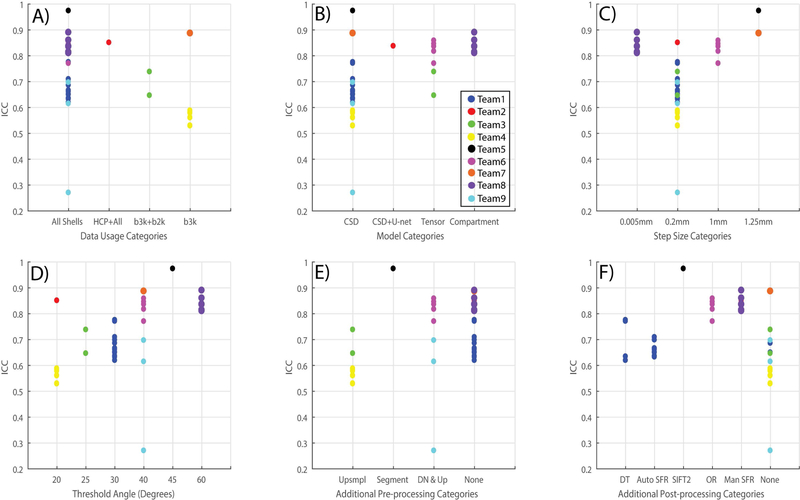
Assessment: Nine international groups submitted 46 tractography algorithm entries each consisting 16 tracts per scan. The algorithms were assessed using intraclass correlation (ICC) and the Dice similarity measure.

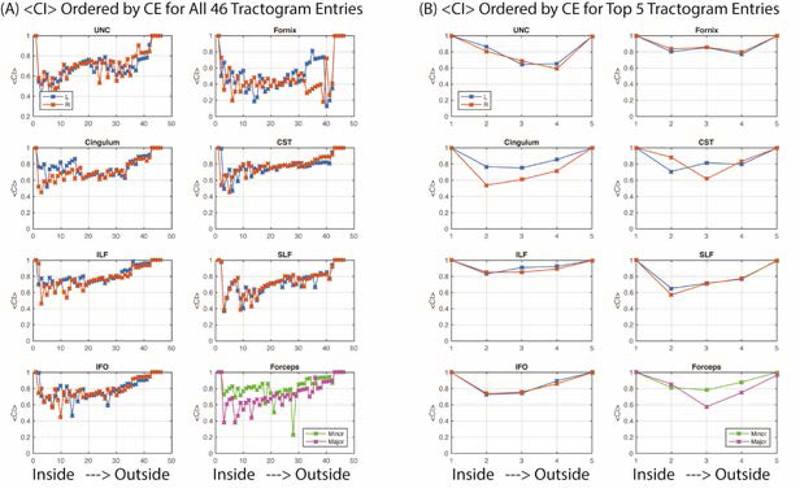
Statistical tests: Containment analysis was performed to assess if the submitted algorithms had containment within tracts of larger volume submissions. This also serves the purpose to detect if spurious submissions had been made.

Results: The top five submissions had high ICC and Dice >0.88. Reproducibility was high within the top five submissions when assessed across sessions or across scanners: 0.87-0.97. Containment analysis shows that the top five submissions are contained within larger volume submissions. From the total of 16 tracts as an outcome relatively the number of tracts with high, moderate, and low reproducibility were 8, 4, and 4.

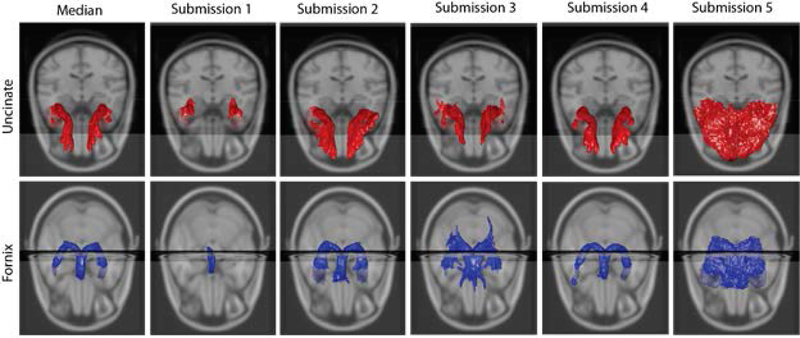
Data conclusion: The different methods clearly result in fundamentally different tract structures at the more conservative specificity choices. Data and challenge infrastructure remain available for continued analysis and provide a platform for comparison.

Level of evidence: 5 Technical Efficacy Stage: 1 J. Magn. Reson. Imaging 2020;51:234-249.

Keywords: DW-MRI; HARDI; challenge; in vivo; reproducibility; tractography.


Figures

Figure 1
Figure 1
The acquisition per session included five repeats of a single b0 and successively at b-values of 3000, 2000 and 1000 s/mm2 using 64, 48 and 20 gradient directions respectively. Each session was individually corrected using topup, eddy and then normalized. All the sessions were registered using flirt to the first session of scanner A.
Figure 2
Figure 2
Left: An overlay of all the 46 submissions from all sessions that were acquired using both scanners per tract Right: An overlay of a single submission using all sessions that were acquired using both scanners per tract A) Uncinate left B) Fornix left C) Cingulum eft D) Corticospinal tract left E) Inferior Longitudinal Fasciculus left F) Inferior Fronto-Occipital Fasciculus left G) Superior Longitudinal Fasciculus left H) Fminor.
Fig 3
Fig 3
A) Where the shape X is impeccably contained in Y and Y is contained in Z. The resulting containment CI(Y, X) = 1, CI(Z, X) = 1 and CI(Z, Y) = 1. B) Shape Y is a noisy representation of shape Z where CI(Y, Z) = 0.84. C) Shape Z is different from shape Y in a different orientation and the CI(Z,Y) = 0.17
Figure 4
Figure 4
Violin plots of intra-session submissions across both the scanners per tract. A) Dice similarity coefficients B) Intra-class correlation coefficients. The top row depicts the median of the top five intra session submissions. The tracts are in the following order (L/R): a) Uncinate b) Fornix c) Fminor & Fmajor d) Cingulum e) Corticospinal tract f) Inferior longitudinal fasciculus g) Superior longitudinal fasciculus h) Inferior fronto-occipital tract
Figure 5
Figure 5
Violin plots of inter-session submissions across both the scanners per tract. A) Dice similarity coefficients B) Intra-class correlation coefficients. The top row depicts the median of the top five inter session submissions. The tracts are in the following order (L/R): a) Uncinate b) Fornix c) Fminor & Fmajor d) Cingulum e) Corticospinal tract f) Inferior longitudinal fasciculus g) Superior longitudinal fasciculus h) Inferior fronto-occipital tract
Figure 6
Figure 6
Violin plots of inter-scanner submissions across both the scanners per tract. A) Dice similarity coefficients B) Intra-class correlation coefficients. The top row depicts the median of the top five inter scanner submissions. The tracts are in the following order (L/R): a) Uncinate b) Fornix c) Fminor & Fmajor d) Cingulum e) Corticospinal tract f) Inferior longitudinal fasciculus g) Superior longitudinal fasciculus h) Inferior fronto-occipital tract
Figure 7
Figure 7
First row shows the median of Uncinate (L/R) and the top five submissions. The second row shows the median and submissions of Fornix (L/R).
Figure 8
Figure 8
A) Quantifies the number of algorithms that used a specific part of the dataset or added more from other sources. B) Quantifies the usage of HARDI/Tensor methods by different tractography algorithms as a pre-step. C & D) Quantifies the step size and threshold angle parameter for tractography algorithms. E & F) Quantify the number of additional pre-processing and post-processing techniques applied for the tractography algorithms.
Figure 9
Figure 9
Ordering entries to minimize containment energy (CE) shows that containment index is generally lower for the volumetrically smaller tractograms (toward “inside” on each subplot) and increases for the larger tractograms (toward “outside” on each subplot). Variations in containment explained the least amount of entry variability for the UNC and Fornix, while the other tracts were more consistent. The containment between all methods (A) were more variable and lower than the containment for the top five methods (B).

References

    1. Basser PJ, Mattiello J, and LeBihan D, MR diffusion tensor spectroscopy and imaging. Biophysical journal, 1994. 66(1): p. 259–267. - PMC - PubMed
    1. Jeurissen B, et al., Diffusion MRI fiber tractography of the brain. NMR in Biomedicine, 2017. - PubMed
    1. Jeurissen B, et al., Investigating the prevalence of complex fiber configurations in white matter tissue with diffusion magnetic resonance imaging. Human brain mapping, 2013. 34(11): p. 2747–2766. - PMC - PubMed
    1. Tuch DS, Q-ball imaging. Magnetic resonance in medicine, 2004. 52(6): p. 1358–1372. - PubMed
    1. Tournier J-D, et al., Direct estimation of the fiber orientation density function from diffusion-weighted MRI data using spherical deconvolution. NeuroImage, 2004. 23(3): p. 1176–1185. - PubMed

Publication types