. 2019 Jun 10;17(6):e3000317.
doi: 10.1371/journal.pbio.3000317. eCollection 2019 Jun.

Sizes of actin networks sharing a common environment are determined by the relative rates of assembly

Affiliations

Sizes of actin networks sharing a common environment are determined by the relative rates of assembly

Adrien Antkowiak et al. PLoS Biol. .

Abstract

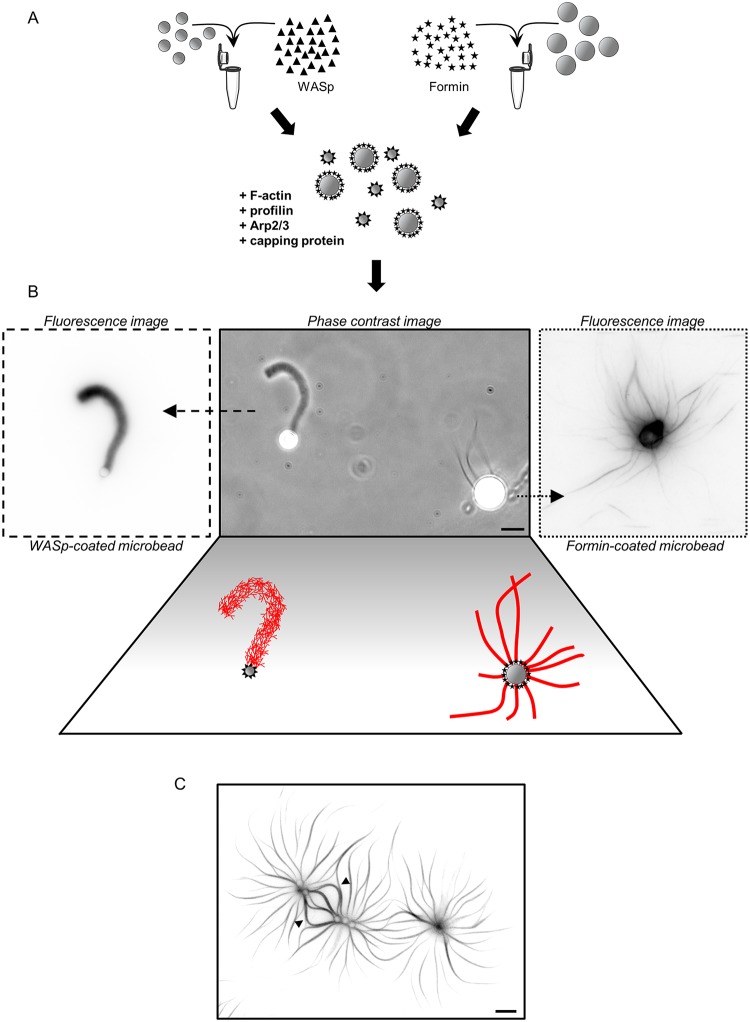
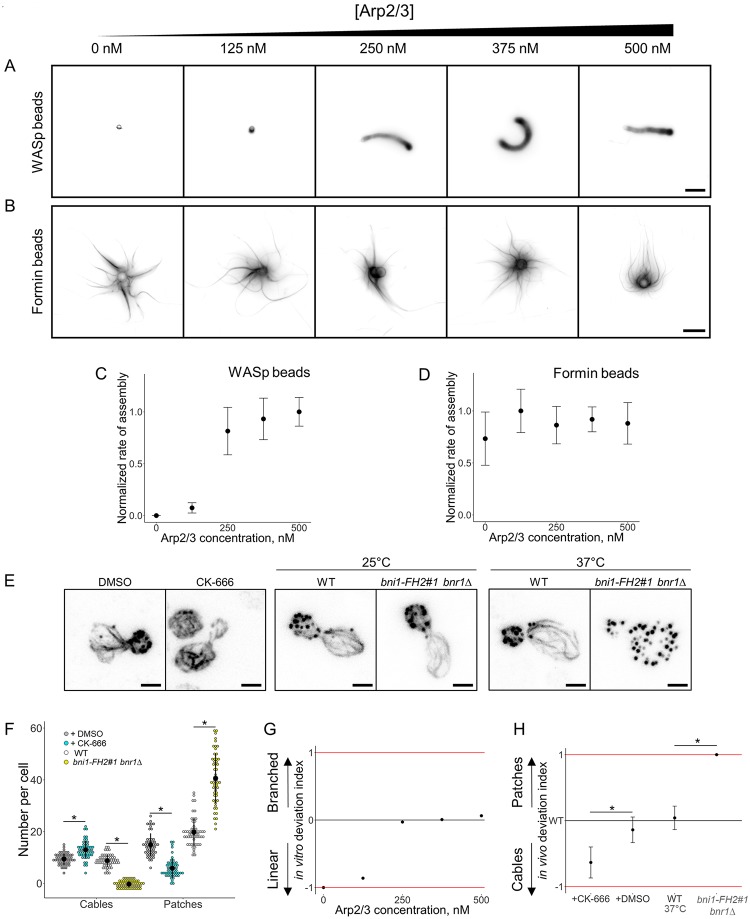
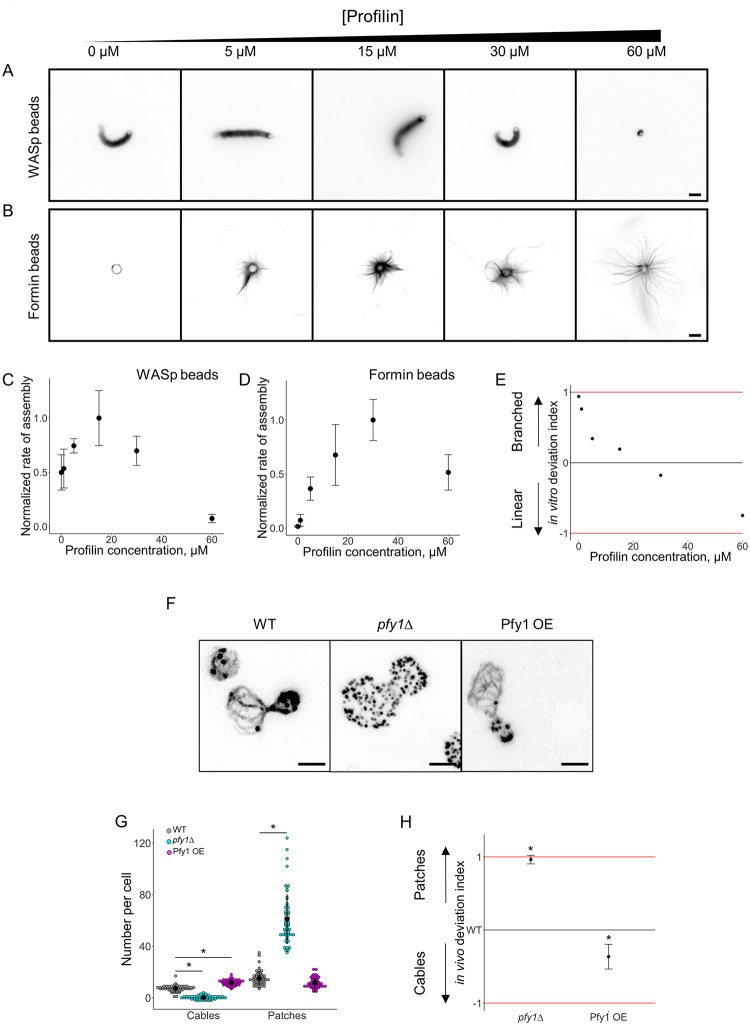
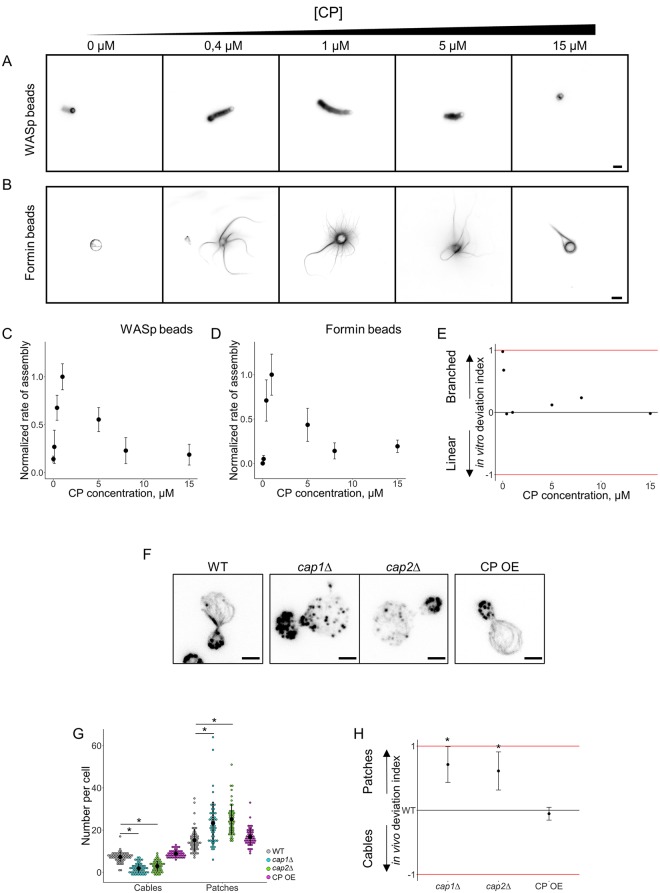
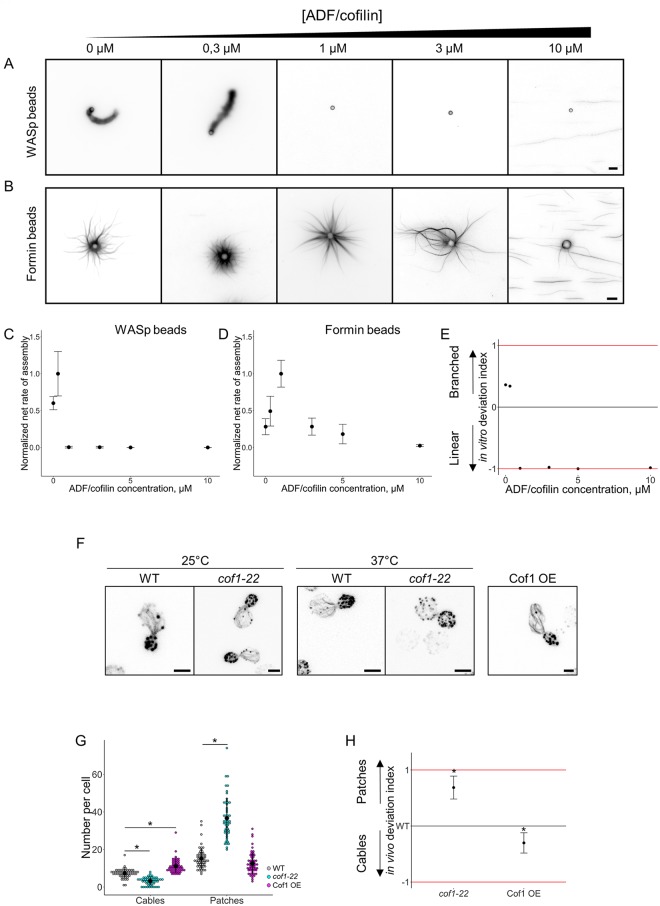
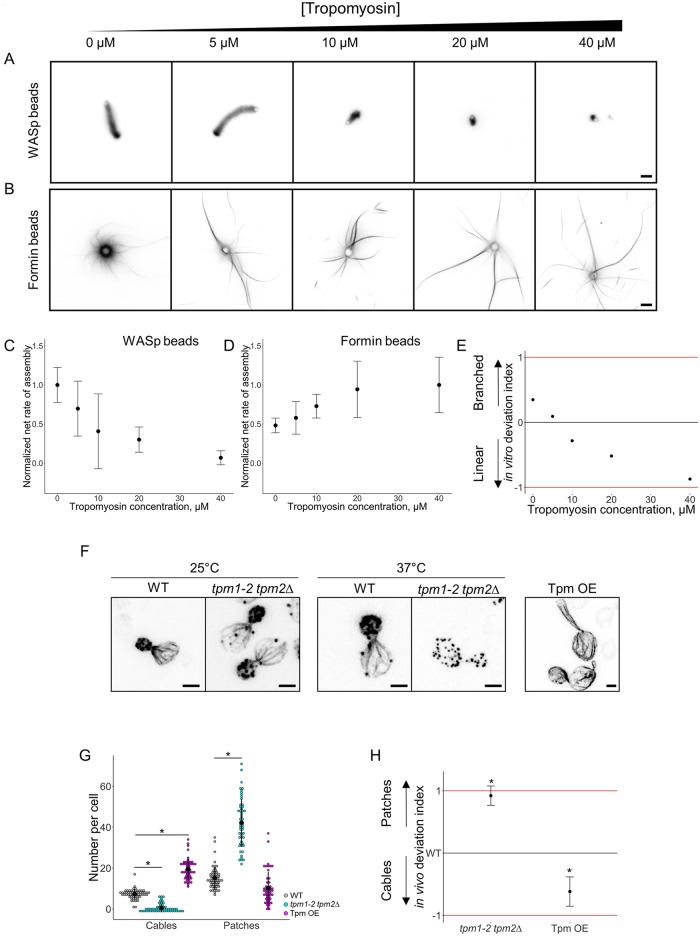
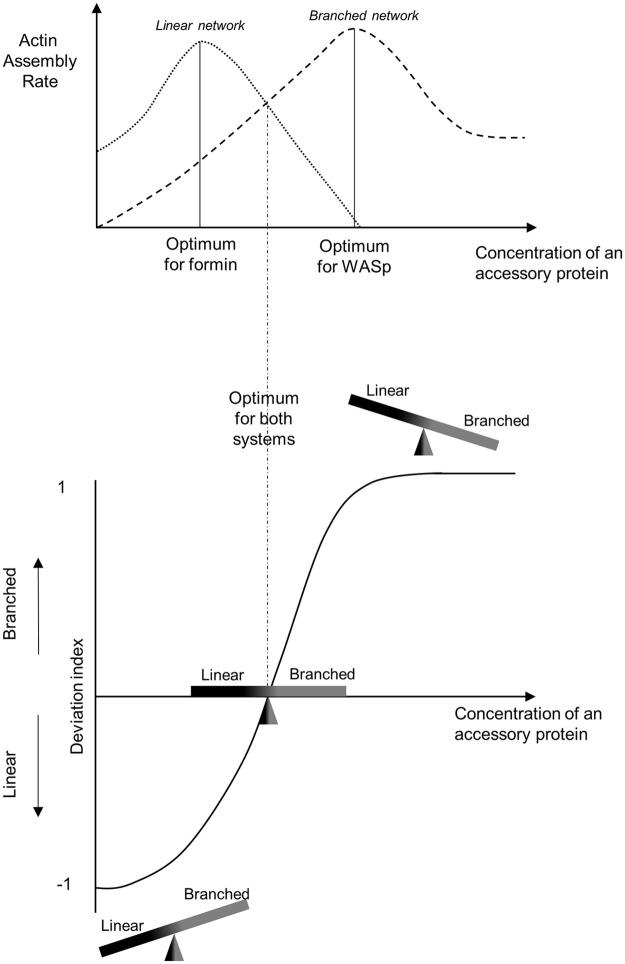
Within the cytoplasm of a single cell, several actin networks can coexist with distinct sizes, geometries, and protein compositions. These actin networks assemble in competition for a limited pool of proteins present in a common cellular environment. To predict how two distinct networks of actin filaments control this balance, the simultaneous assembly of actin-related protein 2/3 (Arp2/3)-branched networks and formin-linear networks of actin filaments around polystyrene microbeads was investigated with a range of actin accessory proteins (profilin, capping protein, actin-depolymerizing factor [ADF]/cofilin, and tropomyosin). Accessory proteins generally affected actin assembly rates for the distinct networks differently. These effects at the scale of individual actin networks were surprisingly not always correlated with corresponding loss-of-function phenotypes in cells. However, our observations agreed with a global interpretation, which compared relative actin assembly rates of individual actin networks. This work supports a general model in which the size of distinct actin networks is determined by their relative capacity to assemble in a common and competing environment.


Conflict of interest statement

The authors have declared that no competing interests exist.

Figures

Fig 1
Fig 1. Simultaneous assembly of branched and linear networks of actin filaments in vitro.
A. Schematic of experimental bead assay setup. B. Phase contrast and fluorescence snapshots of branched actin networks assembled around 2-μm diameter WASp-coated microbeads and linear actin networks assembled around 4-μm diameter formin-coated microbeads in the presence of fluorescent actin, Arp2/3 complex, profilin, and capping protein. Images were taken 30 min after the initiation of the experiment. Scale bar: 5 μm. C. Fluorescence snapshot of actin networks assembled around multiple formin-coated microbeads 45 min after the initiation of the experiment. Buckling events indicated by the black arrowheads. Scale bar: 10 μm. Arp2/3, actin-related protein 2/3; WASp, Wiskott–Aldrich syndrome protein.
Fig 2
Fig 2. Modulation of the branched-to-linear actin network balance by the Arp2/3 complex.
The underlying data can be found within S1 Data. A. Fluorescence snapshots of actin networks assembled around WASp-coated microbeads in the presence of fluorescent actin, profilin, capping protein, and variable concentrations of Arp2/3 complex. Images were taken 30 min after the initiation of the experiment. Scale bar: 5 μm. B. Fluorescence snapshots of actin networks assembled around formin-coated microbeads in the presence of fluorescent actin, profilin, capping protein, and variable concentrations of Arp2/3 complex. Images were taken 30 min after the initiation of the experiment. Scale bar: 5 μm. C. Quantification of (A). Rate of actin assembly around WASp-coated microbeads as a function of the Arp2/3 complex concentration, normalized to the maximum value. D. Quantification of (B). Rate of actin assembly around formin-coated microbeads as a function of the Arp2/3 complex concentration, normalized to the maximum value. E. Snapshots of the actin cytoskeleton organization in budding yeast cells fixed and labeled with fluorescent phalloidin, in the presence or in the absence of 200 μM CK-666 (left images), and for the formin defective mutant bni1-FH2#1 bnr1Δ at nonrestrictive temperature (25 °C; center images) or restrictive temperature (37 °C; right images). Scale bars: 2 μm. F. Quantification of (E). Average number of actin patches and cables per cell. G. In vitro deviation index, calculated as a function of the Arp2/3 complex concentration. This index compares how actin assembly rates around WASp and formin-coated beads deviate from a balanced situation in which both types of networks assemble optimally. H. In vivo deviation index, based on structures number, calculated in the presence of DMSO, 200 μM CK-666, at 37 °C for wild-type cells or at 37 °C for bni1-FH2#1 bnr1Δ cells. This index compares how the number of actin patches and cables deviate from the wild-type condition. Arp2/3, actin-related protein 2/3; CK-666, Arp2/3 complex inhibitor I; WASp, Wiskott–Aldrich syndrome protein.
Fig 3
Fig 3. Modulation of the branched-to-linear actin network balance by profilin.
The underlying data can be found within S1 Data. A. Fluorescence snapshots of actin networks assembled around WASp-coated microbeads in the presence of fluorescent actin, Arp2/3 complex, capping protein, and variable concentrations of profilin. Images were taken 30 min after the initiation of the experiment. Scale bar: 5 μm. B. Fluorescence snapshots of actin networks assembled around formin-coated microbeads in the presence of fluorescent actin, Arp2/3 complex, capping protein, and variable concentrations of profilin. Images were taken 30 min after the initiation of the experiment. Scale bar: 5 μm. C. Quantification of (A). Rate of actin assembly around WASp-coated microbeads as a function of the profilin concentration, normalized to the maximum value. D. Quantification of (B). Rate of actin assembly around formin-coated microbeads as a function of the profilin concentration, normalized to the maximum value. E. In vitro deviation index, calculated as a function of the profilin concentration. F. Snapshots of the actin cytoskeleton organization in wild-type, pfy1Δ, and Pfy1 overexpressing budding yeast cells fixed and labeled with fluorescent phalloidin. Scale bars: 2 μm. G. Quantification of (F). Average number of actin patches and cables per cell. H. In vivo deviation index for pfy1Δ and Pfy1 overexpressing cells. Arp2/3, actin-related protein 2/3; Pfy1, profilin; WASp, Wiskott–Aldrich syndrome protein.
Fig 4
Fig 4. Modulation of the branched-to-linear actin network balance by capping protein.
The underlying data can be found within S1 Data. A. Fluorescence snapshots of actin networks assembled around WASp-coated microbeads in the presence of fluorescent actin, Arp2/3 complex, profilin, and variable concentrations of capping protein. Images were taken 30 min after the initiation of the experiment. Scale bar: 5 μm. B. Fluorescence snapshots of actin networks assembled around formin-coated microbeads in the presence of fluorescent actin, Arp2/3 complex, profilin, and variable concentrations of capping protein. Images were taken 30 min after the initiation of the experiment. Scale bar: 5 μm. C. Quantification of (A). Rate of actin assembly around WASp-coated microbeads as a function of the capping protein concentration, normalized to the maximum value. D. Quantification of (B). Rate of actin assembly around formin-coated microbeads as a function of the capping protein concentration, normalized to the maximum value. E. In vitro deviation index, calculated as a function of the capping protein concentration. F. Snapshots of the actin cytoskeleton organization in wild-type, cap1Δ, cap2Δ, and capping protein overexpressing budding yeast cells fixed and labeled with fluorescent phalloidin. Scale bars: 2 μm. G. Quantification of (F). Average number of actin patches and cables per cell. H. In vivo deviation index for cap1Δ, cap2Δ, and capping protein overexpressing cells. Arp2/3, actin-related protein 2/3; WASp, Wiskott–Aldrich syndrome protein.
Fig 5
Fig 5. Modulation of the branched-to-linear actin network balance by ADF/cofilin.
The underlying data can be found within S1 Data. A. Fluorescence snapshots of actin networks assembled around WASp-coated microbeads in the presence of fluorescent actin, Arp2/3 complex, profilin, capping protein, and variable concentrations of ADF/cofilin. Images were taken 30 min after the initiation of the experiment. Scale bar: 5 μm. B. Fluorescence snapshots of actin networks assembled around formin-coated microbeads in the presence of fluorescent actin, Arp2/3 complex, profilin, capping protein, and variable concentrations of ADF/cofilin. Images were taken 30 min after the initiation of the experiment. Scale bar: 5 μm. C. Quantification of (A). Net rate of actin assembly around WASp-coated microbeads as a function of the ADF/cofilin concentration, normalized to the maximum value. D. Quantification of (B). Net rate of actin assembly around formin-coated microbeads as a function of the ADF/cofilin concentration, normalized to the maximum value. E. In vitro deviation index, calculated as a function of the ADF/cofilin concentration. F. Snapshots of the actin cytoskeleton organization of budding yeast cells fixed and labeled with fluorescent phalloidin for ADF/cofilin overexpressing cells (right image) and for cof1-22 cells at nonrestrictive (25 °C; left images) and restrictive (37 °C; center images) temperatures. Scale bars: 2 μm. G. Quantification of (F). Average number of actin patches and cables per cell in the wild-type, cof1-22 mutant, and ADF/cofilin overexpressing conditions. H. In vivo deviation index of ADF/cofilin overexpressing cells and cof1-22 cells at 37 °C. ADF, actin-depolymerizing factor; Arp2/3, actin-related protein 2/3; WASp, Wiskott–Aldrich syndrome protein.
Fig 6
Fig 6. Modulation of the branched-to-linear actin network balance by tropomyosin.
The underlying data can be found within S1 Data. A. Fluorescence snapshots of actin networks assembled around WASp-coated microbeads in the presence of fluorescent actin, Arp2/3 complex, profilin, capping protein, and variable concentrations of tropomyosin. Images were taken 30 min after the initiation of the experiment. Scale bar: 5 μm. B. Fluorescence snapshots of actin networks assembled around formin-coated microbeads in the presence of fluorescent actin, Arp2/3 complex, profilin, capping protein, and variable concentrations of tropomyosin. Images were taken 30 min after the initiation of the experiment. Scale bar: 5 μm. C. Quantification of (A). Net rate of actin assembly around WASp-coated microbeads as a function of the tropomyosin concentration, normalized to the maximum value. D. Quantification of (B). Net rate of actin assembly around formin-coated microbeads as a function of the tropomyosin concentration, normalized to the maximum value. E. In vitro deviation index, calculated as a function of the tropomyosin concentration. F. Snapshots of the actin cytoskeleton organization of budding yeast cells fixed and labeled with fluorescent phalloidin for tropomyosin overexpressing cells (right image) and for tpm1-2 tpm2Δ at nonrestrictive (25 °C; left images) and restrictive (37 °C; center images) temperatures. Scale bars: 2 μm. G. Quantification of (F). Average number of actin patches and cables per cell. H. In vivo deviation index of tropomyosin overexpressing cells and tpm1-2 tpm2Δ cells at 37°C. Arp2/3, actin-related protein 2/3; WASp, Wiskott–Aldrich syndrome protein.
Fig 7
Fig 7. Cartoon representing how the size of actin networks is controlled in a common and competing environment.
Results from this study indicate that actin assembly pathways (e.g., branched Arp2/3 and linear formin) do not have the same sensitivities to variable concentrations accessory proteins (upper panel). Principally, actin assembly rates vary differently and can span from cases in which only one type of network is able to assemble to cases in which they both assemble with similar efficiencies. Optimum concentrations of accessory proteins are also generally different for both pathways. Arp2/3, actin-related protein 2/3.

References

    1. Pollard TD. Actin and Actin-Binding Proteins. Cold Spring Harb Perspect Biol. 2016; a018226 10.1101/cshperspect.a018226 - DOI - PMC - PubMed
    1. Blanchoin L, Boujemaa-Paterski R, Sykes C, Plastino J. Actin Dynamics, Architecture, and Mechanics in Cell Motility. Physiol Rev. 2014;94: 235–263. 10.1152/physrev.00018.2013 - DOI - PubMed
    1. Burke TA, Christensen JR, Barone E, Suarez C, Sirotkin V, Kovar DR. Homeostatic actin cytoskeleton networks are regulated by assembly factor competition for monomers. Curr Biol. 2014;24: 579–585. 10.1016/j.cub.2014.01.072 - DOI - PMC - PubMed
    1. Suarez C, Kovar DR. Internetwork competition for monomers governs actin cytoskeleton organization. Nat Rev Mol Cell Biol. 2016;17: 799–810. 10.1038/nrm.2016.106 - DOI - PMC - PubMed
    1. Murugesan S, Hong J, Yi J, Li D, Beach JR, Shao L, et al. Formin-generated actomyosin arcs propel T cell receptor microcluster movement at the immune synapse. J Cell Biol. 2016;215: 383–399. 10.1083/jcb.201603080 - DOI - PMC - PubMed

Publication types

MeSH terms