. 2019 Jun 7;20(11):2792.
doi: 10.3390/ijms20112792.

Fibronectin Promotes Cell Growth and Migration in Human Renal Cell Carcinoma Cells

Affiliations

Fibronectin Promotes Cell Growth and Migration in Human Renal Cell Carcinoma Cells

Yen-Chuan Ou et al. Int J Mol Sci. .

Abstract

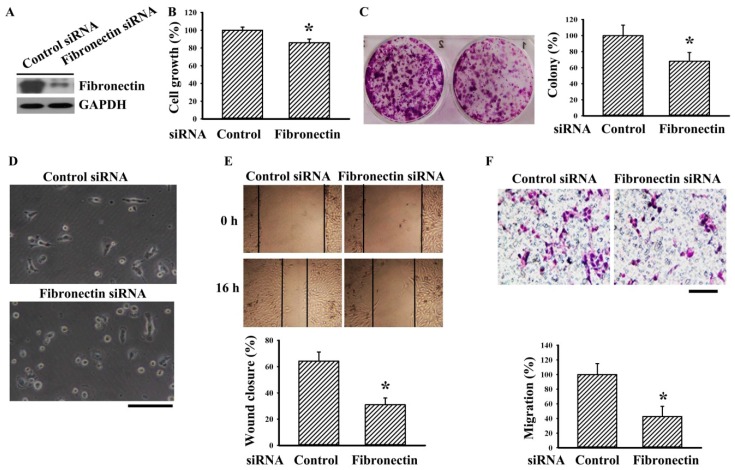
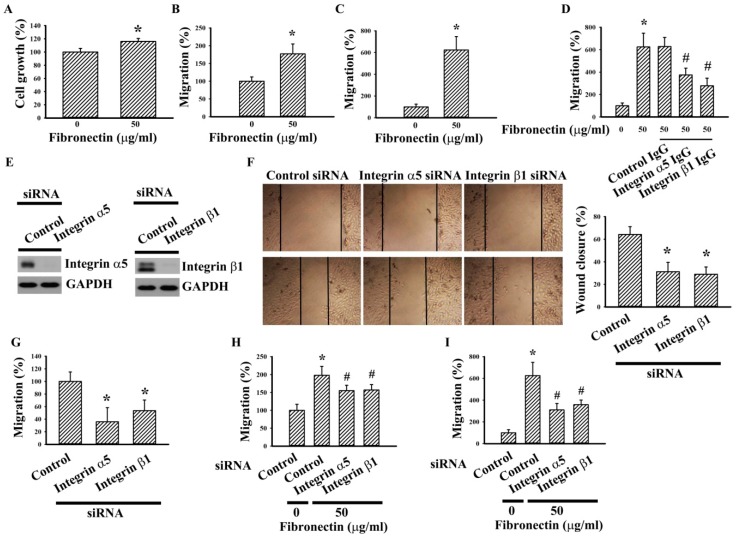
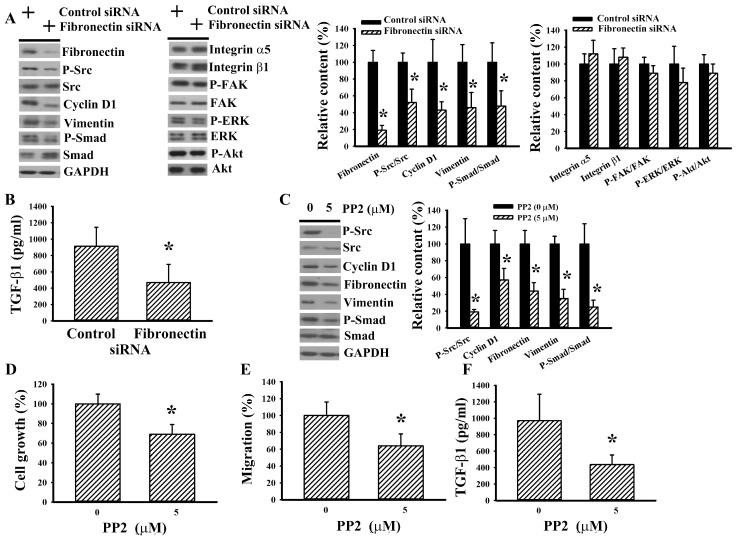
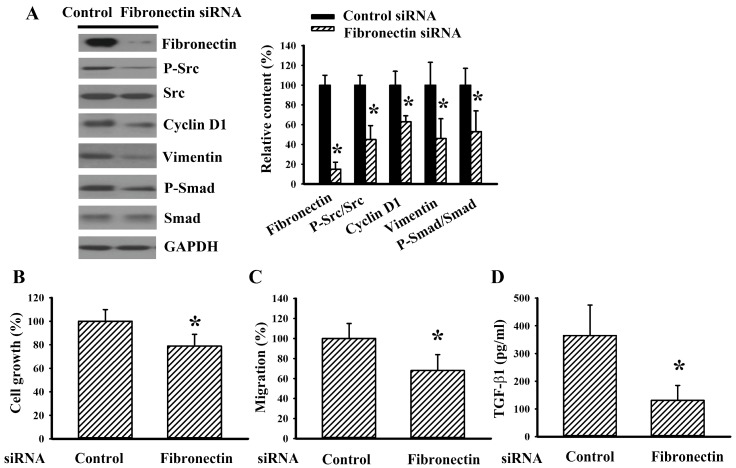
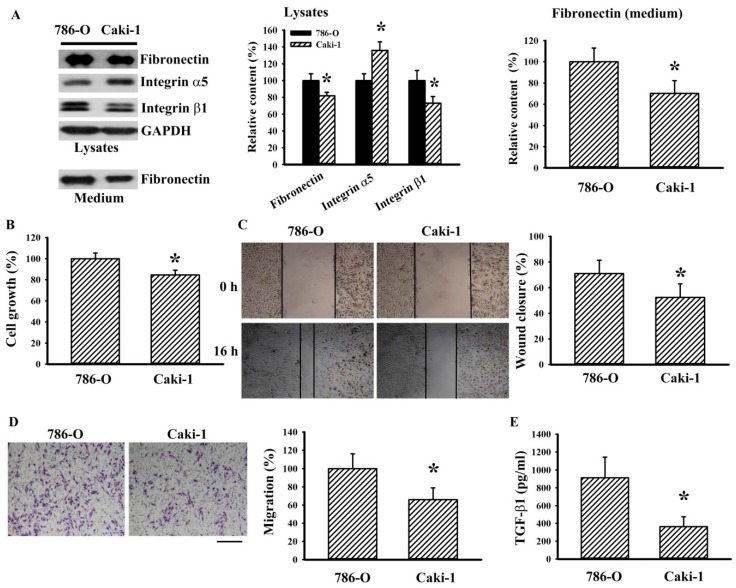
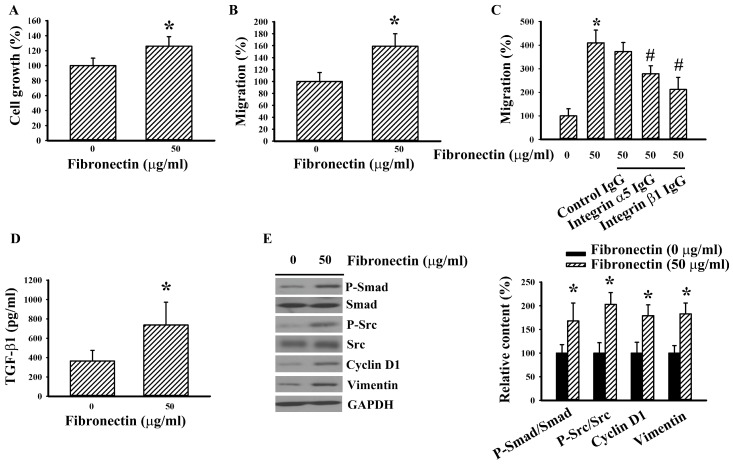
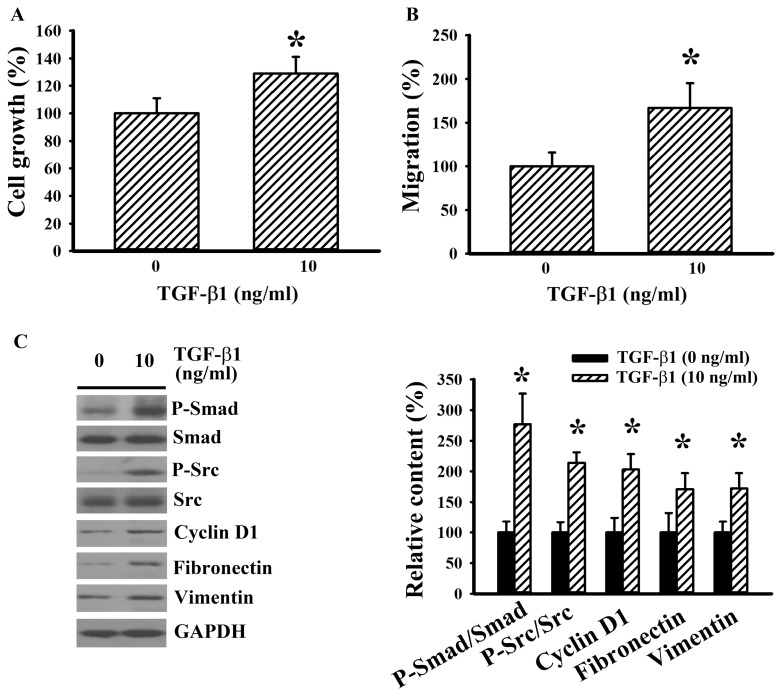
The prognostic and therapeutic values of fibronectin have been reported in patients with renal cell carcinoma (RCC). However, the underlying mechanisms of malignancy in RCC are not completely understood. We found that silencing of fibronectin expression attenuated human RCC 786-O and Caki-1 cell growth and migration. Silencing of potential fibronectin receptor integrin α5 and integrin β1 decreased 786-O cell ability in movement and chemotactic migration. Biochemical examination revealed a reduction of cyclin D1 and vimentin expression, transforming growth factor-β1 (TGF-β1) production, as well as Src and Smad phosphorylation in fibronectin-silenced 786-O and Caki-1 cells. Pharmacological inhibition of Src decreased 786-O cell growth and migration accompanied by a reduction of cyclin D1, fibronectin, vimentin, and TGF-β1 expression, as well as Src and Smad phosphorylation. In 786-O cells, higher activities in cell growth and migration than in Caki-1 cells were noted, along with elevated fibronectin and TGF-β1 expression. The additions of exogenous fibronectin and TGF-β1 promoted Caki-1 cell growth and migration, and increased cyclin D1, fibronectin, vimentin, and TGF-β1 expression, as well as Src and Smad phosphorylation. These findings highlight the role of fibronectin in RCC cell growth and migration involving Src and TGF-β1 signaling.

Keywords: extracellular matrix; fibronectin; motility; renal cell carcinoma.


Conflict of interest statement

The authors declare no conflict of interest.

Figures

Figure 1
Figure 1
Fibronectin silencing decreased cell growth and migration in 786-O cells. 786-O cells were transfected with control siRNA and fibronectin siRNA for 48 h. (A) Proteins were extracted and subjected to Western blot analysis with indicated antibodies. Representative blots are shown. (B) The resultant transfected cells were seeded onto 96-well plates. Twenty-four hours later, cell growth was measured by MTS reduction assay. (C) The resultant transfected cells were seeded onto six-well plates for seven days. Cell colonies were fixed and stained with crystal violet. Representative plates are shown. The numbers of cell colonies were calculated and depicted. (D) The resultant transfected cells were seeded onto six-well plates for 1 h. Cells were examined under a light microscope. Representative photomicrographs are shown. Scale bar = 50 μm. (E) The resultant transfected cells were seeded onto six-well plates for 24 h. When confluence was reached, cell movement was evaluated by a wound-healing assay for 16 h in the presence of 0.5% FBS. Representative photomicrographs are shown. Bar graphs show relative wound closure among groups. (F) The resultant transfected cells were seeded onto Transwell inserts and subjected to Transwell migration assay for 24 h. The lower chambers were filled with DMEM containing 10% FBS. Representative photomicrographs are shown. Scale bar = 50 μm. Bar graphs show quantitative results among groups and the value in the control siRNA group was defined as 100% (B, C, and F). * p < 0.05 vs. control siRNA group, n = 3.
Figure 2
Figure 2
Integrin α5 and integrin β1 silencing alleviated fibronectin effects in 786-O cells. (A) 786-O cells were seeded onto fibronectin (0 and 50 μg/mL)-coated 96-well plates. Twenty-four hours later, cell growth was measured by MTS reduction assay. (B) 786-O cells were seeded onto fibronectin (0 and 50 μg/mL)-coated Transwell inserts and subjected to Transwell migration assay for 24 h. The lower chambers were filled with DMEM containing 10% FBS. (C) 786-O cells were seeded onto Transwell inserts and subjected to Transwell migration assay for 24 h. The lower chambers were filled with DMEM containing fibronectin (0 or 50 μg/mL). (D) 786-O cells were first incubated with indicated IgG (5 μg/mL) for 30 min before seeding to the Transwell inserts for migration assay (24 h). The lower chambers were filled with DMEM containing fibronectin (0 or 50 μg/mL). (E) 786-O cells were transfected with control siRNA, integrin α5 siRNA, and integrin β1 siRNA for 48 h. Proteins were extracted and subjected to Western blot analysis with indicated antibodies. Representative blots are shown. (F) The resultant transfected cells were seeded onto six-well plates for 24 h. When confluence was reached, cell movement was evaluated by a wound-healing assay for 16 h in the presence of 0.5% FBS. Representative photomicrographs are shown. Bar graphs showed relative wound closure among groups. (G) The resultant transfected cells were seeded onto Transwell inserts and subjected to Transwell migration assay for 24 h. The lower chambers were filled with DMEM containing 10% FBS. (H) The resultant transfected cells were seeded onto fibronectin (0 and 50 μg/mL)-coated Transwell inserts and subjected to Transwell migration assay for 24 h. The lower chambers were filled with DMEM containing 10% FBS. (I) The resultant transfected cells were seeded onto Transwell inserts and subjected to Transwell migration assay for 24 h. The lower chambers were filled with DMEM containing fibronectin (0 and 50 μg/mL). Bar graphs show quantitative results among groups and the value in fibronectin (0 μg/mL)/control siRNA group was defined as 100% (AD, GI). * p < 0.05 vs. fibronectin (0 μg/mL)/control siRNA group and # p < 0.05 vs. fibronectin (50 μg/mL)/control siRNA group, n = 3.
Figure 3
Figure 3
Fibronectin silencing decreased intracellular Src signaling in 786-O cells. 786-O cells were transfected with control siRNA and fibronectin siRNA for 48 h. (A) Proteins were extracted and subjected to Western blot analysis with indicated antibodies. Representative blots are shown. (B) The resultant transfected cells were seeded onto 24-well plates. Twenty-four hours later, the supernatants were collected and subjected to ELISA for the measurement of TGF-β1. (C) 786-O cells were treated with PP2 (0 and 5 μM) for 5 h. Proteins were extracted and subjected to Western blot analysis with indicated antibodies. Representative blots are shown. (D) 786-O cells were treated with PP2 (0 and 5 μM) for 24 h. Cell growth was measured by MTS reduction assay. (E) 786-O cells were seeded onto Transwell inserts and subjected to Transwell migration assay for 24 h in the presence of PP2 (0 and 5 μM). The lower chambers were filled with DMEM containing 10% FBS. (F) 786-O cells were treated with PP2 (0 and 5 μM) for 24 h. The supernatants were collected and subjected to ELISA for the measurement of TGF-β1. Bar graphs show quantitative results among groups and the value in control siRNA/untreated group was defined as 100% (A, CE). * p < 0.05 vs. control siRNA/untreated group, n = 3.
Figure 4
Figure 4
Fibronectin silencing decreased cell growth and migration in Caki-1 cells. Caki-1 cells were transfected with control siRNA and fibronectin siRNA for 48 h. (A) Proteins were extracted and subjected to Western blot analysis with indicated antibodies. Representative blots are shown. (B) The resultant transfected cells were seeded onto 96-well plates. Twenty-four hours later, cell growth was measured by MTS reduction assay. (C) The resultant transfected cells were seeded onto Transwell inserts and subjected to Transwell migration assay for 24 h. The lower chambers were filled with DMEM containing 10% FBS. (D) The resultant transfected cells were seeded onto 24-well plates. Twenty-four hours later, the supernatants were collected and subjected to ELISA for the measurement of TGF-β1. Bar graphs showed quantitative results among groups and the value in control siRNA group was defined as 100% (AC). * p < 0.05 vs. control siRNA group, n = 3.
Figure 5
Figure 5
Cell growth and migration potential of RCC cells were associated with fibronectin. (A) 786-O and Caki-1 cells were seeded onto six-well plates and cultured for 24 h. Proteins were extracted from subconfluent (80%) cells (Lysates) and supernatants (Medium, 20 μL) and subjected to Western blot analysis with indicated antibodies. Representative blots are shown. (B) 786-O and Caki-1 cells were seeded onto 96-well plates. Twenty-four hours later, cell growth was measured by MTS reduction assay. (C) 786-O and Caki-1 cells were seeded onto six-well plates for 24 h. When reaching confluence, cell movement was evaluated by a wound-healing assay for 16 h in the presence of 0.5% FBS. Representative photomicrographs are shown. Bar graphs show relative wound closure among groups. (D). 786-O and Caki-1 cells were seeded onto Transwell inserts and subjected to Transwell migration assay for 24 h. The lower chambers were filled with DMEM containing 10% FBS. Representative photomicrographs are shown. Scale bar = 100 μm. (E) 786-O and Caki-1 cells were seeded onto 24-well plates. Twenty-four hours later, the supernatants were collected and subjected to ELISA for the measurement of TGF-β1. Bar graphs show quantitative results among groups and the value in 786-O group was defined as 100% (A,B,D). * p < 0.05 vs. 786-O group, n = 3.
Figure 6
Figure 6
Fibronectin increased cell growth and migration in Caki-1 cells. (A) Caki-1 cells were seeded onto fibronectin (0 and 50 μg/mL)-coated 96-well plates. Twenty-four hours later, cell growth was measured by MTS reduction assay. (B) Caki-1 cells were seeded onto fibronectin (0 and 50 μg/mL)-coated Transwell inserts and subjected to Transwell migration assay for 24 h. The lower chambers were filled with DMEM containing 10% FBS. (C) Caki-1 cells were first incubated with indicated IgG (5 μg/mL) for 30 min before seeding to the Transwell inserts for migration assay (24 h). The lower chambers were filled with DMEM containing fibronectin (0 or 50 μg/mL). (D) Caki-1 cells were seeded onto fibronectin (0 and 50 μg/mL)-coated 24-well plates. Twenty-four hours later, the supernatants were collected and subjected to ELISA for the measurement of TGF-β1. (E) Caki-1 cells were seeded onto fibronectin (0 and 50 μg/mL)-coated six-well plates for 5 h. Proteins were extracted and subjected to Western blot analysis with indicated antibodies. Representative blots are shown. Bar graphs show quantitative results among groups and the value in uncoated group was defined as 100% (AC, and E). * p < 0.05 vs. uncoated control and # p < 0.05 vs. fibronectin (50 μg/mL) untreated control, n = 3.
Figure 7
Figure 7
TGF-β1 increased cell growth and migration in Caki-1 cells. (A) Caki-1 cells were treated with TGF-β1 (0 and 10 ng/mL) for 24 h. Cell growth was measured by MTS reduction assay. (B) Caki-1 cells were seeded onto Transwell inserts and subjected to Transwell migration assay for 24 h in the presence of TGF-β1 (0 and 10 ng/mL). The lower chambers were filled with DMEM containing 10% FBS. (C) Caki-1 cells were treated with TGF-β1 (0 and 10 ng/mL) for 5 h. Proteins were extracted and subjected to Western blot analysis with indicated antibodies. Representative blots are shown. Bar graphs show quantitative results among groups and the value in untreated group was defined as 100% (AC). * p < 0.05 vs. untreated control, n = 3.
Figure 8
Figure 8
Hypoxia increased RCC cell migration. (A) 786-O cells were seeded onto Transwell inserts and subjected to Transwell migration assay in a normoxia or hypoxia incubator (1% O2, 5% CO2, and 94% N2) for 8 h. The lower chambers were filled with DMEM containing 10% FBS. (B) 786-O cells were placed in a normoxia or hypoxia incubator (1% O2, 5% CO2, and 94% N2) for 8 h. Proteins were extracted and subjected to Western blot analysis with indicated antibodies. Representative blots are shown. (C) Caki-1 cells were seeded onto Transwell inserts and subjected to Transwell migration assay in a normoxia or hypoxia incubator (1% O2, 5% CO2, and 94% N2) for 8 h. The lower chambers were filled with DMEM containing 10% FBS. (D) Caki-1 cells were placed in a normoxia or hypoxia incubator (1% O2, 5% CO2, and 94% N2) for 8 h. Proteins were extracted and subjected to Western blot analysis with indicated antibodies. Representative blots are shown. Bar graphs show quantitative results among groups and the value in normoxia group was defined as 100% (AD). * p < 0.05 vs. normoxia control, n = 3.

Similar articles

Cited by

References

    1. Najjar Y.G., Rini B.I. Novel agents in renal carcinoma: A reality check. Ther. Adv. Med. Oncol. 2012;4:183–194. doi: 10.1177/1758834012443725. - DOI - PMC - PubMed
    1. Stadler W.M. Targeted agents for the treatment of advanced renal cell carcinoma. Cancer. 2005;104:2323–2333. doi: 10.1002/cncr.21453. - DOI - PubMed
    1. Gupta K., Miller J.D., Li J.Z., Russell M.W., Charbonneau C. Epidemiologic and socioeconomic burden of metastatic renal cell carcinoma (mRCC): A literature review. Cancer Treat. Rev. 2008;34:193–205. doi: 10.1016/j.ctrv.2007.12.001. - DOI - PubMed
    1. Jemal A., Bray F., Center M.M., Ferlay J., Ward E., Forman D. Global cancer statistics. CA Cancer J. Clin. 2011;61:69–90. doi: 10.3322/caac.20107. - DOI - PubMed
    1. Deep G., Kumar R., Jain A.K., Agarwal C., Agarwal R. Silibinin inhibits fibronectin induced motility, invasiveness and survival in human prostate carcinoma PC3 cells via targeting integrin signaling. Mutat. Res. 2014;768:35–46. doi: 10.1016/j.mrfmmm.2014.05.002. - DOI - PMC - PubMed

MeSH terms