. 2019 Jun 7;10(6):433.
doi: 10.3390/genes10060433.

BarkBase: Epigenomic Annotation of Canine Genomes

Affiliations

BarkBase: Epigenomic Annotation of Canine Genomes

Kate Megquier et al. Genes (Basel). .

Abstract

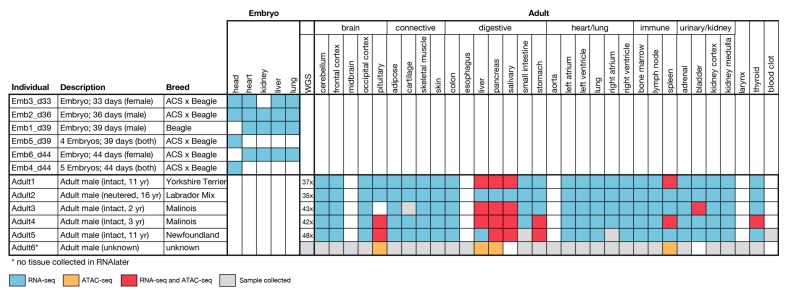
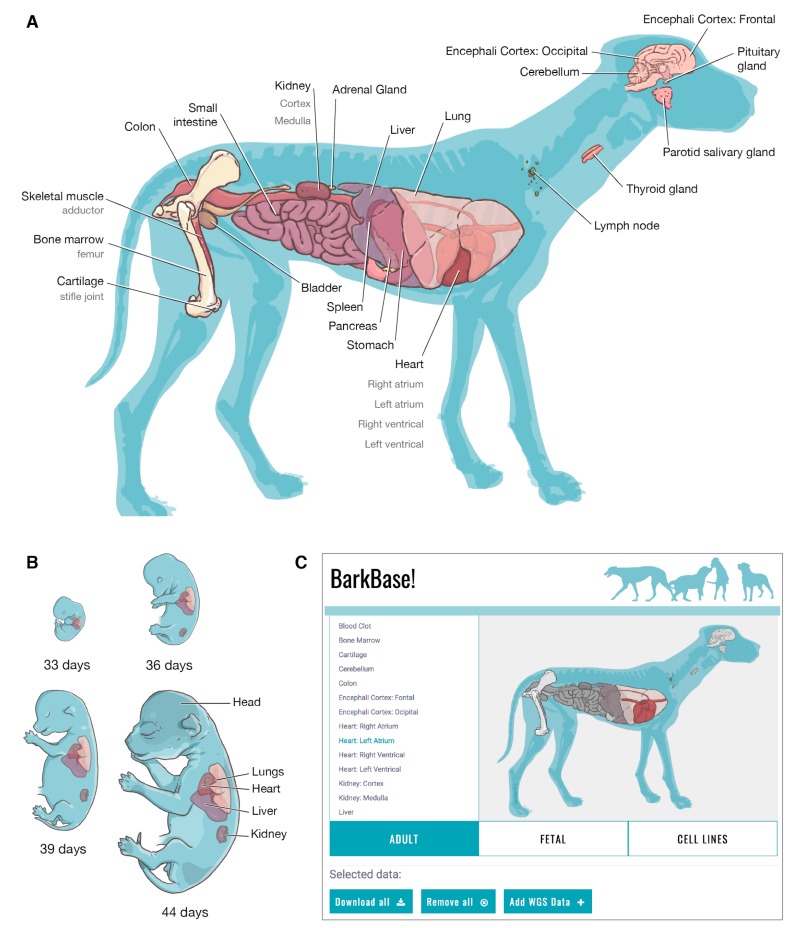
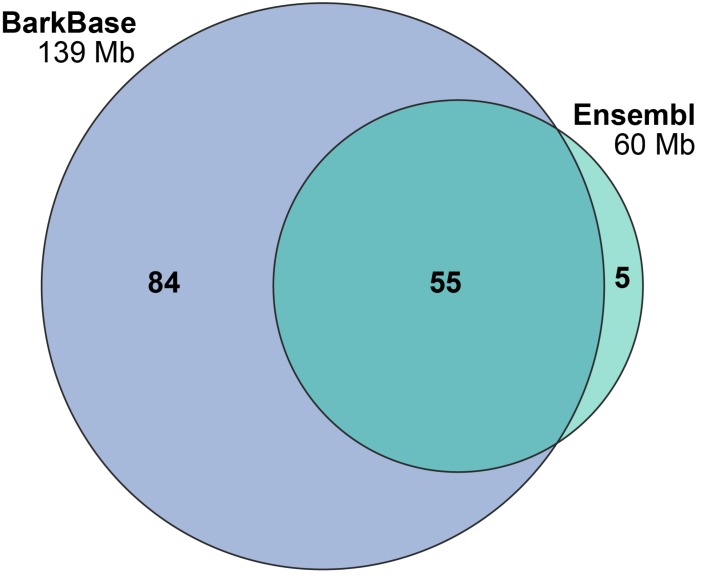
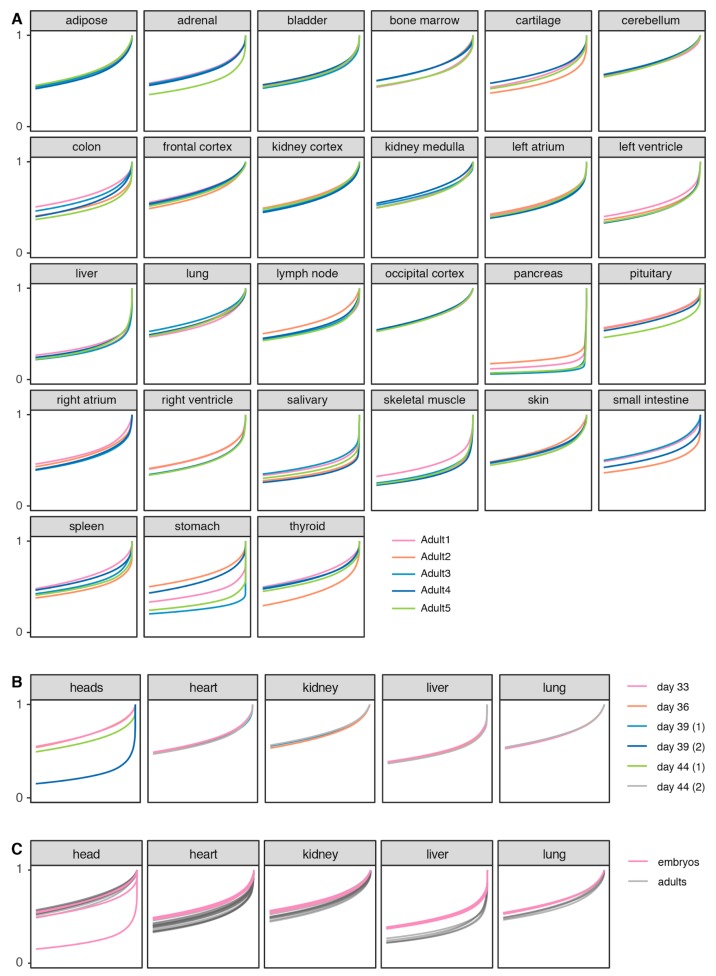
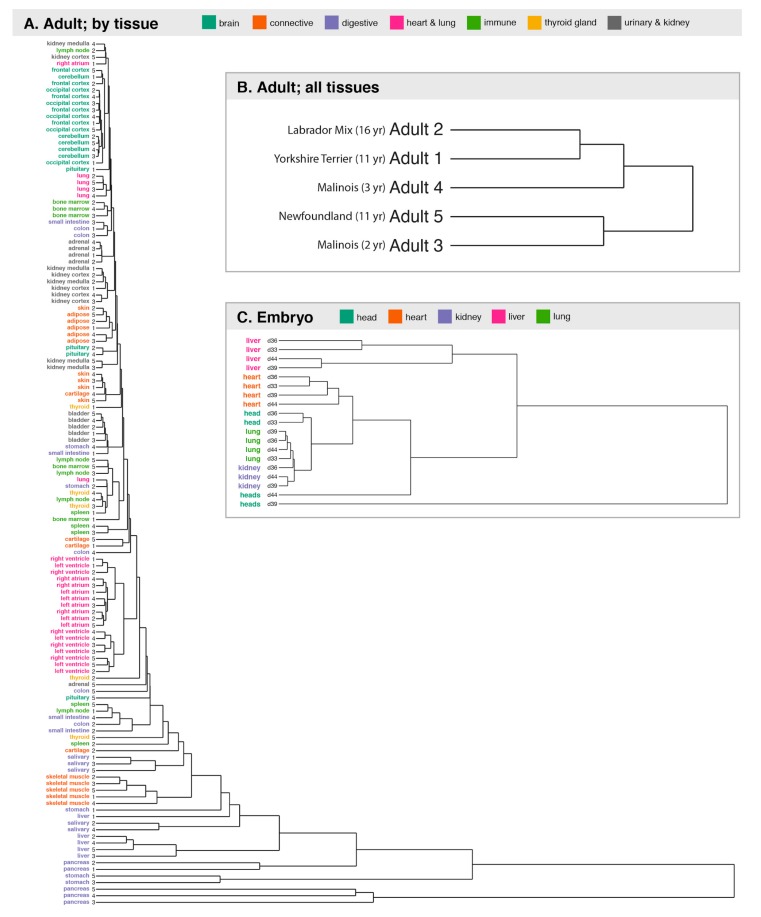
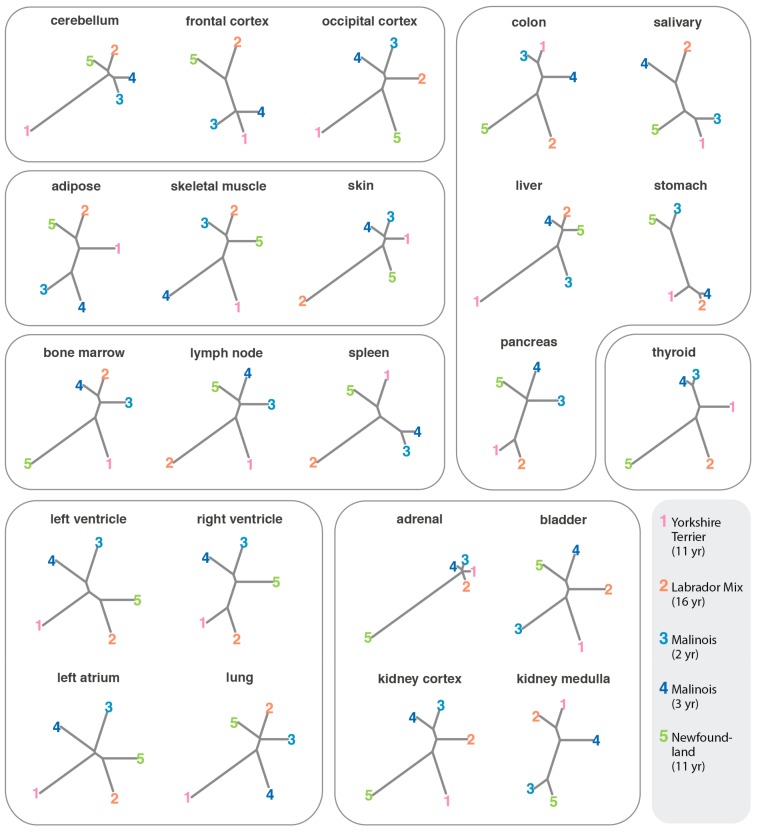
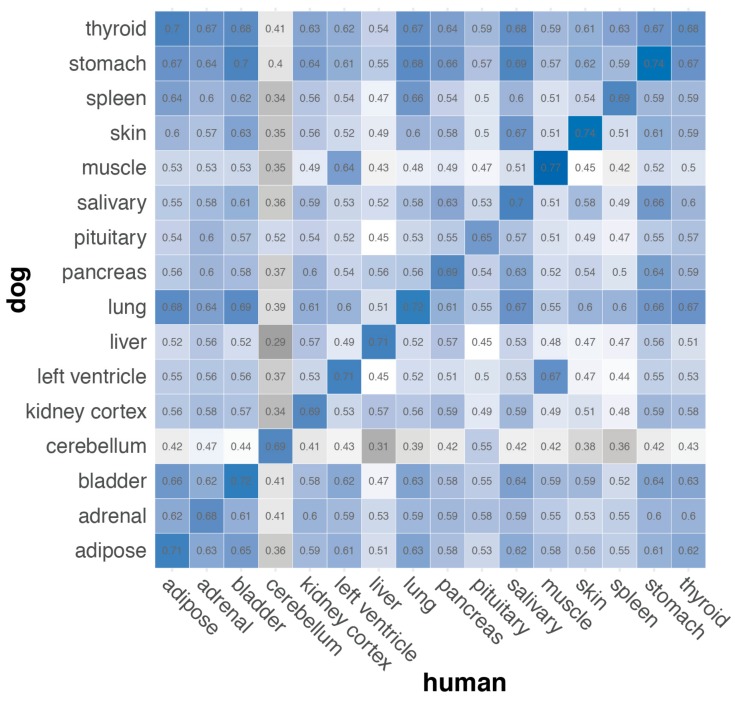
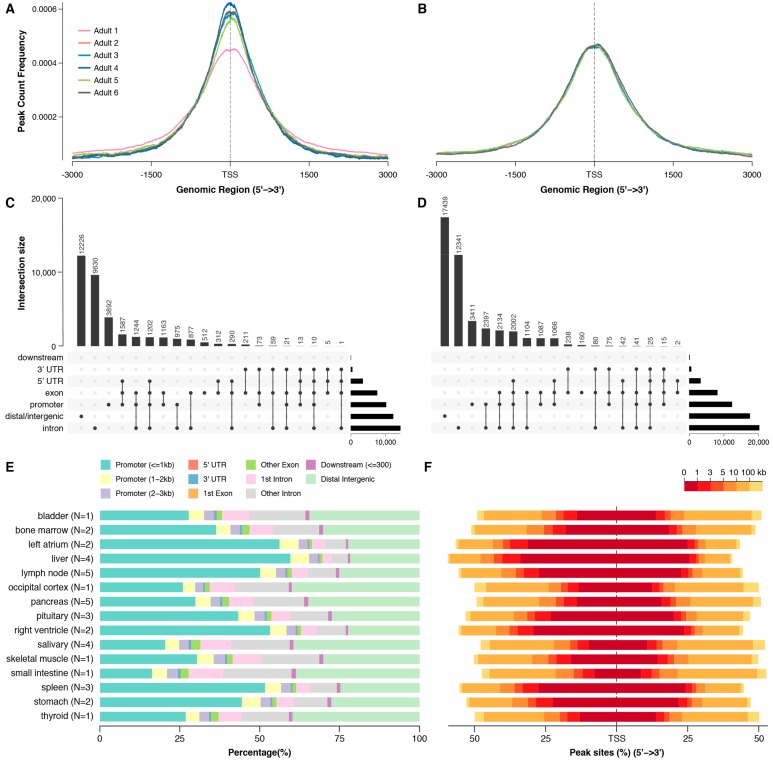
Dogs are an unparalleled natural model for investigating the genetics of health and disease, particularly for complex diseases like cancer. Comprehensive genomic annotation of regulatory elements active in healthy canine tissues is crucial both for identifying candidate causal variants and for designing functional studies needed to translate genetic associations into disease insight. Currently, canine geneticists rely primarily on annotations of the human or mouse genome that have been remapped to dog, an approach that misses dog-specific features. Here, we describe BarkBase, a canine epigenomic resource available at barkbase.org. BarkBase hosts data for 27 adult tissue types, with biological replicates, and for one sample of up to five tissues sampled at each of four carefully staged embryonic time points. RNA sequencing is complemented with whole genome sequencing and with assay for transposase-accessible chromatin using sequencing (ATAC-seq), which identifies open chromatin regions. By including replicates, we can more confidently discern tissue-specific transcripts and assess differential gene expression between tissues and timepoints. By offering data in easy-to-use file formats, through a visual browser modeled on similar genomic resources for human, BarkBase introduces a powerful new resource to support comparative studies in dogs and humans.

Keywords: ATAC-seq; RNA-seq; annotation; canine; comparative; dog; epigenomic; expression; genome.


Conflict of interest statement

The authors declare no conflict of interest. The funders had no role in the design of the study; in the collection, analyses, or interpretation of data; in the writing of the manuscript, or in the decision to publish the results.

Figures

Figure 1
Figure 1
BarkBase sample collection and data production. Samples were collected from a total of six embryos, and six adult dogs. BarkBase currently contains RNA-seq data from up to five tissues in d33, d36, d39, and d44 embryos, and from up to 27 tissues sampled from each of five adult dogs diverse in age and in breed ancestry. ATAC-seq data are currently available for eight tissues from a subset of individuals. Additional data sets will be posted as they become available.
Figure 2
Figure 2
The BarkBase web portal. The BarkBase web portal enables download of whole genome sequence (WGS) data, RNA-seq data, and assay for transposase-accessible chromatin using sequencing (ATAC-seq) data for (A) up to 27 tissues from each of the five adult dogs; and (B) up to five tissues from canine embryos collected at each of the four staged gestational timepoints. Reads preprocessed and aligned to CanFam3.1 are available at BarkBase.org. From the BarkBase interface (C), users can readily select specific tissues and samples. Raw read data from RNA-seq and ATAC-seq is available through the Sequence Read Archive (SRA) (Table S1).
Figure 3
Figure 3
BarkBase captures novel transcripts. Overlapping the transcriptome from BarkBase and Ensembl shows most bases are captured in both datasets. BarkBase contains 84 Mb of transcribed sequence not included in the existing annotation, highlighting its utility to improve the annotation of the canine genome.
Figure 4
Figure 4
Cumulative transcriptome expression is matched to tissue type. Cumulative sum of fraction of tissue-specific transcriptomes represented by individual genes in (A) canine embryos at four gestational time points; and (B) up to five individual adult dogs. Single-gene counts per million (CPM) values were divided by sample-sum CPM, sorted in increasing order, and the cumulative sum calculated. Cumulative values are shown for the 1000 top-expressed genes in each sample. Data sampled from a given embryonic tissue at different gestational time points are very similar, perhaps reflecting the fairly narrow time window of sampling. Combining data from adult and embryonic samples (C) reveals strong similarity of data from given tissue types across individuals and developmental stages.
Figure 5
Figure 5
Transcriptome data from five individuals clusters primarily by tissue type. Hierarchical clustering of RNA-seq data from (A) single tissues of five adult dogs; (B) five adult dogs, based on data concatenated across 21 tissues; and (C) embryonic tissues sampled at four gestational time points. Clustering is based on Euclidean distances among samples. Overall, in data from both adults and embryos, samples of a given tissue cluster across individuals. As observed in cumulative analysis, embryonic samples of a given tissue type cluster despite variation in gestational time points, perhaps reflecting the fairly narrow time window of sampling.
Figure 6
Figure 6
The relationship between samples within a single tissue type is highly variable. Clustering is based on Euclidean distances among samples, with no consistent clustering by age or breed observed. Outlines group tissues of a given class.
Figure 7
Figure 7
Gene expression levels correlate between dog and human tissues. Heatmap showing Spearman correlation between the genes expressed in canine and human tissues, after filtering for minimum expression (median CPM > 1) and unique orthology mapping between species. In all cases except one (dog thyroid), comparison of dog tissue to the corresponding human tissue had the highest Spearman coefficient, suggesting broad conservation of the transcriptome in these tissues across species.
Figure 8
Figure 8
ATAC-seq maps transposase-accessible chromatin in canine tissues. Analysis of the two tissue types with ATAC-seq data for five individuals, pancreas (A) and salivary gland (B), reveals strong enrichment of peaks around known transcription start sites. This enrichment is consistent across individuals. Annotating the ATAC-seq peaks with ChIPseeker, using the Ensembl annotation of dog, shows, as expected, an overlap with known promoters in both (C) the pancreas (n ≅ 10,000) and (D) salivary gland (n ≅ 12,000), but there are more peaks in distal/intergenic regions, potentially marking novel promoters or distal regulatory elements. (E) Across all tissues, ATAC-seq peaks are most likely to be in annotated promoters, but a large proportion are far from genes. (F) In all tissues, the enrichment for ATAC-seq peaks falls off rapidly with increasing distance from a TSS.
Figure 9
Figure 9
Integrating ATAC-seq with RNA-seq data can help validate novel genes. (A) Of the 44 novel genes expressed in the pancreas, most are less than 25 kb from a pancreas ATAC-seq peak. For those closest to ATAC-seq peaks, integrating RNA-seq and ATAC-seq provides additional evidence that they are real genes. (B) 58 novel genes expressed in the salivary gland (including 15 also expressed in pancreas) do not cluster as closely to pancreas ATAC-seq peaks, suggesting tissue specificity. (C) 491 novel genes not expressed in the pancreas are much more dispersed relative to the ATAC-seq peaks in the pancreas.

Similar articles

Cited by

References

    1. Schiffman J.D., Breen M. Comparative oncology: What dogs and other species can teach us about humans with cancer. Philos. Trans. R. Soc. Lond. B Biol. Sci. 2015;370:20140231. doi: 10.1098/rstb.2014.0231. - DOI - PMC - PubMed
    1. Noh H.J., Tang R., Flannick J., O’Dushlaine C., Swofford R., Howrigan D., Genereux D.P., Johnson J., van Grootheest G., Grünblatt E., et al. Integrating evolutionary and regulatory information with a multispecies approach implicates genes and pathways in obsessive-compulsive disorder. Nat. Commun. 2017;8:774. doi: 10.1038/s41467-017-00831-x. - DOI - PMC - PubMed
    1. Wilbe M., Jokinen P., Truvé K., Seppala E.H., Karlsson E.K., Biagi T., Hughes A., Bannasch D., Andersson G., Hansson-Hamlin H., et al. Genome-wide association mapping identifies multiple loci for a canine SLE-related disease complex. Nat. Genet. 2010;42:250–254. doi: 10.1038/ng.525. - DOI - PubMed
    1. Karlsson E.K., Sigurdsson S., Ivansson E., Thomas R., Elvers I., Wright J., Howald C., Tonomura N., Perloski M., Swofford R., et al. Genome-wide analyses implicate 33 loci in heritable dog osteosarcoma, including regulatory variants near CDKN2A/B. Genome Biol. 2013;14:R132. doi: 10.1186/gb-2013-14-12-r132. - DOI - PMC - PubMed
    1. Schoenebeck J.J., Ostrander E.A. Insights into morphology and disease from the dog genome project. Annu. Rev. Cell Dev. Biol. 2014;30:535–560. doi: 10.1146/annurev-cellbio-100913-012927. - DOI - PMC - PubMed

Publication types

LinkOut - more resources