

TTYH1 and TTYH2 Serve as LRRC8A-Independent Volume-Regulated Anion Channels in Cancer Cells
- PMID: 31181821
- PMCID: PMC6628158
- DOI: 10.3390/cells8060562
TTYH1 and TTYH2 Serve as LRRC8A-Independent Volume-Regulated Anion Channels in Cancer Cells
Abstract
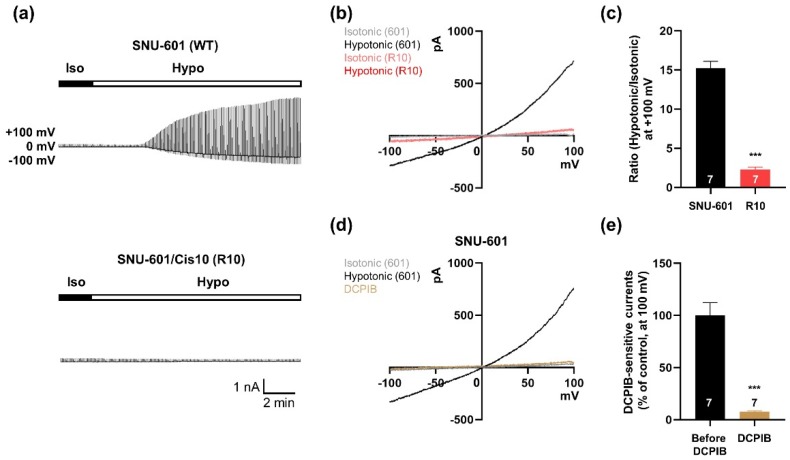
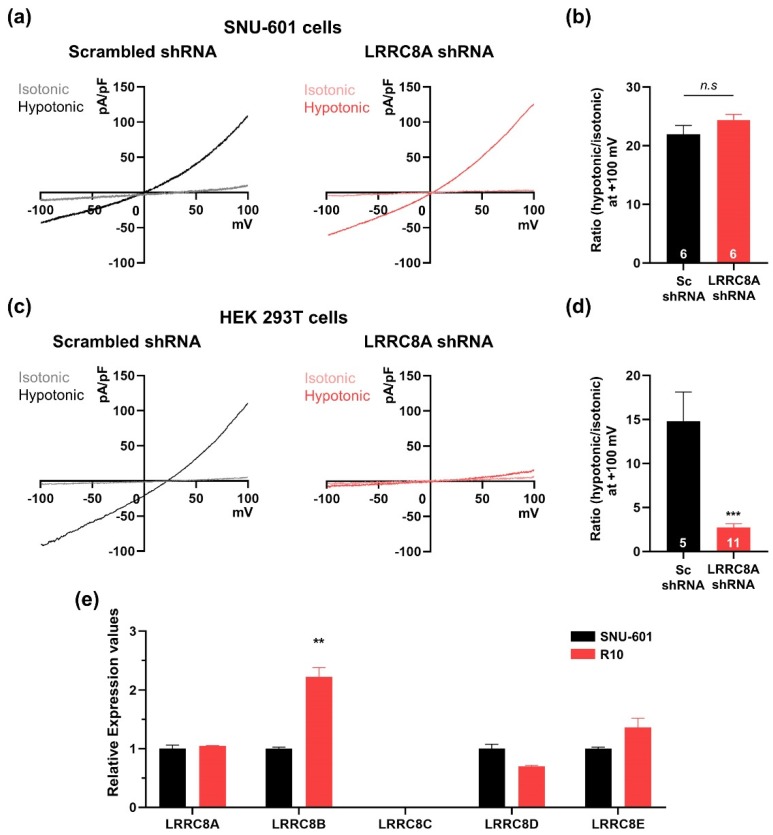
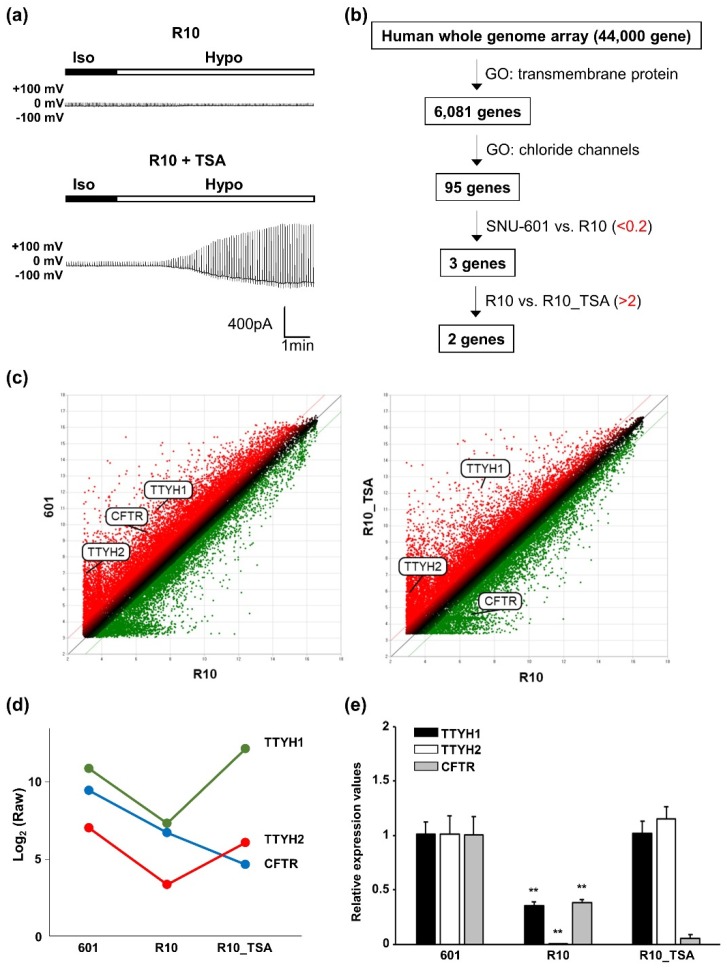
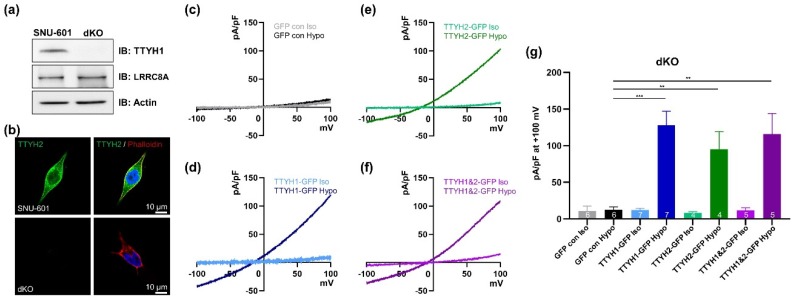
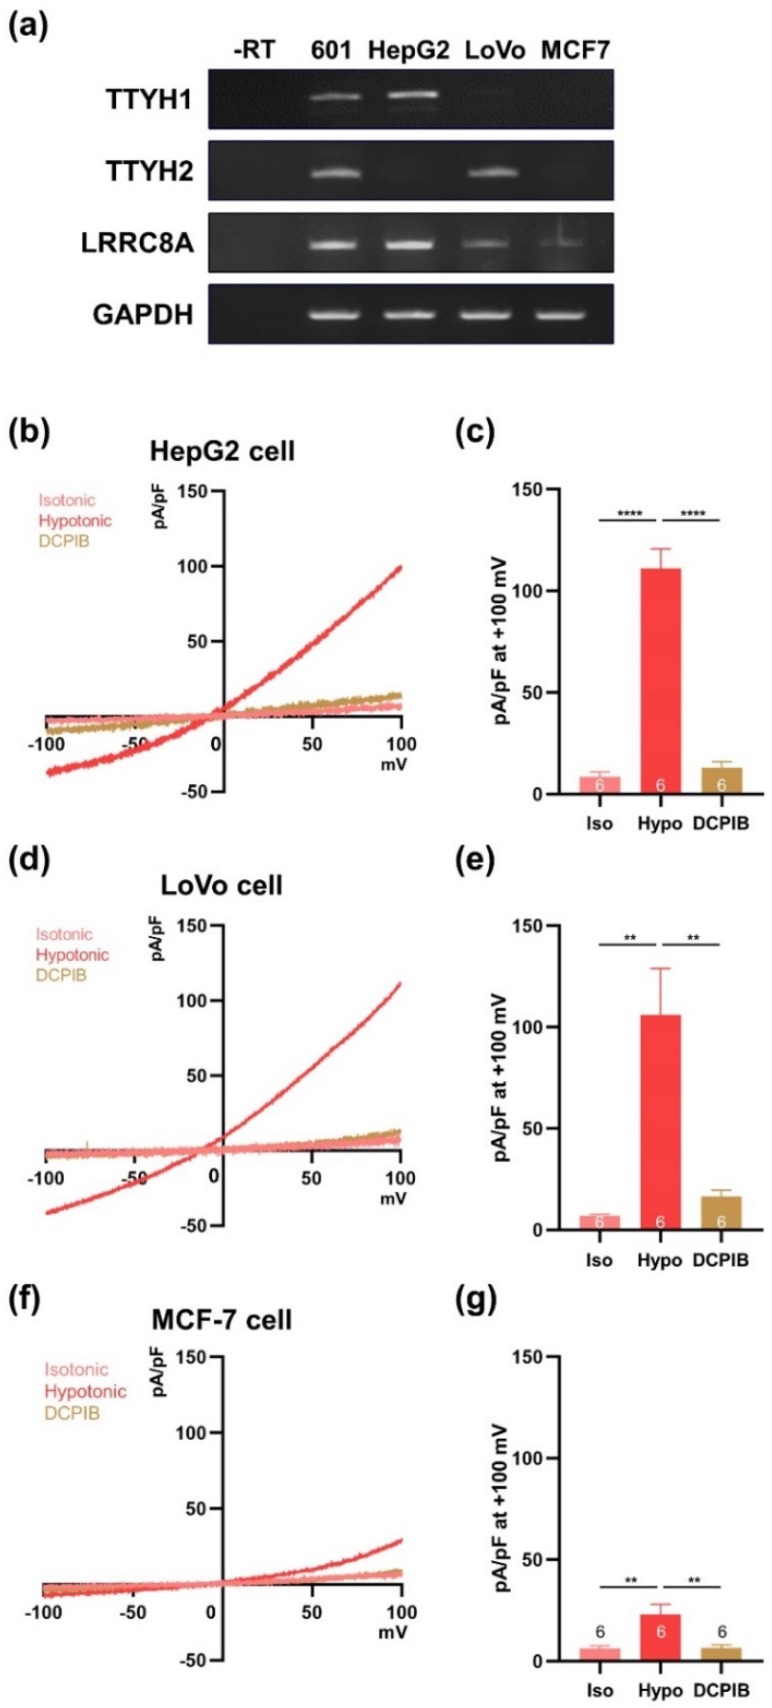
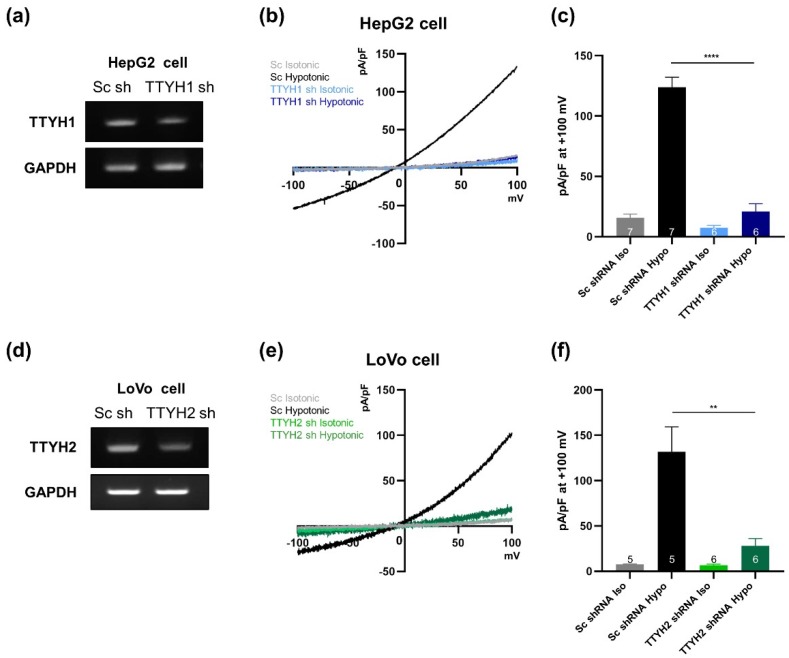
Volume-regulated anion channels (VRACs) are involved in cellular functions such as regulation of cell volume, proliferation, migration, and cell death. Although leucine-rich repeat-containing 8A (LRRC8A) has been characterized as a molecular component of VRACs, here we show that Drosophila melanogaster tweety homologue 1 and 2 (TTYH1 and TTYH2) are critical for VRAC currents in cancer cells. LRRC8A-independent VRAC currents were present in the gastric cancer cell line SNU-601, but almost completely absent in its cisplatin-resistant derivative SNU-601-R10 (R10). The VRAC current in R10 was partially restored by treatment with trichostatin A (TSA), a histone deacetylase inhibitor. Based on microarray expression profiling of these cells, we selected two chloride channels, TTYH1 and TTYH2, as VRAC candidates. VRAC currents were completely absent from TTYH1- and TTYH2-deficient SNU-601 cells, and were clearly restored by expression of TTYH1 or TTYH2. In addition, we examined the expression of TTYH1 or TTYH2 in several cancer cell lines and found that VRAC currents of these cells were abolished by gene silencing of TTYH1 or TTYH2. Taken together, our data clearly show that TTYH1 and TTYH2 can act as LRRC8A-independent VRACs, suggesting novel therapeutic approaches for VRACs in cancer cells.
Keywords: LRRC8A; TTYH1; TTYH2; VRAC; cancer cells.
Conflict of interest statement
The authors declare no conflict of interest.
Figures
Similar articles
-
Volume-regulated chloride channel regulates cell proliferation and is involved in the possible interaction between TMEM16A and LRRC8A in human metastatic oral squamous cell carcinoma cells.Eur J Pharmacol. 2021 Mar 15;895:173881. doi: 10.1016/j.ejphar.2021.173881. Epub 2021 Jan 19. Eur J Pharmacol. 2021. PMID: 33476655
-
Dual role of LRRC8A-containing transporters on cisplatin resistance in human ovarian cancer cells.J Inorg Biochem. 2016 Jul;160:287-95. doi: 10.1016/j.jinorgbio.2016.04.004. Epub 2016 Apr 13. J Inorg Biochem. 2016. PMID: 27112899
-
LRRC8A channels support TNFα-induced superoxide production by Nox1 which is required for receptor endocytosis.Free Radic Biol Med. 2016 Dec;101:413-423. doi: 10.1016/j.freeradbiomed.2016.11.003. Epub 2016 Nov 9. Free Radic Biol Med. 2016. PMID: 27838438 Free PMC article.
-
The Role of Chloride Channels in the Multidrug Resistance.Membranes (Basel). 2021 Dec 28;12(1):38. doi: 10.3390/membranes12010038. Membranes (Basel). 2021. PMID: 35054564 Free PMC article. Review.
-
Role of volume-regulated and calcium-activated anion channels in cell volume homeostasis, cancer and drug resistance.Channels (Austin). 2015;9(6):380-96. doi: 10.1080/19336950.2015.1089007. Epub 2015 Nov 16. Channels (Austin). 2015. PMID: 26569161 Free PMC article. Review.
Cited by
-
To Be or Not to Be an Ion Channel: Cryo-EM Structures Have a Say.Cells. 2023 Jul 17;12(14):1870. doi: 10.3390/cells12141870. Cells. 2023. PMID: 37508534 Free PMC article. Review.
-
Elevated expression of Tweety homologue 3 predicts poor clinical outcomes in ovarian cancer.J Cancer. 2021 Oct 20;12(23):7147-7157. doi: 10.7150/jca.63539. eCollection 2021. J Cancer. 2021. PMID: 34729116 Free PMC article.
-
KPNA2 promotes the progression of gastric cancer by regulating the alternative splicing of related genes.Sci Rep. 2024 Jul 25;14(1):17140. doi: 10.1038/s41598-024-66678-7. Sci Rep. 2024. PMID: 39060340 Free PMC article.
-
Approach for Elucidating the Molecular Mechanism of Epithelial to Mesenchymal Transition in Fibrosis of Asthmatic Airway Remodeling Focusing on Cl- Channels.Int J Mol Sci. 2023 Dec 25;25(1):289. doi: 10.3390/ijms25010289. Int J Mol Sci. 2023. PMID: 38203460 Free PMC article. Review.
-
Tweety-Homolog 1 Facilitates Pain via Enhancement of Nociceptor Excitability and Spinal Synaptic Transmission.Neurosci Bull. 2021 Apr;37(4):478-496. doi: 10.1007/s12264-020-00617-0. Epub 2020 Dec 23. Neurosci Bull. 2021. PMID: 33355899 Free PMC article.
References
-
- Voss F.K., Ullrich F., Münch J., Lazarow K., Lutter D., Mah N., Andrade-Navarro M.A., von Kries J.P., Stauber T., Jentsch T.J. Identification of LRRC8 heteromers as an essential component of the volume-regulated anion channel VRAC. Science. 2014;344:634–638. doi: 10.1126/science.1252826. - DOI - PubMed
Publication types
MeSH terms
Substances
LinkOut - more resources
Full Text Sources
Research Materials
