. 2019 Jun 10;20(1):470.
doi: 10.1186/s12864-019-5820-0.

Identifying genetic determinants of complex phenotypes from whole genome sequence data

Affiliations

Identifying genetic determinants of complex phenotypes from whole genome sequence data

George S Long et al. BMC Genomics. .

Abstract

Background: A critical goal in biology is to relate the phenotype to the genotype, that is, to find the genetic determinants of various traits. However, while simple monofactorial determinants are relatively easy to identify, the underpinnings of complex phenotypes are harder to predict. While traditional approaches rely on genome-wide association studies based on Single Nucleotide Polymorphism data, the ability of machine learning algorithms to find these determinants in whole proteome data is still not well known.

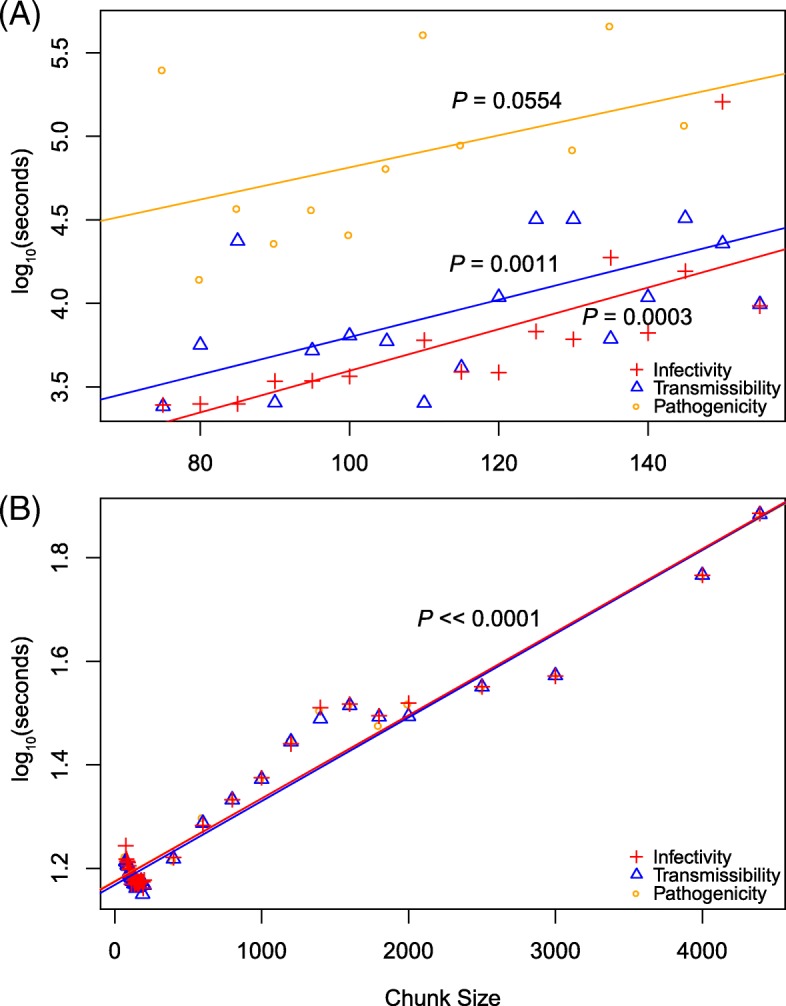
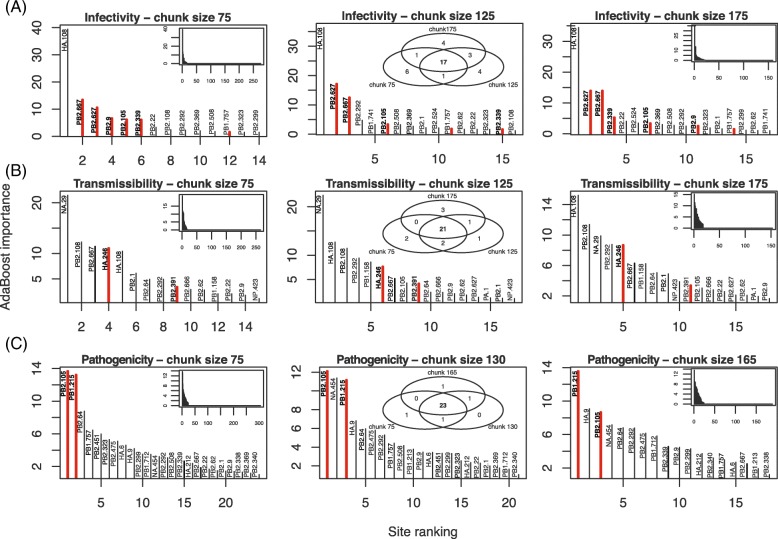
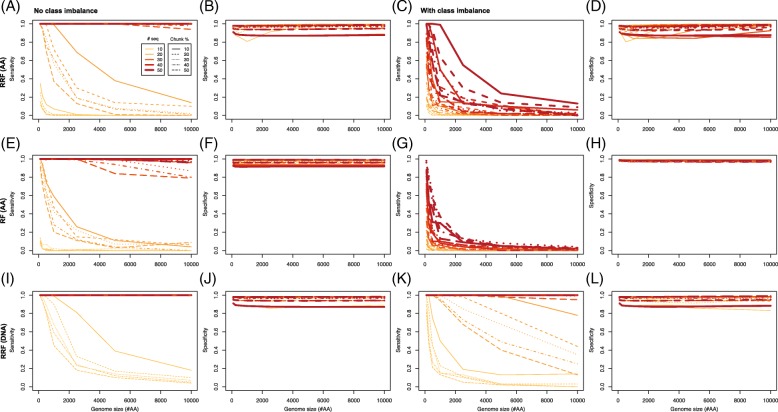
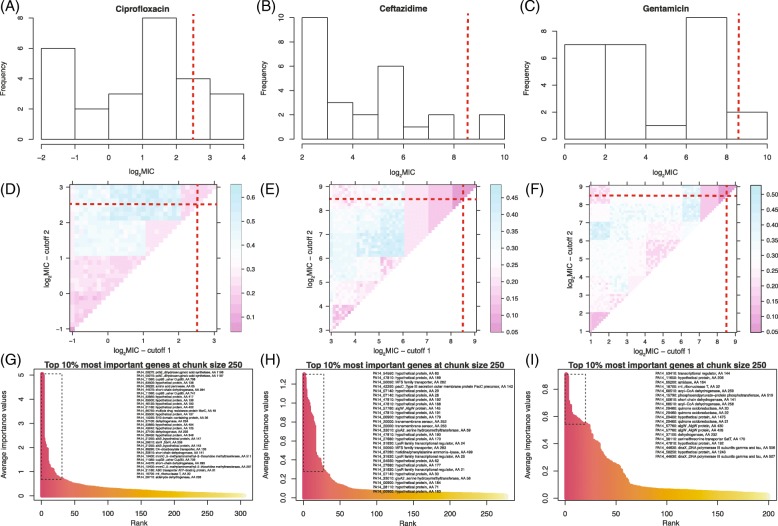
Results: To better understand the applicability of machine learning in this case, we implemented two such algorithms, adaptive boosting (AB) and repeated random forest (RRF), and developed a chunking layer that facilitates the analysis of whole proteome data. We first assessed the performance of these algorithms and tuned them on an influenza data set, for which the determinants of three complex phenotypes (infectivity, transmissibility, and pathogenicity) are known based on experimental evidence. This allowed us to show that chunking improves runtimes by an order of magnitude. Based on simulations, we showed that chunking also increases sensitivity of the predictions, reaching 100% with as few as 20 sequences in a small proteome as in the influenza case (5k sites), but may require at least 30 sequences to reach 90% on larger alignments (500k sites). While RRF has less specificity than random forest, it was never <50%, and RRF sensitivity was significantly higher at smaller chunk sizes. We then used these algorithms to predict the determinants of three types of drug resistance (to Ciprofloxacin, Ceftazidime, and Gentamicin) in a bacterium, Pseudomonas aeruginosa. While both algorithms performed well in the case of the influenza data, results were more nuanced in the bacterial case, with RRF making more sensible predictions, with smaller errors rates, than AB.

Conclusions: Altogether, we demonstrated that ML algorithms can be used to identify genetic determinants in small proteomes (viruses), even when trained on small numbers of individuals. We further showed that our RRF algorithm may deserve more scrutiny, which should be facilitated by the decreasing costs of both sequencing and phenotyping of large cohorts of individuals.

Keywords: Drug resistance; Genome-wide association study; Influenza virus; Machine learning; Pseudomonas aeruginosa.


Conflict of interest statement

The authors declare that they have no competing interests.

Figures

Fig. 1
Fig. 1
Impact of chunk size on the runtime of the machine learning algorithms for the influenza data. Runtimes for infectivity (red), transmissibility (blue), and pathogenicity (orange) are shown for AB (a) and RRF (b). While each data point is based on a single run, run-to-run variability is taken into account by performing linear regressions (solid lines); their P-values are also shown
Fig. 2
Fig. 2
Effect of chunk size on the distribution of importance of sites for the AB algorithm. The genes and sites identified as genetic determinants of influenza phenotypes are shown for: a infectivity, b transmissibility, and c pathogenicity. Only results for the smallest (75 amino acids), intermediate (125), and largest (175) chunk sizes are shown. Only the most important sites (importance >1.5) are shown in each panel, with sites backed by with experimental evidence highlighted in red. Insets show the whole distribution of importance values (left and right columns), and the Venn diagrams of the most important sites at all three chunk size (middle column)
Fig. 3
Fig. 3
Effect of chunk size on the distribution of importance of sites for the RRF algorithm. The genes and sites identified as genetic determinants of influenza phenotypes are shown for: a infectivity, b transmissibility, and c pathogenicity. Only results for the smallest (80 amino acids), intermediate (125), and largest (175) chunk sizes are shown. Only the most important sites (Gini index in top 90th percentile of its distribution over all the sites) are shown in each panel, with sites backed by with experimental evidence highlighted in red. Insets show the whole distribution of importance values (left and right columns), and the Venn diagrams of the most important sites at all three chunk size (middle column)
Fig. 4
Fig. 4
Impact of chunking and data size on sensitivity and specificity. Simulations were conducted to assess the impact of chunking, number of sequences and length of protein alignments on (a) sensitivity and (b) specificity of the RRF algorithm, with no class imbalance, or in the presence of class imbalance (c) and (d), respectively. Similar simulations were conducted under the RF algorithm (e), (f), (g) and (h), respectively, still for protein data, and under RRF for DNA data (i), (j), (k) and (l), respectively
Fig. 5
Fig. 5
Analysis of the P.aeruginosa data across the 26 strains from [25]. The distributions of MIC values (on a log2 scale) are shown for a Ciprofloxacin, b Ceftazidime, and c Gentamicin. These empirical distributions were used to determine MIC thresholds for the AB analyses (Table 2). Note that the scales on the y-axis vary slightly. With RRF, a throughout search of the discretization was performed to select thresholds θ1 / θ2 that would minimize the Out-of-bag error for d Ciprofloxacin, e Ceftazidime, and f Gentamicin (color scale to the right of each panel). The θ1 / θ2 combinations (red dotted lines, also reported in first row) were determined visually. The top 10% most important sites (as per their Gini index) are highlighted (box with broken lines) among sites selected at the end of the first tier of the chunking algorithm for g Ciprofloxacin, h Ceftazidime, and i Gentamicin. These top sites are listed in the top right part of each distribution

References

    1. Stranger BE, Stahl EA, Raj T. Progress and promise of genome-wide association studies for human complex trait genetics. Genetics. 2011;187(2):367–83. doi: 10.1534/genetics.110.120907. - DOI - PMC - PubMed
    1. Lippert C, Sabatini R, Maher MC, Kang EY, Lee S, Arikan O, et al. Identification of individuals by trait prediction using whole-genome sequencing data. Proc Natl Acad Sci U S A. 2017;114(38):10166–71. doi: 10.1073/pnas.1711125114. - DOI - PMC - PubMed
    1. Visscher PM, Wray NR, Zhang Q, Sklar P, McCarthy MI, Brown MA, et al. 10 Years of GWAS discovery: biology, function, and translation. Am J Hum Genet. 2017;101(1):5–22. doi: 10.1016/j.ajhg.2017.06.005. - DOI - PMC - PubMed
    1. Visscher PM, Brown MA, McCarthy MI, Yang J. Five years of GWAS discovery. Am J Hum Genet. 2012;90(1):7–24. doi: 10.1016/j.ajhg.2011.11.029. - DOI - PMC - PubMed
    1. Manolio TA, Collins FS, Cox NJ, Goldstein DB, Hindorff LA, Hunter DJ, et al. Finding the missing heritability of complex diseases. Nature. 2009;461(7265):747–53. doi: 10.1038/nature08494. - DOI - PMC - PubMed

Publication types