. 2019 Jun 25;116(26):13097-13106.
doi: 10.1073/pnas.1903203116. Epub 2019 Jun 10.

Persistence of learning-induced synapses depends on neurotrophic priming of glucocorticoid receptors

Affiliations

Persistence of learning-induced synapses depends on neurotrophic priming of glucocorticoid receptors

Margarita Arango-Lievano et al. Proc Natl Acad Sci U S A. .

Abstract

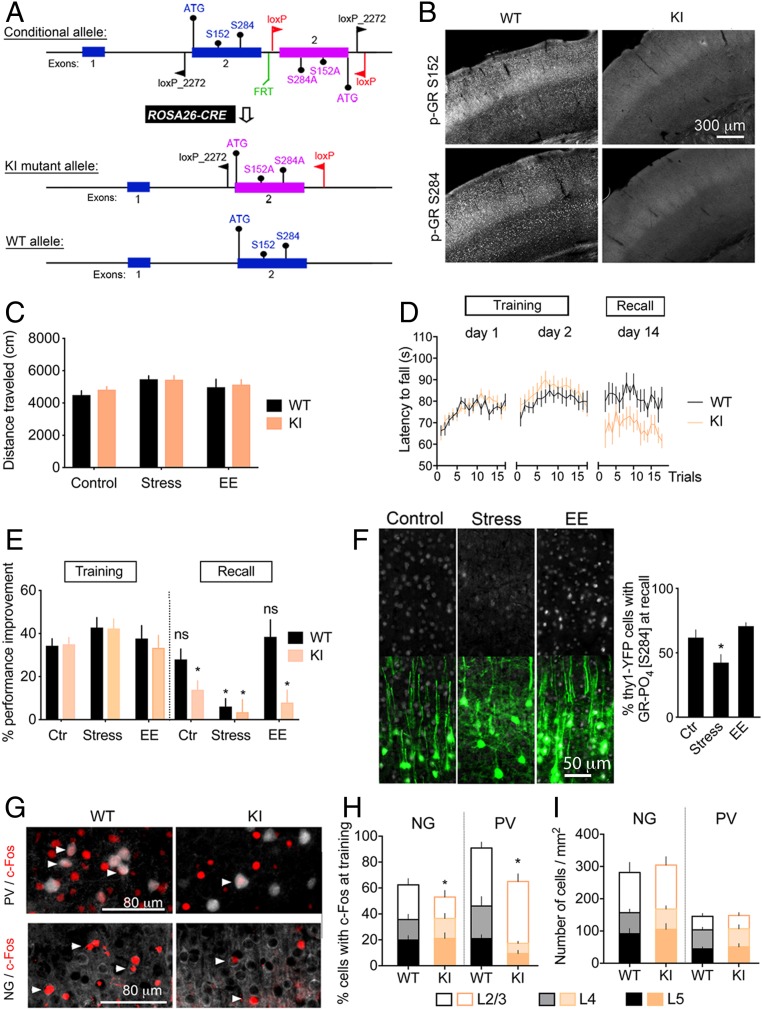
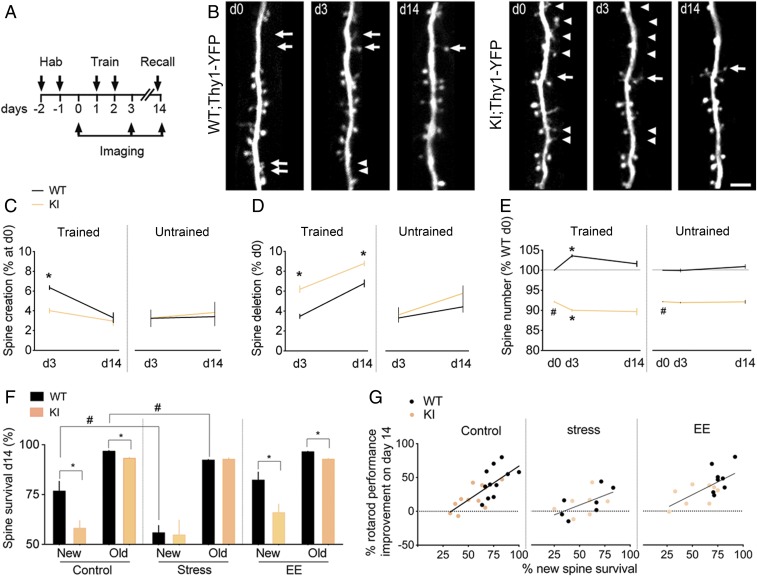
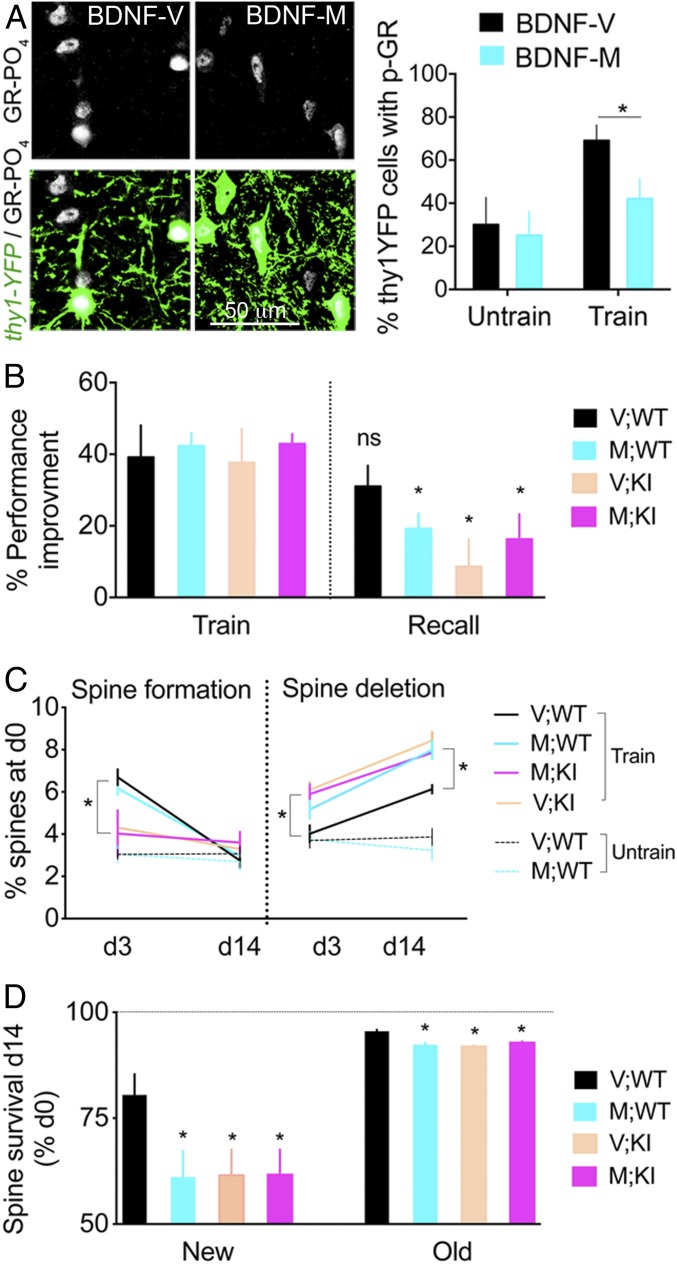
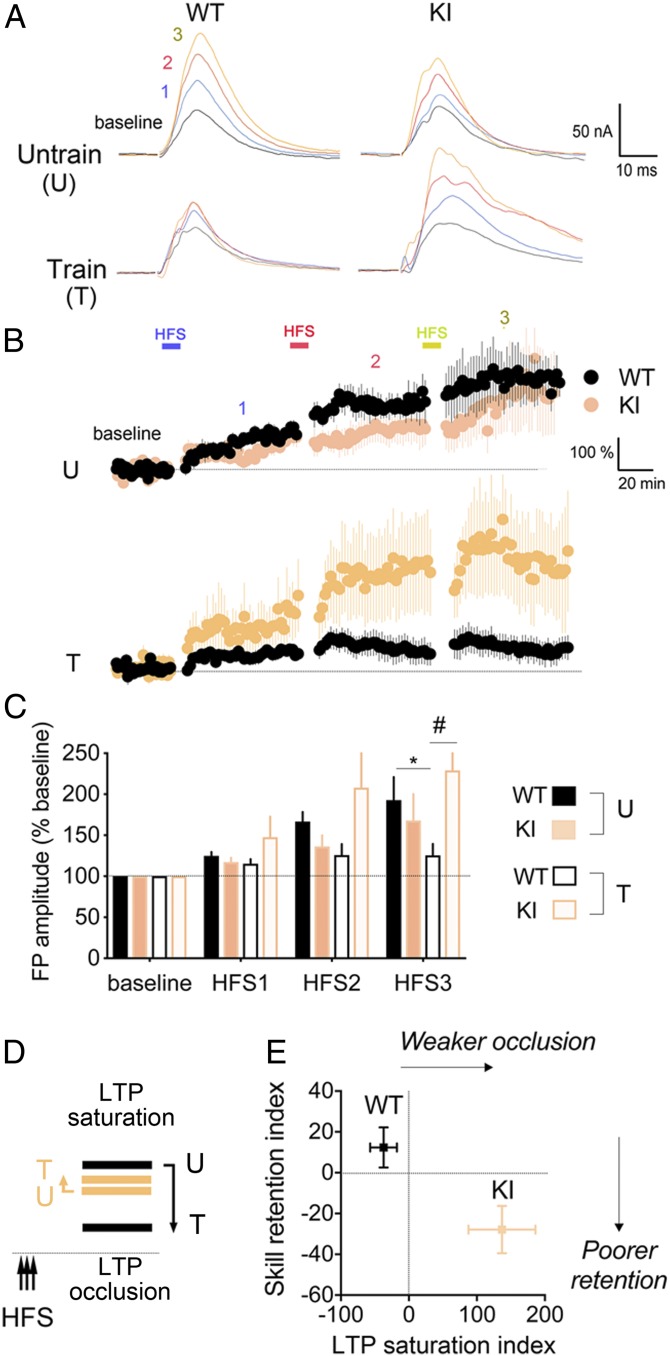
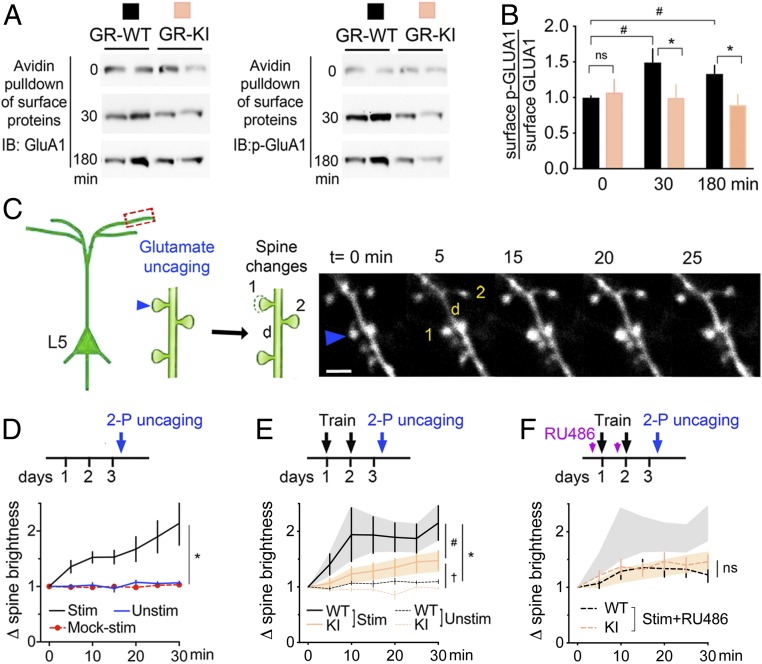
Stress can either promote or impair learning and memory. Such opposing effects depend on whether synapses persist or decay after learning. Maintenance of new synapses formed at the time of learning upon neuronal network activation depends on the stress hormone-activated glucocorticoid receptor (GR) and neurotrophic factor release. Whether and how concurrent GR and neurotrophin signaling integrate to modulate synaptic plasticity and learning is not fully understood. Here, we show that deletion of the neurotrophin brain-derived neurotrophic factor (BDNF)-dependent GR-phosphorylation (PO4) sites impairs long-term memory retention and maintenance of newly formed postsynaptic dendritic spines in the mouse cortex after motor skills training. Chronic stress and the BDNF polymorphism Val66Met disrupt the BDNF-dependent GR-PO4 pathway necessary for preserving training-induced spines and previously acquired memories. Conversely, enrichment living promotes spine formation but fails to salvage training-related spines in mice lacking BDNF-dependent GR-PO4 sites, suggesting it is essential for spine consolidation and memory retention. Mechanistically, spine maturation and persistence in the motor cortex depend on synaptic mobilization of the glutamate receptor subunit A1 (GluA1) mediated by GR-PO4 Together, these findings indicate that regulation of GR-PO4 via activity-dependent BDNF signaling is important for the formation and maintenance of learning-dependent synapses. They also define a signaling mechanism underlying these effects.

Keywords: BDNF-Val66Met; LTP; learning and memory; stress; two-photon microscopy.


Conflict of interest statement

The authors declare no conflict of interest.

Figures

Fig. 1.
Fig. 1.
Deletion of BDNF-dependent GR-PO4 impairs retention of motor skill training. (A) Substitution of Ser152 and Ser284 (WT allele) by Ala152 and Ala284 (KI allele) in GR locus obtained by Cre-mediated recombination of loxP sites driven by the Rosa26 promoter. KI mice lack BDNF-dependent GR-PO4 sites. Details of the genetic constructs can be found in Methods and SI Appendix, Fig. S2. (B) Deletion of GR-PO4 immunostaining in KI homozygous mice compared with WT controls. (C) Spontaneous locomotion in an open field of mice reared in a control condition, chronic stress condition, or enriched environment (EE) for 2 wk starting immediately after the training. Mean ± SEM of n = 8 mice per group; two-way ANOVA: general effect of living conditions (F2,42 = 3.43, P = 0.039). (D) Motor skill learning monitored after 2 wk of consolidation displayed as the latency to fall from the rotarod. Mean ± SEM of n = 8 mice per group; three-way ANOVA: effect of genotype (F2,2 = 3.075, P < 0.05), post hoc Tukey test: WT day 2 (P = 0.035), KI day 2 (P = 0.017); effect on retention (F1,2 = 11.33, P < 0.05), post hoc Tukey test: KI (P = 0.015). (E) Rotarod performance improvement to day 1 of mice reared in control, stress, or EE conditions for 2 wk after the training. Mean ± SEM of n = 8 mice per group; three-way ANOVA: effect of retention (F1,84 = 52.17, P < 0.0001), genotype (F1,84 = 9.1, P < 0.01), stress × retention (F2,84 = 7.8, P < 0.001), and genotype × retention (F2,84 = 6.55, P < 0.05); post hoc Tukey test between training and recall (*P < 0.05). ns, not significant. (F) Effect of stress and EE between days 3 and 14 on GR-PO4 levels (gray) in Thy1-YFP neurons (green) of M1 cortex. Mean ± SEM of n = 8 mice per group; unpaired t test [t(14) = 2.21, *P < 0.05]. Larger fields of view are shown in SI Appendix, Fig. S2. (G) Expression of c-Fos 45 min after 2 d of training in L2/3 NG principal cells and L5 PV neurons of M1. Arrowheads point to coexpression. Magnified photographs are shown in SI Appendix, Fig. S2. (H) Mean ± SEM of n = 5 mice per group; three-way ANOVA: effect of genotype: (F1,48 = 8.33, P = 0.0058), effect of cell type (F1,48 = 10.95, P = 0.0018), and effect in cortical layers (F2,48 = 31.24, P < 0.0001); post hoc Tukey test for NG cells L2/3 (*P = 0.026), L4 (P = 0.93), and L5 (P = 0.77); post hoc Tukey test for PV cells L2/3 (P = 0.58), L4 (*P = 0.004), and L5 (*P = 0.046). (I) Number of NG and PV neurons per square millimeter in M1. Mean ± SEM of n = 5 mice per group.
Fig. 2.
Fig. 2.
GR-PO4 is required for the maintenance of new spines formed at training. (A) Timeline of dendritic spine imaging in M1 cortex of GR-KI;Thy1-YFP mice habituated to the nonaccelerating rod (2 rpm) for 2 d before training at the circadian peak of corticosterone (7:00 PM) on the accelerating rod (up to 80 rpm). A recall session on the accelerating rod is performed before the last imaging session on day 14. (B) Dendritic spine dynamics of L5 principal Thy1-YFP neurons in L1 of M1 as a function of genotype and time. Arrows point to spine creations, and arrowheads point to spine deletions (Scale bar, 5 μm). d, day. (C) Spine creation in M1. Mean ± SEM of n = 20 trained WT mice on days 0–3 and 6 on day 14, n = 18 trained KI mice on days 0–3 and 7 on day 14, n = 6 untrained WT mice on days 0–14, and n = 7 untrained KI mice on days 0–14; three-way ANOVA: effect of genotype × training (F1,69 = 4.39, P < 0.05), post hoc Tukey test: WT vs. KI (*P < 0.0005). d, day. (D) Spine deletion in M1. Mean ± SEM of n = 20 trained WT mice on days 0–3 and 6 on day 14; n = 18 trained KI mice on days 0–3 and 7 on day 14, n = 6 untrained WT mice on days 0–14, and n = 7 untrained KI mice on days 0–14; three-way ANOVA: effect of genotype (F1,69 = 23.28, P < 0.0001) and genotype × training (F1,69 = 5.3, P < 0.05), post hoc Tukey test: WT vs. KI (*P < 0.05). (E) Spine number in M1 relative to WT control. Mean ± SEM of n = 20 trained WT mice on days 0–3 and 6 on day 14, n = 18 trained KI mice on days 0–3 and 7 on day 14, n = 6 untrained WT mice on days 0–14, and n = 7 untrained KI mice on days 0–14; three-way ANOVA: effect of genotype (F1,116 = 2453, P < 0.0001) and genotype × training (F1,116 = 55.18, P < 0.0001), post hoc Tukey test: WT vs. KI (#P < 0.0001) and day 0 vs. day 3 (*P < 0.0001). (F) Survival of training-induced new spines and preexisting old spines in M1. Mean ± SEM of n = 11 control mice per group, 7 stress mice per group; 8 enriched environment (EE) mice per group; three-way ANOVA: effect of stress (F1,64 = 8.1, P = 0.059), post hoc Tukey test: WT (#P < 0.005). Pairwise comparisons by unpaired t test for the effect of genotype on control new spines [t(20) = 2.99, *P = 0.007] and control old spines [t(20) = 6.9, *P < 0.0001] and on new spines EE [t(14) = 2.78, *P = 0.014] and old spines [EE t(14) = 7.93, *P < 0.0001]. Spine addition and elimination data are shown in SI Appendix, Fig. S6. (G) Correlation between survival at day 14 of spines that formed during training on day 2 and memory retention on day 14 in control conditions (Pearson r = 0.73, P = 0.0001, n = 11 WT, n = 11 KI), chronic stress (r = 0.56, P = 0.036, n = 7 WT, n = 7 KI), or EE (r = 0.64, P = 0.0006, n = 8 WT, n = 8 KI).
Fig. 3.
Fig. 3.
BDNF-dependent GR-PO4 is required for training-evoked spine survival and motor skill retention. (A) Effect of BDNF-Val66Met polymorphism on GR-PO4 staining in Thy1-YFP neurons of M1 cortex after 2 d of rotarod training. Mean ± SEM of n = 5 untrained mice per group, 7V (BDNF-Val/Val), and 8M (BDNF-Met/Met) trained; two-way ANOVA (F1,21 = 7.75, P = 0.011). Pairwise group comparison between BDNF-M and BDNF-V by unpaired t test [t(13) = 2.24, *P < 0.05]. (B) Effect of genotypes on rotarod performance at recall on day 14 expressed as a percentage of day 1 in GR-KI mice backcrossed with the BDNF-Val66Met background. Mean ± SEM of n = 8 V;WT mice, 8 M;WT mice, 9 V;KI mice, and 11 M;KI mice; three-way ANOVA: effect on retention (F1,64 = 23.68, P < 0.0001), post hoc Tukey test (*P < 0.05). ns, not significant. (C) Spine formation in M1. Mean ± SEM of n = 7 V;WT trained mice, n = 7 M;WT trained mice, n = 7 V;KI trained mice, n = 8 M;KI trained mice, n = 8 V;WT untrained mice, and n = 5 M;WT untrained mice; two-way ANOVA: effect of genotype (F3,50 = 4.65) and time (F1,50 = 91.55, P < 0.01), post hoc Tukey test (*P < 0.0001). Spine deletion. Effect of genotype (F3,50 = 12.66) and time (F1,50 = 73.12, P < 0.0001), post hoc Tukey test (*P < 0.05). d, day. (D) Survival of new spines in M1 formed on day 3 and old spines formed before day 0. Mean ± SEM of n = 7 V;WT mice, n = 8 M;WT mice, n = 9 V;KI mice, and n = 11 M;KI mice; two-way ANOVA: effect of genotype (F3,62 = 2.88, P < 0.05). Pairwise comparisons by unpaired t test between V;WT mice and M;WT mice on new spines [t(13) = 2.28] and old spines [t(13) = 4.86]; V;WT mice and V;KI mice on new spines [t(14) = 2.24] and old spines [t(14) = 9.95]; and V;WT mice and M;KI mice on new spines [t(16) = 2.15] and old spines [t(16) = 7.91, *P < 0.05].
Fig. 4.
Fig. 4.
GR-PO4 is required for training-evoked plasticity in motor cortex. (A) Field potential recordings of high-frequency stimulation (HFS)–induced LTP in M1 cortical slices as a function of genotype and training for 2 d on the rotarod. Acute slices on the next day of training are stimulated with half the intensity to reach a maximal response in L2 parallel fibers at a distance ≈500 μm from the recording electrodes in L2 of M1 cortex. There is a 20-min baseline recording between HFSs. (B) FP recordings of tetanus-induced LTP in M1 cortical slices from eight WT and five KI trained mice and five WT and six KI untrained mice. Means are normalized to baseline ± SEM. (C) Averaged field potential (FP) amplitudes after three consecutive HFSs (mean of last 40 min per epoch ± SEM). LTP occlusion after HFS3 by unpaired t test in WT mice (*P = 0.034). Three-way ANOVA: effect of HFS (F3,80 = 13.16, P < 0.0001), genotype (F1,80 = 4.57, P < 0.05), and genotype × training (F1,80 = 14.18, P < 0.005); post hoc Tukey test (#P = 0.011). (D) Working model. Training in WT but not KI mice occluded LTP saturation. The dashed line represents baseline transmission in M1. (E) Weaker LTP occlusion in KI mice corresponded to poorer retention of motor skills. Motor skill retention and LTP saturation indexes are described in Methods. Effect of genotype on LTP occlusion by unpaired t test (P = 0.0055) (mean ± SEM [t(14) = 3.28], n = 8 mice per group) and on motor skill retention (P = 0.014) (mean ± SEM [t(22) = 2.64], n = 12 mice per group).
Fig. 5.
Fig. 5.
GR-PO4 is required for training-evoked spine maturation. (A) Avidin pulldown of biotinylated proteins from primary neurons at day in vitro 14 electroporated with GR-WT or GR-KI at day in vitro 0, and stimulated with 25 ng/mL BDNF and 1 μM dexamethasone for the indicated time. Each column of the immunoblot (IB) for for GluA1 and p-GluA1 represents an independent sample. (B) Surface GluA1-PO4/GluA1 in cortical neurons expressing GR-WT or GR-KI. Mean ± SEM of n = 11 WT mice and n = 8 KI mice per group; two-way ANOVA: effect of mutant (F1,53 = 6.61, P = 0.016). Pairwise group comparison by unpaired t test (*P < 0.05, #P < 0.001). ns, not significant. (C) In vivo two-photon uncaging of 20 mM MNI-glutamate (90 iterations per laser at 720 nm, 0.7 mW, 0.1 Hz) in Hepes buffer in M1. The arrow indicates photostimulated spine (1) compared with the underlying dendritic shaft (d) and neighboring unstimulated spine (2). (Scale bar, 3 μm). (D) Specificity of glutamate-evoked spine enlargement normalized to baseline spine size in WT mice. Mean ± SEM of n = 10 stimulated (Stim) spines, n = 9 mock-stimulated spines (Mock-stim), and n = 20 neighbor spines (Unstim) in three mice; two-way ANOVA: effect of stimulation (F2,237 = 83.9, P < 0.0001) and time (F6,237 = 6.78, P < 0.0001), post hoc Tukey test (*P < 0.0001). (E) Effect of genotype on glutamate-evoked spine enlargement after 2 d of rotarod training. Mean ± SEM of n = 23 stimulated spines WT, n = 40 stimulated spines KI, n = 18 neighbor spines WT, and n = 20 neighbor spines KI in four mice per group; two-way ANOVA: effect of stimulation (F3,631 = 21.93, P < 0.0001) and time (F6,631 = 2.43, P = 0.024), post hoc Tukey test (#P < 0.0001, *P < 0.0001, P = 0.009). (F) Effect of RU486 (20 mg/kg i.p. 20 min before each training session) on glutamate-evoked spine enlargement. Mean ± SEM of n = 17 stim+RU486 WT spines, n = 13 stim+RU486 KI spines in three mice; two-way ANOVA: effect of stimulation (F3,605 = 10.13, P < 0.0001) and time (F6,605 = 3.96, P = 0.0007). 2-P, two-photon.

Similar articles

Cited by

References

    1. Lupien S. J., McEwen B. S., Gunnar M. R., Heim C., Effects of stress throughout the lifespan on the brain, behaviour and cognition. Nat. Rev. Neurosci. 10, 434–445 (2009). - PubMed
    1. Finsterwald C., Alberini C. M., Stress and glucocorticoid receptor-dependent mechanisms in long-term memory: From adaptive responses to psychopathologies. Neurobiol. Learn. Mem. 112, 17–29 (2014). - PMC - PubMed
    1. Schwabe L., Joëls M., Roozendaal B., Wolf O. T., Oitzl M. S., Stress effects on memory: An update and integration. Neurosci. Biobehav. Rev. 36, 1740–1749 (2012). - PubMed
    1. Fu M., Zuo Y., Experience-dependent structural plasticity in the cortex. Trends Neurosci. 34, 177–187 (2011). - PMC - PubMed
    1. Bramham C. R., Local protein synthesis, actin dynamics, and LTP consolidation. Curr. Opin. Neurobiol. 18, 524–531 (2008). - PubMed

Publication types

MeSH terms

LinkOut - more resources