. 2019 Aug 7;39(32):6233-6250.
doi: 10.1523/JNEUROSCI.2984-18.2019. Epub 2019 Jun 10.

Close Homolog of L1 Regulates Dendritic Spine Density in the Mouse Cerebral Cortex Through Semaphorin 3B

Affiliations

Close Homolog of L1 Regulates Dendritic Spine Density in the Mouse Cerebral Cortex Through Semaphorin 3B

Vishwa Mohan et al. J Neurosci. .

Abstract

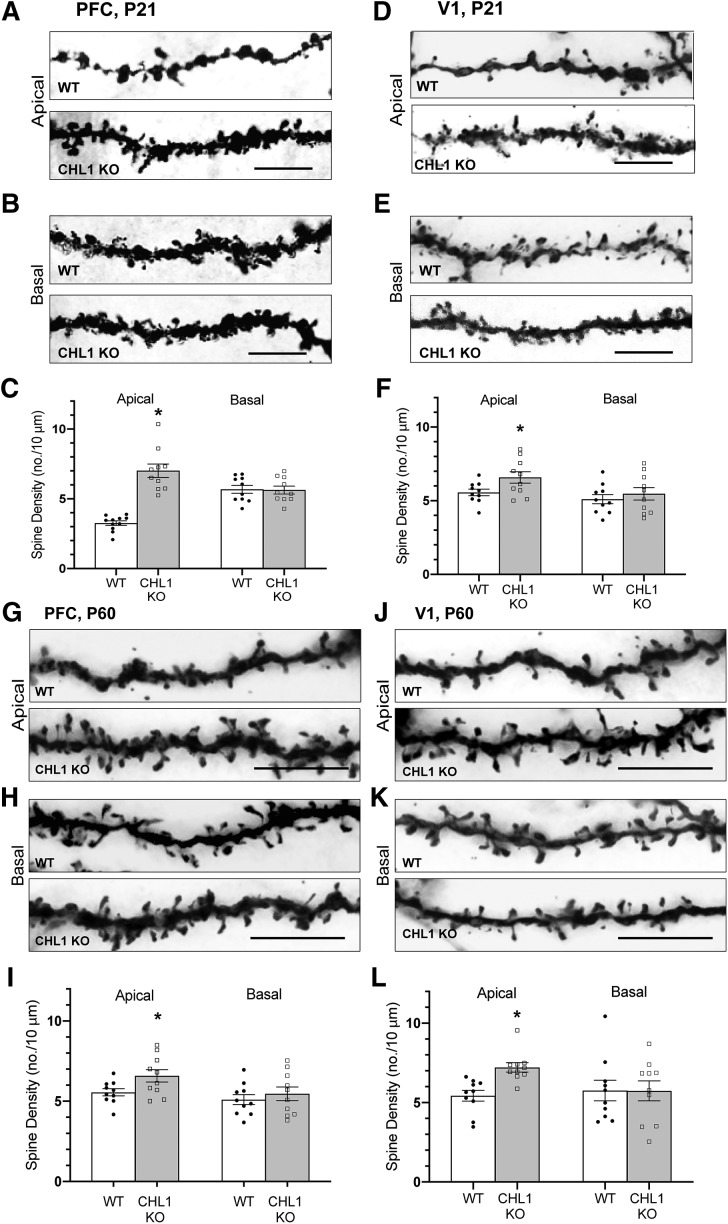
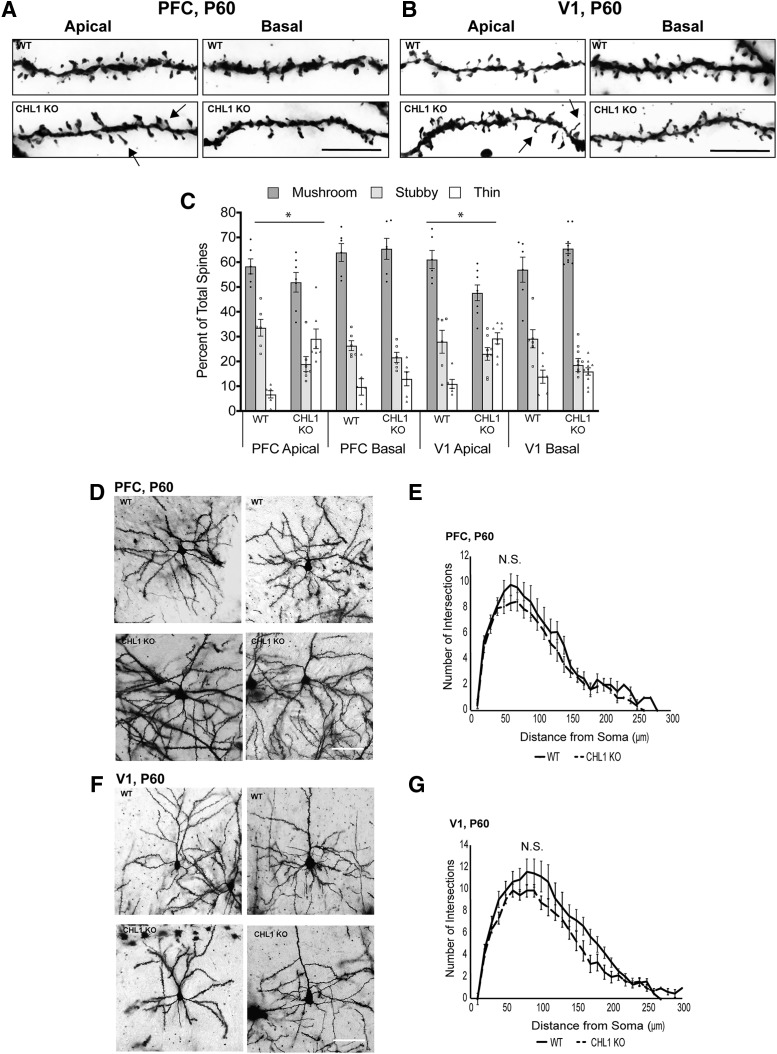
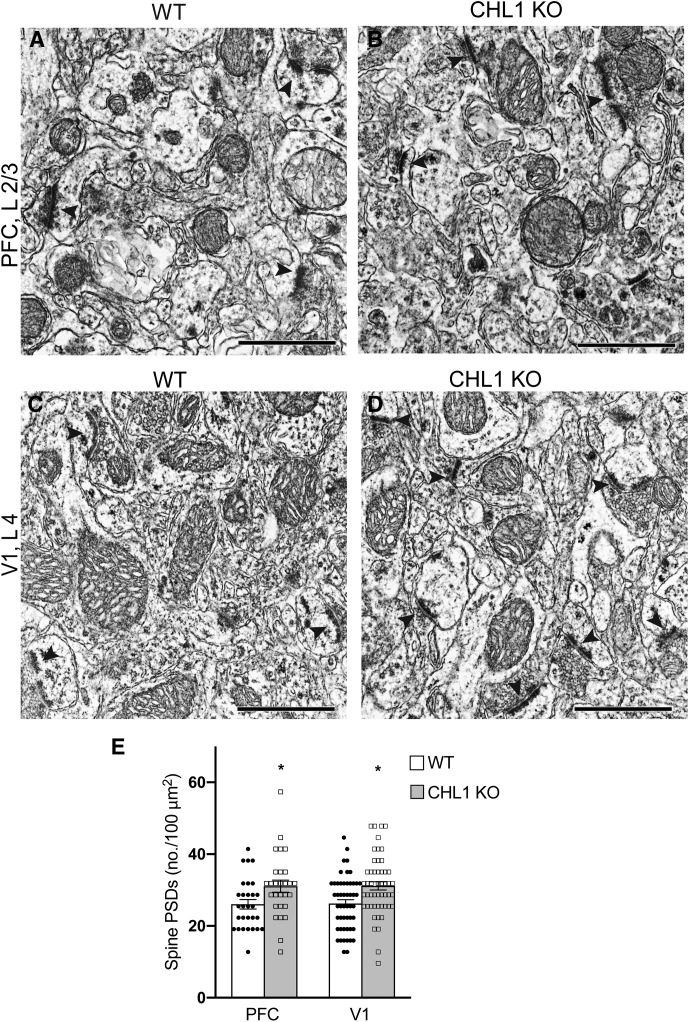
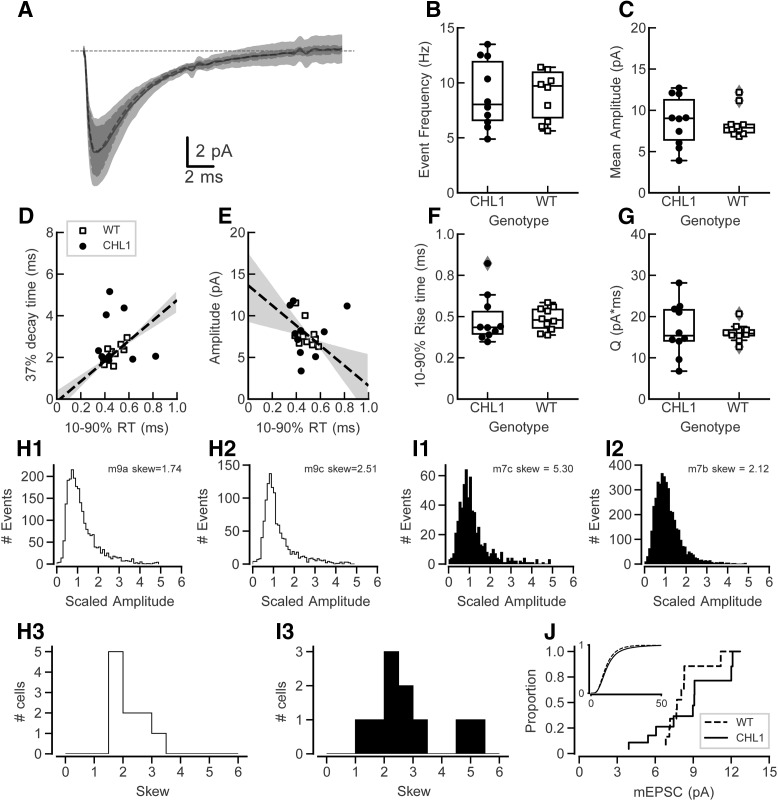
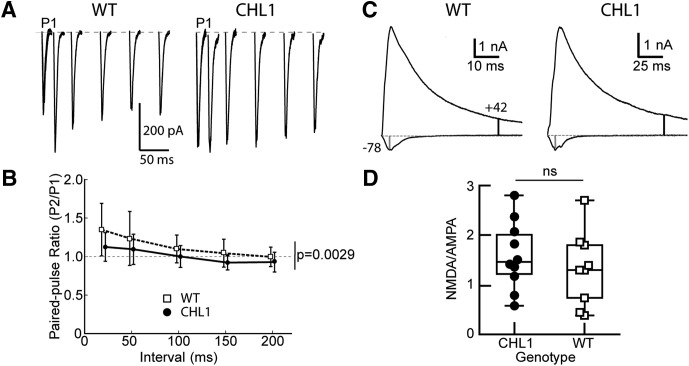
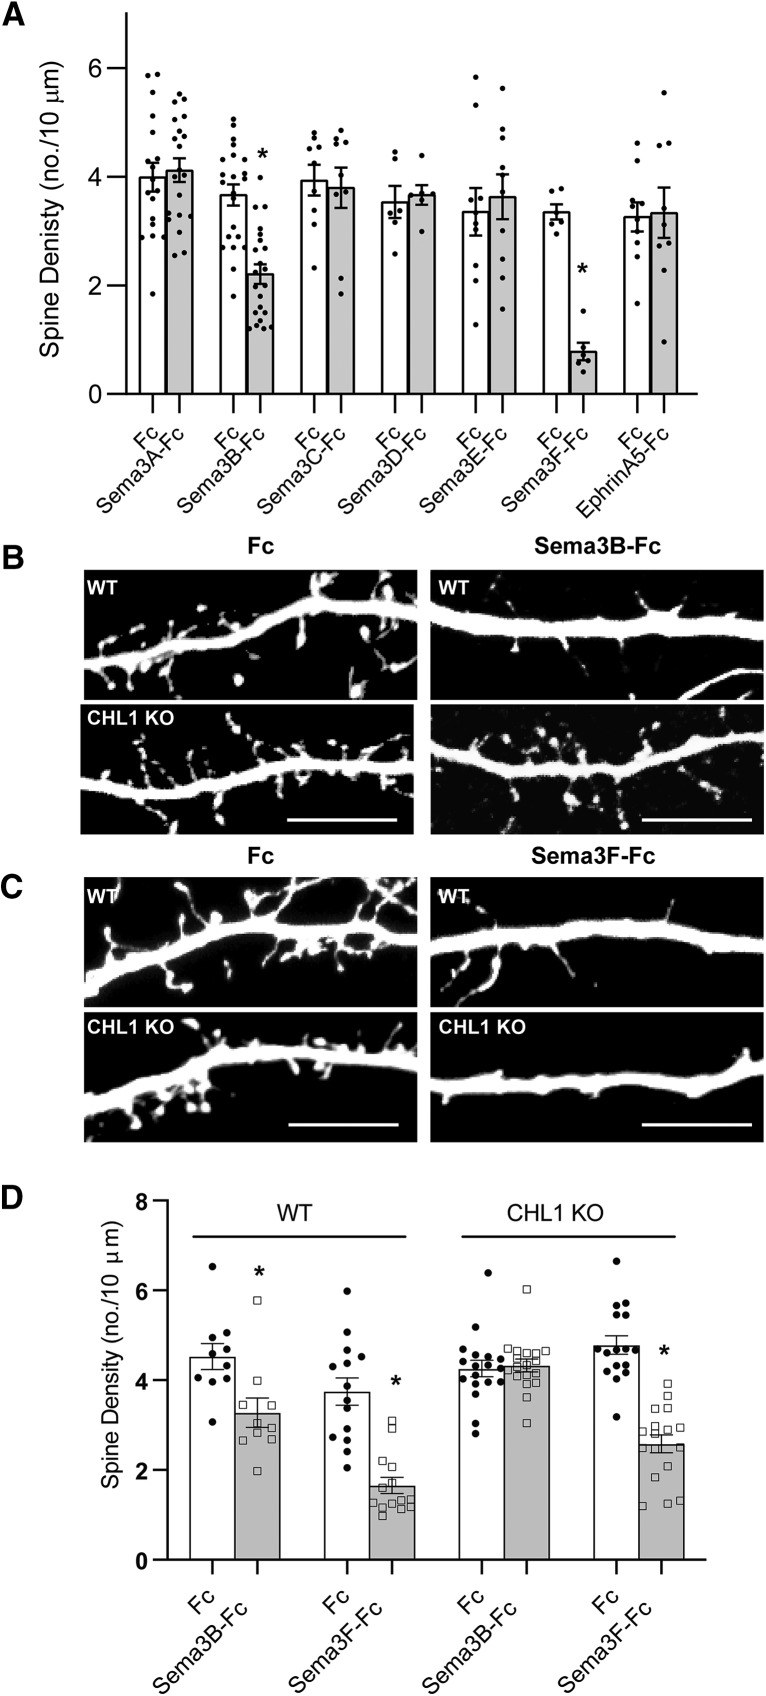
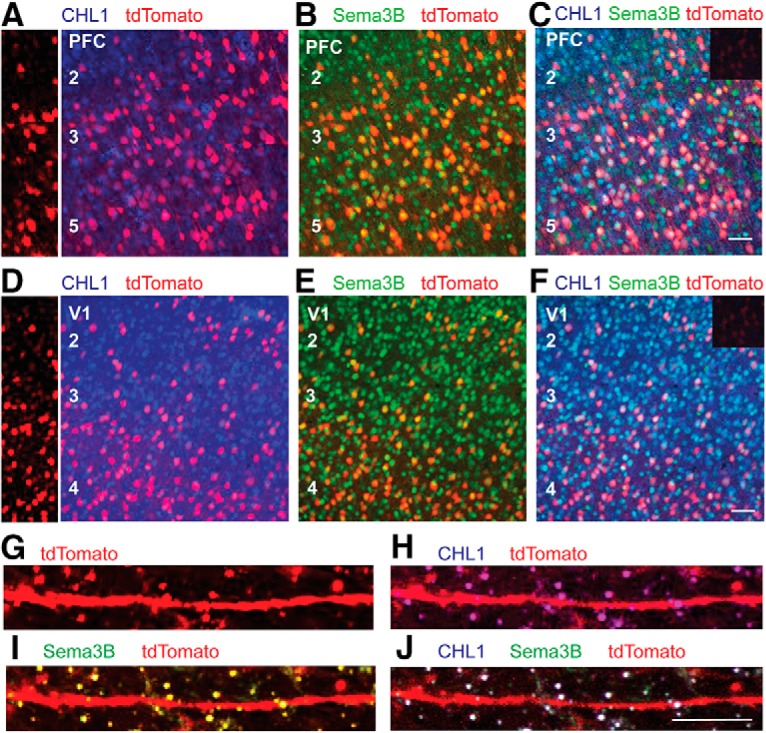
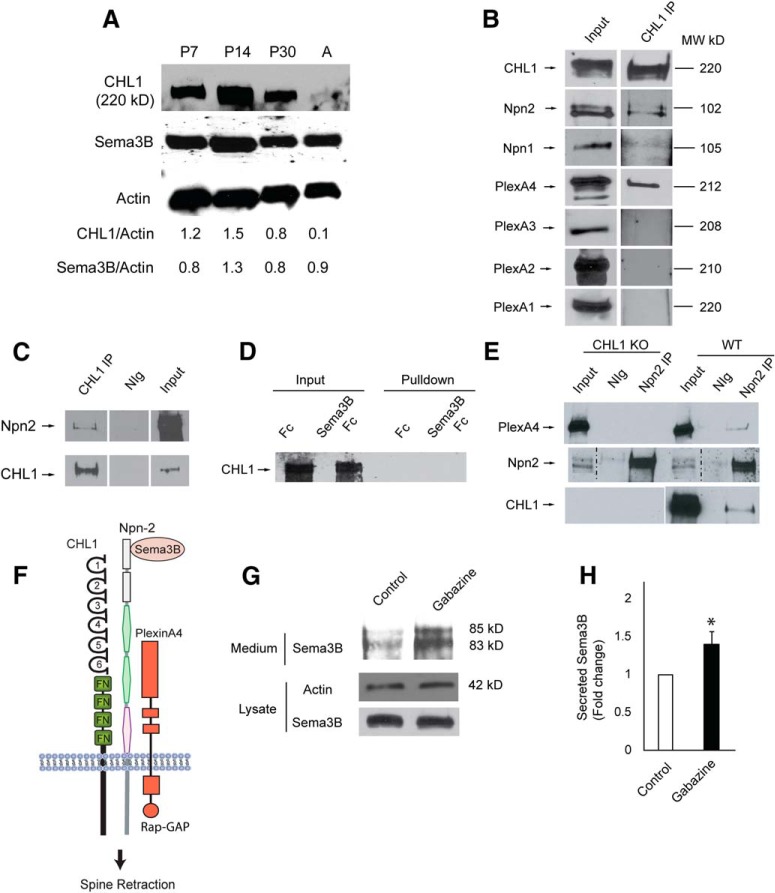
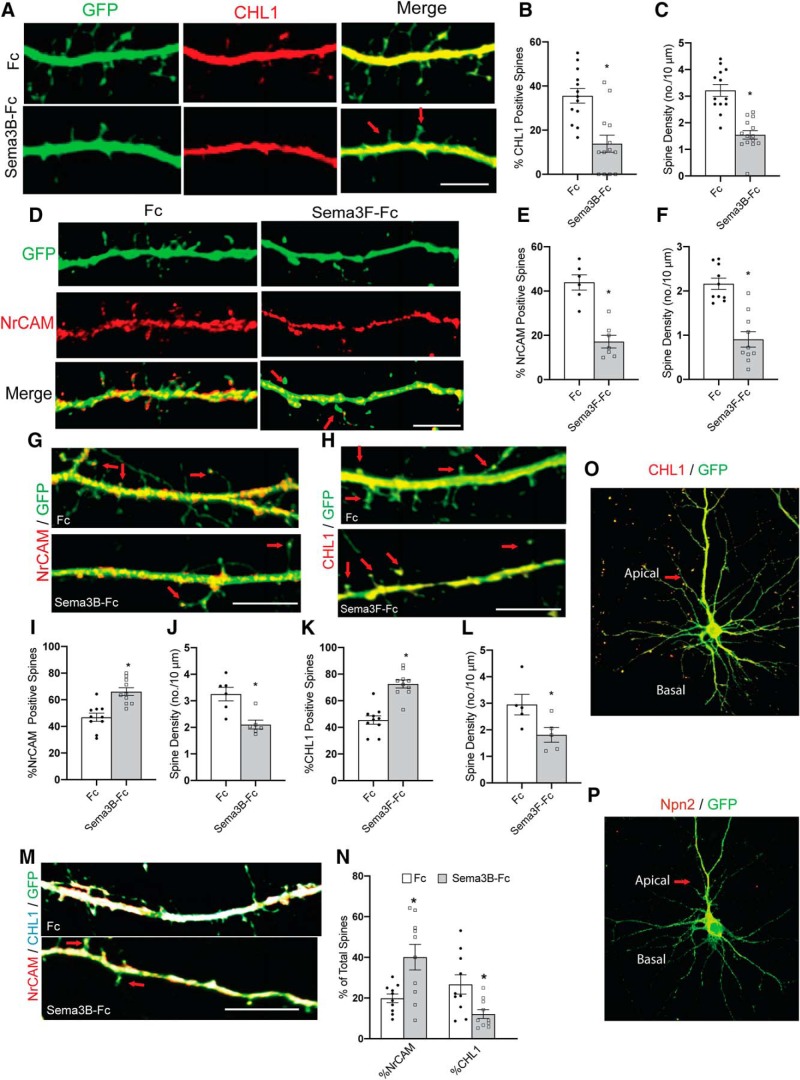
Dendritic spines in the developing mammalian neocortex are initially overproduced and then eliminated during adolescence to achieve appropriate levels of excitation in mature networks. We show here that the L1 family cell adhesion molecule Close Homolog of L1 (CHL1) and secreted repellent ligand Semaphorin 3B (Sema3B) function together to induce dendritic spine pruning in developing cortical pyramidal neurons. Loss of CHL1 in null mutant mice in both genders resulted in increased spine density and a greater proportion of immature spines on apical dendrites in the prefrontal and visual cortex. Electron microscopy showed that excitatory spine synapses with postsynaptic densities were increased in the CHL1-null cortex, and electrophysiological recording in prefrontal slices from mutant mice revealed deficiencies in excitatory synaptic transmission. Mechanistically, Sema3B protein induced elimination of spines on apical dendrites of cortical neurons cultured from wild-type but not CHL1-null embryos. Sema3B was secreted by the cortical neuron cultures, and its levels increased when cells were treated with the GABA antagonist gabazine. In vivo CHL1 was coexpressed with Sema3B in pyramidal neuron subpopulations and formed a complex with Sema3B receptor subunits Neuropilin-2 and PlexinA4. CHL1 and NrCAM, a closely related L1 adhesion molecule, localized primarily to distinct spines and promoted spine elimination to Sema3B or Sema3F, respectively. These results support a new concept in which selective spine elimination is achieved through different secreted semaphorins and L1 family adhesion molecules to sculpt functional neural circuits during postnatal maturation.SIGNIFICANCE STATEMENT Dendritic spines in the mammalian neocortex are initially overproduced and then pruned in adolescent life through unclear mechanisms to sculpt maturing cortical circuits. Here, we show that spine and excitatory synapse density of pyramidal neurons in the developing neocortex is regulated by the L1 adhesion molecule, Close Homolog of L1 (CHL1). CHL1 mediated spine pruning in response to the secreted repellent ligand Semaphorin 3B and associated with receptor subunits Neuropilin-2 and PlexinA4. CHL1 and related L1 adhesion molecule NrCAM localized to distinct spines, and promoted spine elimination to Semaphorin 3B and -3F, respectively. These results support a new concept in which selective elimination of individual spines and nascent synapses can be achieved through the action of distinct secreted semaphorins and L1 adhesion molecules.

Keywords: Semaphorin 3B; autism spectrum disorders; cell adhesion molecule; close homolog of L1; dendritic spine; spine pruning.


Figures

Figure 1.
Figure 1.
Loss of CHL1 increases spine density on apical dendrites of cortical pyramidal neurons in early adolescence and adulthood. AF, Representative images of apical and basal dendrites from Golgi-labeled pyramidal neurons and quantification of spine density in PFC layer 2/3 and V1, layer 4 of adolescent WT and CHL1-null (KO) mice at P21. Mean spine density per neuron (±SEM) was significantly increased on apical but not basal dendrites of pyramidal neurons in CHL1-null mice compared with WT at P21 (*p = 1.70E-07 (PFC), 0.0377 (V1); two-tailed t test). Number of mice: 3 per genotype. Number of neurons scored: WT, n = 11 (apical), n = 10 (basal); CHL1-null, n = 10 (apical), n = 10 (basal). Scale bar, 10 μm. The total number of spines counted in each condition ranged from 280 to 563. GL, Representative images of apical and basal dendrites from Golgi-labeled pyramidal neurons and quantification of spine density in PFC layer 2/3 and V1 layer 4 of adult WT and CHL1 KO mice at P60. Mean spine density per neuron (±SEM) was significantly increased on apical but not basal dendrites of pyramidal neurons in CHL1-null mice compared with WT at P60 (*p = 0.017 (PFC), 0.0176 (V1); two-tailed t test). Number of mice: 3 per genotype. Number of neurons scored: WT, n = 10 (apical), n = 10 (basal); CHL1-null, n = 10 (apical), n = 10 (basal). Scale bar, 10 μm. The total number of spines counted in each condition ranged from 450 to 863.
Figure 2.
Figure 2.
CHL1 regulates spine morphology on apical dendrites but has no effect on dendritic branching. A, B, Representative Golgi-labeled apical and basal dendrites in PFC and V1 of adult WT and CHL1 KO mice at P60. Arrows indicate spines with thin morphology. Scale bar, 10 μm. C, Percentage of spines of different morphological types (mushroom, stubby, thin) on apical and basal dendrites of Golgi-labeled pyramidal neurons in PFC and V1 at P60. Multinomial regression analysis tested the effect of genotype on spine morphology and yielded p-values that indicated a significant difference (*) in log-odds for spines to be mushroom instead of thin or stubby for apical but not basal dendrites of CHL1 KO mice in both regions, which was seen by an increase in the proportion of thin spines at the expense of stubby and mushroom spines (Figure 2-1; *p < 0.001). WT mice (3 mice, n = 20 neurons, 886 spines) and CHL1 KO mice (3 mice, n = 27 neurons, 1105 spines). DG, Sholl analysis for dendrite arborization of pyramidal neurons in PFC and V1 of WT and CHL1-null mice at P60. Representative images are shown for Golgi-labeled pyramidal neurons in PFC (layer 2/3) and V1 (layer 4) of WT and CHL1-null mice at P60. Sholl analysis indicated no significant differences (N.S., not significant) (single-factor ANOVA) in branching of apical dendritic arbors at indicated distances (means ±SEM) within a 10–300 μm radius from the pyramidal cell body of WT (3 mice, n = 10 neurons) and CHL1-null mice (3 mice, n = 10 neurons) in (E) PFC L2/3 (p = 0.68) or (G) V1 L4 (p = 0.14). Scale bar, 100 μm. Figure 2-2 presents spine analysis at P21.
Figure 3.
Figure 3.
Increased density of excitatory spine synapses in PFC and V1 of CHL1-null mice. AD, Electron micrographs showing PSDs (arrowheads) opposed to presynaptic terminals containing synaptic vesicles, which characterize excitatory synapses in PFC, layer 2/3 and V1, layer 4 of WT and CHL1 KO mice at P60. Scale bar, 1 μm. E, Mean number of excitatory synaptic profiles with PSDs within a unit area (100 μm2; ±SEM) in PFC and V1 was increased in CHL1 KO compared with WT mice (two-tailed t test, *p = 0.022 (PFC), 0.002 (V1); n = 3 mice/genotype). The number of micrographs analyzed was as follows: for WT PFC, n = 29, WT V1, n = 51; CHL1-null PFC, n = 28; CHL1-null V1, n = 51.The total number of asymmetric synapses per genotype scored in each region was 118–211.
Figure 4.
Figure 4.
mEPSC measures in PFC layer 2/3 of CHL1-null and WT mice. A, Grand mean mEPSC waveforms for each genotype. The shaded areas represent 1 SD. mEPSCs have similar amplitudes and average shapes in each group (n = 10 cells from WT mice, 10 cells from CHL1-null mice). BG, In these plots symbols show measures for individual cells, the box plots show the mean and 25–75 percentile points, and the box plot whiskers show the 5–95 percentiles of the distribution. Points with gray diamonds are marked as potential outliers that are >1.5× the interquartile range, but were not excluded from analysis. B, Event frequencies are not different between CHL1-null and WT mice. C, Mean event amplitudes are not different between the two genotypes. D, Plot of decay to 37% of peak amplitude against 10–90% rise time for the mean events between cells. There is a positive correlation between rise time and decay time in cells from WT mice; however, CHL1-null mice did not show a strong correlation. Shaded areas correspond to 1 SD (68% confidence interval) for the regression lines for the WT data only. E, Plot of amplitude against 10–90% rise time. In WT cells the amplitudes and rise times show the expected inverse relationship (dashed line and shaded area). However in CHL1-null cells there was not a strong correlation between these measures. Shaded areas are as in D. F, There is no difference in the 10–90% rise times between the two genotypes. G, Although there was no difference in the mean total event charge between genotypes, the variability of the event charge distribution was significantly larger in CHL1-null mice (Levene's test; p = 0.017). H, Measures of the skew of the mEPSC event amplitude distribution in WT mice. H1 and H2 show amplitude distributions for all events from two cells (legend indicates mouse number and recorded cell by letter, along with the measured skew). H3 summarizes the skew values for all WT cells; all values fall between 1.5 and 3.5. I, Measures of the skew of the mEPSC event amplitude distribution in CHL1 KO mice, in the same format as H1H3. I3 shows that two of the CHL1 KO cells had a larger skew values than the rest of the cells from either WT or other CHL1 KO cells. J, Cumulative mEPSC amplitude distributions for cells from WT and CHL1 KO mice. Inset: Cumulative distribution of mEPSC amplitudes for all events from all cells of each genotype.
Figure 5.
Figure 5.
Decreased paired-pulse facilitation in CHL1-null mice compared with WT mice, but no change in NMDA to AMPA ratio. A, Example traces for EPSCs at different intervals for pyramidal cells WT and CHL1-null. The first EPSC is marked with “P1”, and is plotted for each subsequent interval (20, 50, 200, 150, and 200 ms). B, Summary of paired-pulse ratio for all cells (n = 18 WT; n = 18 CHL1-null cells). There is a significant effect of genotype (p = 0.0029) in the paired-pulse ratio; the ratio is depressed for all intervals in the CHL1-null cells. C, Example traces for EPSCs at +42 and −78 mV to measure NMDA to AMPA ratios for WT and CHL1-null. Vertical markers indicate the times where the measurements of the AMPA (gray marker) and NMDA (black marker) are made. D, There is no difference in the NMDA to AMPA ratio between the two genotypes (Mann–Whitney U; t = 33.0, p = 0.174, WT: n = 9, CHL1-null: n = 10). ns, not significant.
Figure 6.
Figure 6.
Sema3B promotes spine retraction on apical dendrites of cortical pyramidal neurons in culture from WT but not CHL1-null mice. A, Histogram depicts quantification of spine density (mean ±SEM) on apical dendrites of WT neurons (DIV14) treated with Fc, Sema3A-Fc, Sema3B-Fc, Sema3C-Fc, Sema3DFc, Sema3E-Fc, Sema3F-Fc, and EphrinA5 (5 nm, 30 min). Treatment with Sema3B-Fc and Sema3F-Fc led to significant decreases in spine density (*p = 8.64E-05 (Sema3B), 1.67E-05 (Sema3F), two-tailed t test; n = 10 neurons for each condition). The total number of spines counted in each condition ranged from 234 to 1149. B, Representative images of apical dendritic branches in Fc- and Sema3B-Fc-treated neuronal cultures from WT and CHL1 KO mice. Scale bar, 10 μm. C, Representative images of apical dendrites in Fc and Sema3F-Fc neuronal cultures from WT and CHL1 KO mice. Scale bar, 10 μm. D, Quantification of spine density (mean ±SEM) in WT and CHL1-null neuronal cultures treated with Fc, Sema3B-Fc, or Sema3F-Fc. Sema3B-Fc led to a significant decrease in mean spine density per neuron (±SEM) for WT but not CHL1 KO neurons (*p = 0.005, two-tailed t test). Sema3F-Fc led to a significant decrease in spine density for WT and CHL1 KO [*p = 1.40E-06 (WT), 6.48E-09 (CHL1 KO), two-tailed t test]. Number of neurons scored: WT, n = 10 (Fc), n = 10 (Sema3B-Fc), n = 14 (Fc), n = 14 (Sema3F-Fc); CHL1-null, n = 18 (Fc), n = 18 (Sema3B-Fc), n = 16 (Fc), n = 17 (Sema3F-Fc). The total number of spines counted in each condition ranged from 234 to 1098.
Figure 7.
Figure 7.
Localization of CHL1 and Sema3B in cortical pyramidal neurons in postnatal mouse neocortex. AJ, Nex1-CreERT2:Ai9 mice were induced to express tdTomato in postmitotic pyramidal neurons by tamoxifen injections (P10–P14), and brains were harvested at P21. Immunofluorescence staining was carried out for CHL1 and Sema3B in coronal sections of PFC and V1. Nonimmune IgG control is shown as an inset (C,F). Scale bar, 100 μm. A, D, Left panels show tdTomato labeling in unstained sections of PFC and V1. Larger right panels show localization of CHL1 (blue) in cell bodies of tdTomato-positive neurons (red), appearing as magenta. B, E, Localization of Sema3B (green) in cell bodies of tdTomato-positive neurons (red), appearing as yellow. C, F, Colocalization of CHL1 (blue) and Sema3B (green) in cell bodies of tdTomato- positive pyramidal neurons (red), appearing as white. GJ, Higher magnification of images of apical dendrites in the same sections shows co localization of CHL1 and Sema3B on numerous spines (white).
Figure 8.
Figure 8.
Developmental regulation of CHL1 and Sema3B, and association of CHL1 with Sema3B receptor subunits. A, Expression of CHL1 and Sema3B in cortical lysates (equal amounts of protein) from WT mice during postnatal development (P7, P14, P30, and adult). Reprobing of the same blot for actin is shown below. Levels of expression of CHL1 and Sema3B relative to actin are calculated from densitometric scanning. B, Equal amounts of protein from the synaptoneurosome fraction of P28 mouse brain were immunoprecipitated with CHL1 antibodies (CHL1 IP), and associated Npn1/2 or PlexA1-4 were identified by immunoblotting. Equivalent exposures of immunoblots show that CHL1 coimmunoprecipitated with Npn2 to a much greater extent than with Npn1, and associated with PlexA4 but not detectably with PlexA1, PlexA2, or PlexA3. Input lanes demonstrate the presence of each protein in the synaptoneurosome fraction. This experiment was repeated 6 times with similar results. C, CHL1 associated with Npn2 as shown by coimmunoprecipitation from HEK293T cells transfected with CHL1 and Npn2. CHL1 was immunoprecipitated from cell lysates (500 μg) with CHL1 antibodies (CHL1 IP) or control normal IgG (nIg), and immunoprecipitated proteins or input samples (50 μg) were subjected to immunoblotting with Npn2 or CHL1 antibodies. D, Sema3B-Fc or Fc proteins (10 nm) were incubated with HEK293T cells expressing CHL1 for 30 min, then washed extensively, and lysed. Fc proteins were pulled down from equal amounts of lysates with Protein A/G-Sepharose, and immunoblotted for CHL1. Input lanes demonstrate equivalent levels of CHL1 expression in cell lysates. Results of prolonged exposure of blots show no direct binding of Sema3B-Fc or control Fc to cells expressing CHL1. E, PlexA4 coimmunoprecipitated with Npn2 from equal amounts (500 μg) of cortical lysates of WT but not CHL1-null (KO) mice. NIg, Normal IgG control. Blots were reprobed with antibodies to Npn2 and CHL1 in panels below. F, Schematic of the Sema3B holoreceptor complex containing CHL1, Npn2, and PlexA4 leading to Sema3B-induced spine retraction. CHL1 domains include Ig-like domains 1–5 and fibronectin III-like domains (FN). Rap-GAP (Rap1 GTPase-activating protein). This experiment was repeated three times with similar results. G, Cortical neuron cultures were treated with or without gabazine (20 μm) for 48 h. Conditioned medium was harvested from cultures at the same plating density and equivalent amounts were analyzed by immunoblotting with Sema3B antibodies. Cell lysates (equal protein) prepared from cultures from which conditioned media was removed were analyzed by immunoblotting for β-actin and Sema3B. H, Histogram depicts the fold change in Sema3B levels in conditioned medium relative to actin in the cell lysates (mean ±SEM; n = 3, *p = 0.029, t test).
Figure 9.
Figure 9.
Selective elimination of spines by Sema3B and Sema3F. A, Apical dendrites from GFP-expressing cortical neurons (green) in DIV14 cultures were treated with either Fc or Sema3B-Fc (5 nm) for 30 min, then immunostained for CHL1 (red). CHL1-positive spines were selectively eliminated. Arrows point to residual CHL1-negative spines. Scale bar, 10 μm. B, Histogram depicting a significant decrease in the percentage of CHL1-positive spines in Sema3B-Fc-treated neurons (*p = 0.001, two-tailed t test, n = 10 neurons per condition). C, Histogram shows decreased spine density (mean ±SEM) in Sema3B-Fc-treated neurons versus Fc-treated neurons (*p = 3.8E-06, two-tailed t test, n = 10 neurons per condition). Total spines counted for each condition ranged from 171 to 343. D, Apical dendrites from GFP-expressing cortical neurons (green) in DIV14 cultures were treated with either Fc or Sema3F-Fc (5 nm) for 30 min, then immunostained for NrCAM (red). NrCAM-positive spines were selectively eliminated. Arrows point to residual NrCAM-negative spines. Scale bar, 10 μm. E, Histogram depicting a significant decrease in the percentage of NrCAM-positive spines in Sema3F-Fc-treated neurons (*p = 0.00013, two-tailed t test, n = 10 neurons per condition). F, Histogram showing decreased spine density (mean ±SEM) in Sema3F-Fc-treated neurons versus Fc-treated neurons (*p = 2.4E-05, t test, n = 10 neurons per condition). Total spines counted for each condition ranged from 76 to 204. G, Apical dendrites from GFP-expressing cortical neurons (green) in DIV14 cultures were treated with either Fc or Sema3B-Fc (5 nm) for 30 min and then immunostained for NrCAM (red). The majority of remaining spines after Sema3B-Fc treatment were NrCAM-positive (arrows). Scale bar, 10 μm. H, Apical dendrites from GFP-expressing cortical neurons (green) in DIV14 cultures were treated with either Fc or Sema3F-Fc (5 nm) for 30 min and then immunostained for CHL1 (red). Arrows point to residual CHL1-positive spines. Scale bar, 10 μm. I, Histogram depicting a significant increase in the percentage of NrCAM-positive spines in Sema3B-Fc-treated neurons (*p = 0.002, two-tailed t test, n = 10 neurons per condition). J, Histogram showing decreased spine density (mean ±SEM) in Sema3B-Fc-treated neurons versus Fc-treated controls (*p = 0.005, two-tailed t test, n = 5 neurons per condition). K, Histogram depicting a significant increase in the percentage of CHL1-positive spines in Sema3F-Fc-treated neurons (*p = 7.3E-06, two-tailed t test, n = 10 neurons per condition). L, Histogram showing decreased spine density (mean ±SEM) in Sema3B-Fc-treated neurons versus Fc-treated neurons (*p = 0.001, two-tailed t test, n = 5 neurons per condition). M, Apical dendrites from GFP-expressing cortical neurons (green) in DIV14 cultures were treated with either Fc or Sema3F-Fc (5 nm) for 30 min and then immunostained for CHL1 (blue) and NrCAM (red). Yellow spines are NrCAM-positive; cyan spines are CHL1-positive; and white spines are positive for both CHL1 and NrCAM. Arrows point to residual NrCAM-positive spines. Scale bar, 10 μm. N, Histogram depicts a significant increase in the percentage of NrCAM-positive spines in Sema3B-Fc-treated neurons (*p = 0.01, two-tailed t test, n = 10 neurons per condition) and a significant reduction in percentage of CHL1-positive spines (*p = 0.015, two-tailed t test, n = 10 neurons). O, Immunofluorescence staining of CHL1 in GFP-expressing cortical neuron in culture showing localization on both apical and basal dendrites of pyramidal-type neuron. P, Immunofluorescence staining of Npn2 in GFP-expressing cortical neuron cultures showing Npn2 localization to apical but not basal dendrites of pyramidal-type neuron.

Comment in

Similar articles

Cited by

References

    1. Adams RH, Lohrum M, Klostermann A, Betz H, Püschel AW (1997) The chemorepulsive activity of secreted semaphorins is regulated by furin-dependent proteolytic processing. EMBO J 16:6077–6086. 10.1093/emboj/16.20.6077 - DOI - PMC - PubMed
    1. Agarwal A, Dibaj P, Kassmann CM, Goebbels S, Nave KA, Schwab MH (2012) In vivo imaging and noninvasive ablation of pyramidal neurons in adult NEX-CreERT2 mice. Cereb Cortex 22:1473–1486. 10.1093/cercor/bhr214 - DOI - PubMed
    1. Agresti A. (2013) Categorical data analysis, Ed 3 New York: Wiley.
    1. Angeloni D, Lindor NM, Pack S, Latif F, Wei MH, Lerman MI (1999) CALL gene is haploinsufficient in a 3p- syndrome patient. Am J Med Genet 86:482–485. 10.1002/(SICI)1096-8628(19991029)86:5<482::AID-AJMG15>3.0.CO;2-L - DOI - PubMed
    1. Beaulieu-Laroche L, Harnett MT (2018) Dendritic spines prevent synaptic voltage clamp. Neuron 97:75–82.e3. 10.1016/j.neuron.2017.11.016 - DOI - PubMed

Publication types

MeSH terms

LinkOut - more resources